Streamlining Justice: How Rapid Technologies Are Revolutionizing Forensic Chemistry Workflows
This article explores the transformative impact of rapid technologies on forensic chemistry workflows, addressing a critical need for efficiency in laboratories facing growing evidence backlogs.
Streamlining Justice: How Rapid Technologies Are Revolutionizing Forensic Chemistry Workflows
Abstract
This article explores the transformative impact of rapid technologies on forensic chemistry workflows, addressing a critical need for efficiency in laboratories facing growing evidence backlogs. Aimed at researchers, scientists, and drug development professionals, it provides a comprehensive analysis spanning from foundational principles to practical implementation. We examine cutting-edge methodologies like rapid GC-MS and direct analysis techniques, delve into optimization strategies for enhanced sensitivity and throughput, and critically evaluate validation frameworks and comparative performance against traditional methods. The synthesis of these insights offers a roadmap for integrating accelerated technologies to achieve faster, reliable, and actionable forensic results.
The Driving Force for Speed: Understanding the Need for Rapid Forensic Technologies
The convergence of rising drug-related crimes and increasing operational pressures has created a critical bottleneck in forensic laboratories worldwide. This backlog delays justice, compromises public safety, and hinders the effective prosecution of drug offenses. Data from a 2025 market analysis projects the global forensic technology market to expand from USD 6.46 billion in 2025 to USD 15.86 billion by 2035, driven significantly by these escalating challenges [1]. A primary growth driver is the surging popularity of DNA testing, which provides highly reliable evidence but requires significant time and resources [1].
Forensic laboratories are further strained by legislative mandates requiring the testing of all sexual assault kits, often without additional funding, and growing pressure to apply DNA analysis to property crimes and cold cases [2]. The core of the problem is a resource gap; the 2019 NIJ Needs Assessment identified an annual shortfall of $640 million just to meet current forensic demand, with another $270 million needed to address the opioid crisis [2]. The consequences are quantifiable: between 2017 and 2023, turnaround times for DNA casework increased by 88%, while controlled substances analysis ballooned by 232% [2]. This document outlines advanced protocols and data-driven strategies to enhance efficiency and throughput in forensic chemistry workflows, directly addressing this systemic backlog.
Quantitative Data on Forensic Backlogs and Efficiency
The following tables synthesize key quantitative data illustrating the scale of the forensic backlog and the measurable impact of implemented efficiency solutions.
Table 1: Forensic Casework Turnaround Time Increases (2017-2023) Data sourced from Project FORESIGHT and the Consortium of Forensic Science Organizations (CFSO) [2]
| Forensic Discipline | Increase in Turnaround Time |
|---|---|
| DNA Casework | 88% |
| Crime Scene Evidence | 25% |
| Post-mortem Toxicology | 246% |
| Controlled Substances | 232% |
Table 2: Impact of Efficiency Interventions on Laboratory Performance
| Laboratory / Initiative | Key Intervention | Outcome |
|---|---|---|
| Louisiana State Police | Lean Six Sigma Implementation [2] | Turnaround time dropped from 291 days to 31 days; throughput tripled to 160 cases/month. |
| Michigan State Police | CEBR-Funded Technical Innovation (Validated low-input DNA methods) [2] | 17% increase in interpretable DNA profiles from complex evidence within 12 months. |
| Global Forensic Tech Market | Adoption of advanced technologies (AI, Rapid DNA) [1] | Projected market growth from USD 6.46B (2025) to USD 15.86B (2035) at a 9.4% CAGR. |
Experimental Protocols for Enhanced Forensic Workflows
Protocol: Statistical Design of Experiments (DoE) for Method Optimization
This protocol provides a systematic approach to optimizing complex analytical methods, such as the extraction of drugs from biological specimens, by efficiently evaluating multiple variables simultaneously [3].
1. Principle Statistical Design of Experiments (DoE) is a mathematical framework that evaluates the relationship between independent variables (factors) and dependent variables (responses). It supersedes the inefficient "one-factor-at-a-time" (OFAT) approach by allowing for the assessment of interaction effects between factors, leading to fewer experiments, lower costs, and reduced consumption of valuable samples and reagents [3].
2. Applications in Forensic Analysis
- Optimization of Sample Preparation: DoE is predominantly used to optimize parameters in extraction techniques like Liquid-Liquid Extraction (LLE), Solid-Phase Extraction (SPE), and dispersive liquid–liquid microextraction (DLLME) [3].
- Critical Variables: Common factors include solvent type and volume, pH, temperature, extraction time, and sorbent type [3].
- Chromatographic Parameters: While less common, DoE can also optimize instrument settings for LC-MS/MS or GC-MS, such as injection volume, flow rate, and column temperature [3].
3. Step-by-Step Procedure
- Step 1: Selection of Independent Variables. Identify critical factors (e.g., pH, solvent volume, temperature) through literature review, preliminary OFAT studies, or screening designs [3].
- Step 2: Screening Design Execution. When dealing with many potential factors, use a screening design (e.g., Plackett-Burman or Fractional Factorial Design) to identify the variables with the most significant impact on the response (e.g., analyte recovery, peak area) [3].
- Step 3: Response Surface Methodology (RSM). Employ a quadratic design like Box-Behnken or Central Composite Design to model the system and locate the optimal conditions. These designs generate a polynomial equation that describes the relationship between factors and responses [3].
- Step 4: Model Validation and Optimization. Statistically validate the generated model for adequacy and predictive utility. Use Response Surface Methodology (RSM) to visualize the relationship and pinpoint the factor levels that produce a maximal or minimal response, as defined by the researcher's criteria [3].
Protocol: Quantitative Analysis via Standard Addition
This protocol details the standard addition method, an alternative quantitative approach particularly valuable for analyzing emerging novel psychoactive substances (NPS) in complex biological matrices [4].
1. Principle Standard addition is an internal calibration technique used to determine the concentration of an analyte in a sample where the matrix may cause interference. Known amounts of the analyte standard are added directly to aliquots of the sample. The concentration in the original sample is determined by extrapolating the calibration curve back to the x-axis [4].
2. Applications in Forensic Toxicology
- Emerging Novel Psychoactive Substances (NPS): Ideal for quantifying NPS like isotonitazene (opioid) or eutylone (stimulant) where traditional validated methods may not exist and their short lifespan makes full validation impractical [4].
- Complex Matrices: Effective for analyzing drugs in blood, urine, and other biological samples where matrix effects can suppress or enhance instrument signal [4].
3. Step-by-Step Procedure
- Step 1: Sample Aliquoting. Aliquot a case sample into four replicates [4].
- Step 2: Standard Fortification.
- Leave one aliquot as an unfortified "blank".
- Fortify the three remaining aliquots with the target drug standard at appropriate, increasing concentrations [4].
- Step 3: Sample Preparation and Analysis. Add internal standard to all four aliquots. Proceed with a standardized sample preparation (e.g., Liquid-Liquid Extraction). Analyze all aliquots using LC-MS/MS [4].
- Step 4: Data Calculation and Interpretation.
- Plot the peak area ratio (analyte/internal standard) against the concentration of the standard added to each aliquot [4].
- Fit a linear trendline through all data points (R² > 0.98 is recommended) [4].
- Calculate the x-intercept of the trendline. The absolute value of the x-intercept represents the concentration of the drug in the original, unfortified sample [4].
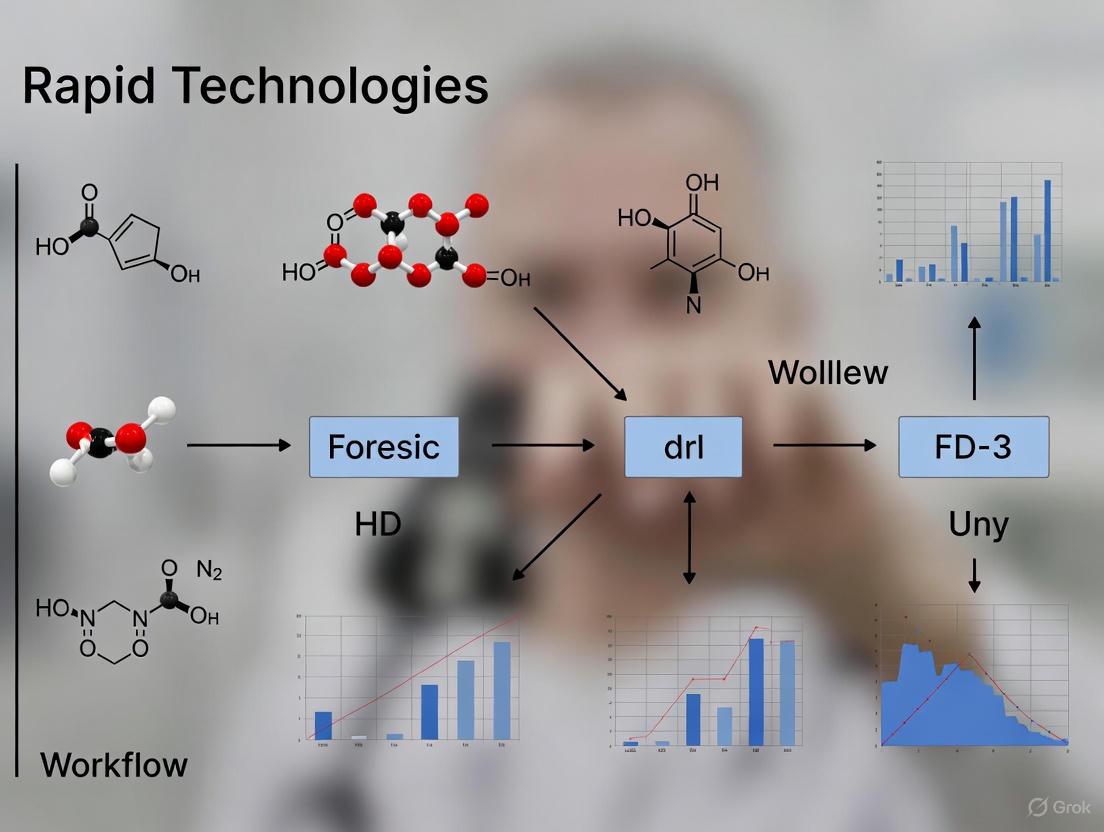
Workflow Visualization
The following diagram synthesizes the experimental protocols into a unified, efficient workflow for the analysis of controlled substances in forensic casework.
The Scientist's Toolkit: Research Reagent Solutions
Table 3: Essential Reagents and Materials for Advanced Forensic Toxicology
| Item | Function / Application |
|---|---|
| Liquid Chromatography Tandem Mass Spectrometry (LC-MS/MS) | High-sensitivity detection, identification, and quantification of a wide range of drugs and metabolites, including Novel Psychoactive Substances (NPS) [4]. |
| Statistical Design of Experiments (DoE) Software | Software tools to plan screening and optimization experiments, analyze results, and build predictive models for method development [3]. |
| Novel Psychoactive Substance (NPS) Standards | Certified reference materials for emerging drugs, essential for accurate identification and quantification using techniques like standard addition [4]. |
| Liquid-Liquid Extraction (LLE) Solvents | Solvent systems (e.g., N-butyl chloride and ethyl acetate) for isolating drugs from complex biological matrices like blood prior to analysis [4]. |
| Buffers (e.g., Borax Buffer, pH 10.4) | Used to adjust the pH of samples during extraction to ensure optimal recovery of specific drug classes [4]. |
| Internal Standards (Isotope-Labeled) | Compounds added to samples to correct for variability in sample preparation and instrument analysis, improving quantitative accuracy [4]. |
The integration of rapid diagnostic technologies is revolutionizing forensic chemistry workflows, dramatically increasing efficiency from sample to result. This application note details the implementation of a portable molecular diagnostic platform, leveraging power-free nucleic acid extraction and colorimetric LAMP chemistry, to achieve high-sensitivity detection in under 40 minutes. We provide a detailed protocol and quantitative performance data to guide researchers in adopting these accelerated methodologies for forensic analysis, demonstrating how they address critical bottlenecks in evidence processing and casework prioritization [5].
In the context of forensic science, "rapid" is evolving from a qualitative desire to a quantitative metric, defined by specific technological benchmarks that compress traditional multi-day laboratory processes into workflows lasting minutes. The 2025 Emanuele Russo Delphi consensus on rapid microbiological methods emphasizes the critical importance of interpretation within a specific clinical context and the clinical usefulness of turnaround times <24 hours, principles that are directly transferable to forensic evidence analysis [6]. The pressing need for such efficiency is underscored by substantial backlogs in crime labs, where advanced technologies can enable data-driven case management and evidence prioritization to accelerate justice [7]. This document outlines a sample-to-result platform and protocol that embodies this new definition of "rapid," providing forensic chemists and toxicologists with a framework to integrate speed without compromising analytical rigor.
Performance Data & Comparative Analysis
The Dragonfly platform was validated for the detection of skin-tropic viruses, a model system with direct relevance to forensic investigations of infectious agents. The platform's performance, benchmarked against gold-standard extracted qPCR, demonstrates that rapid technologies can deliver high fidelity [5].
Table 1: Analytical and Clinical Performance of the Rapid Platform
| Performance Metric | Result | Validation Method |
|---|---|---|
| Time-to-Result | < 40 minutes | Full workflow from sample input to visual readout [5] |
| Nucleic Acid Extraction Time | < 5 minutes | Power-free magnetic bead-based method [5] |
| Analytical LoD (Mpox Virus) | 100 genome copies per reaction | Colorimetric LAMP assay [5] |
| Clinical Sensitivity (OPXV) | 96.1% | Testing on 164 clinical samples (51 mpox-positive) [5] |
| Clinical Specificity (OPXV) | 100% | Testing on 164 clinical samples [5] |
| Clinical Sensitivity (MPXV) | 94.1% | Testing on 164 clinical samples [5] |
| Clinical Specificity (MPXV) | 100% | Testing on 164 clinical samples [5] |
The power-free nucleic acid extraction, a key innovation, completes in under 5 minutes, eliminating a major bottleneck in traditional lab workflows and the need for centralized instrumentation [5].
Experimental Protocol: Rapid Molecular Detection
Principle
This protocol utilizes a portable, sample-to-result system that integrates power-free nucleic acid extraction via a magnetic SmartLid and magnetic beads with lyophilised colourimetric Loop-Mediated Isothermal Amplification (LAMP) for the specific detection of target nucleic acids. Amplification causes a pH shift, resulting in a colour change of the reaction mix from pink (negative) to yellow (positive), enabling equipment-free visual interpretation [5].
Reagents and Equipment
- Portable Extraction Kit: Cardboard tray containing colour-coded, pre-aliquoted buffer tubes (Lysis-binding [red], Wash [yellow], Elution [green]), disposable exact-volume pipettes, and the
SmartLid[5]. - Lyophilised Colourimetric LAMP Panel: Single-tube assays stored at room temperature.
- Low-Cost Isothermal Heat Block: Maintains a constant temperature of 60-65 °C.
- Sample Collection Kit: Swab and inactivating medium (e.g., COPAN eNAT).
- Timer.
Procedure
A. Sample Preparation
- Collect the specimen using a swab and place it into the inactivating medium tube.
- Vortex the sample tube briefly to ensure the specimen is well-mixed in the medium.
B. Power-Free Nucleic Acid Extraction (< 5 min)
Note: The cardboard packaging of the extraction kit functions as the workstation. Place the sample tube in the designated space.
- Lysis-Binding: Using the provided exact-volume pipette, transfer the specified volume of inactivated sample to the red-capped lysis-binding tube. Close the cap and mix by inverting 10 times. Incubate for 1 minute at room temperature.
- Bead Capture: Place the
SmartLidonto the red tube to capture the magnetic beads with bound nucleic acids. Wait for 30 seconds. - Wash Transfer: While holding the
SmartLidwith the captured beads, transfer it to the yellow-capped wash tube. Submerge the beads, release them from the lid by agitating, and close the cap. Mix by inverting 10 times. - Bead Re-capture: Place the
SmartLidback onto the yellow tube to re-capture the beads. Wait for 30 seconds. - Elution: Transfer the
SmartLidwith the beads to the green-capped elution tube. Submerge the beads, release them, and close the cap. Mix by inverting 10 times. Incubate for 2 minutes at room temperature. - Final Capture: Place the
SmartLidonto the green tube one final time to capture the beads, leaving purified nucleic acids in the elution buffer. The eluate is now ready for amplification.
C. Colorimetric LAMP Amplification and Detection (< 35 min)
- Reconstitute the lyophilised LAMP pellet in the specified tube with the required volume of the purified nucleic acid eluate from the previous step.
- Incubate the reaction tube in the pre-heated isothermal heat block at 65 °C for 35 minutes.
- Interpret Results immediately after incubation. A colour change from pink to yellow indicates a positive result. No colour change (pink remains) indicates a negative result.
Safety and Quality Control
- Personal Protective Equipment (PPE): Wear gloves, a lab coat, and eye protection during specimen handling and testing [8].
- Prevent Cross-Contamination: Change gloves between handling different samples, especially when processing specimens in batches [8].
- Waste Disposal: Decontaminate all instruments after use and dispose of all used test components as biohazardous waste in compliance with local regulations [8].
Workflow Visualization
Rapid Sample-to-Result Workflow: This diagram illustrates the streamlined, sub-40-minute process from sample input to final readout, highlighting the power-free nucleic acid extraction steps and the colorimetric detection [5].
The Scientist's Toolkit: Research Reagent Solutions
Table 2: Essential Materials for Rapid Molecular Workflow
| Item | Function | Key Characteristic |
|---|---|---|
| SmartLid & Magnetic Beads | Power-free nucleic acid extraction and purification from complex samples. | Enables sub-5-minute extraction without centrifugation or electricity [5]. |
| Lyophilised Colourimetric LAMP Mix | Isothermal amplification of target DNA/sequences. | Room-temperature stable; visual (colorimetric) readout eliminates need for fluorescent detection hardware [5]. |
| Pre-aliquoted Buffer Tray | Contains all necessary reagents for the extraction process. | Color-coded (red-yellow-green) for foolproof workflow; integrated with packaging [5]. |
| Inactivating Sample Medium | Stabilizes the specimen and inactivates pathogens for safe transport and handling. | Ensures user safety and sample integrity from point-of-collection to testing [5]. |
| Low-Cost Isothermal Heat Block | Maintains constant temperature required for LAMP reaction. | Eliminates need for expensive thermocyclers; enables deployment in low-resource settings [5]. |
Advanced instrumentation is fundamentally transforming forensic chemistry workflows by integrating miniaturization, automation, and intelligent data analysis. These core principles directly address critical challenges in modern forensic laboratories, including growing case backlogs, the complexity of new psychoactive substances (NPS), and the need for rapid, on-site intelligence [9] [10]. The migration of analytical techniques from centralized laboratories to the field or production environment enables a paradigm shift from delayed, batch-processed results to immediate, data-driven decision-making.
This application note details how these principles are applied in specific technological implementations, providing validated protocols and quantitative data to illustrate the dramatic gains in analytical efficiency.
Principles and Instrumentation
The push for faster analysis is underpinned by three interconnected core principles, each enabled by specific technological advancements.
Principle 1: Miniaturization and Portability
The development of compact, portable analytical devices allows for preliminary testing and evidence triage at the point of need, such as a crime scene or border checkpoint. This eliminates the delay associated with evidence transport and chain-of-custody procedures, providing immediate investigative leads.
Exemplar Technology: Portable Voltammetric Sensor for Synthetic Cannabinoids. This system utilizes a 3D-printed electrochemical cell integrated with a commercial boron-doped diamond electrode (BDDE) and a smartphone-controlled portable potentiostat [9].
- Quantitative Performance Data:
| Parameter | Performance Metric | Impact on Efficiency |
|---|---|---|
| Analysis Time | < 1 minute per sample [9] | Enables rapid screening of multiple samples on-site. |
| Limit of Detection (LOD) | 0.28 µmol L⁻¹ [9] | Sufficiently sensitive for typical concentrations in seized materials. |
| Linear Range | 1.0 – 200.0 µmol L⁻¹ [9] | Covers a wide range of potential concentrations without dilution. |
| Accuracy (vs. GC-MS) | 83% (in seized street drug samples) [9] | Provides reliable preliminary data to prioritize lab resources. |
Principle 2: Automation and Integrated Workflows
End-to-end automation of analytical processes—from sample introduction to result interpretation and reporting—minimizes manual intervention, reduces operator-to-operator variability, and maximizes throughput.
Exemplar Technology: NMR-based Advanced Chemical Profiling (ACP). This software solution automates the entire NMR workflow, from sample loading and data acquisition to processing, identification, quantification, and report filing [11]. It is designed for use by non-expert operators in high-throughput environments like quality control and forensic narcotics testing.
- Quantitative Workflow Enhancement:
| Workflow Stage | Traditional Manual Process | Automated ACP Process | Efficiency Gain |
|---|---|---|---|
| Data Processing | Manual phase and baseline correction | Fully automated, operator-independent | Saves minutes to hours per sample; ensures consistency. |
| Identification/Quantification | Expert spectroscopist analysis | Automated database matching and calibration | Frees expert time; allows 24/7 operation. |
| Report Generation | Manual compilation | Automated, standardized report filing | Eliminates transcription errors and reporting delays. |
Principle 3: Intelligent Data Analysis and Statistical Learning
Advanced instrumentation generates complex, high-dimensional data. Chemometrics and statistical learning tools are required to extract meaningful, objective, and defensible conclusions from this data, moving beyond subjective pattern matching.
Exemplar Technology: Quantitative Fracture Surface Topography Analysis. This method uses 3D microscopy to map the topography of fractured surfaces (e.g., a broken knife tip). Spectral analysis and multivariate statistics are then employed to quantitatively classify surfaces as "match" or "non-match" with a calculable error rate [12].
- Quantitative Matching Performance:
| Data Feature | Application in Statistical Learning | Impact on Reliability |
|---|---|---|
| Surface Roughness | Height-height correlation function captures uniqueness at a transition scale of ~50-70 μm [12]. | Provides an objective, measurable fingerprint of the fracture surface. |
| Spectral Topography | Multiple topographical frequency bands are combined into a multivariate model [12]. | Improves discrimination power between matching and non-matching surfaces. |
| Model Output | Generates a likelihood ratio for classification [12]. | Provides a statistical foundation for testimony, addressing legal standards like Daubert. |
Experimental Protocols
Protocol 1: Rapid On-Site Screening of ADB-butinaca via Portable Voltammetry
Application: Preliminary identification of the synthetic cannabinoid ADB-butinaca in seized materials.
1.1 Materials and Reagents
- Portable Electrochemical Platform: 3D-printed cell with integrated Boron-Doped Diamond Electrode (BDDE), Ag/AgCl reference electrode, and Pt auxiliary electrode [9].
- Handheld Potentiostat: Smartphone-controlled device.
- Britton-Robinson (BR) Buffer: pH 2.0 – 10.0, as supporting electrolyte.
- Methanol: HPLC grade, for sample dissolution.
- Standard Solutions: ADB-butinaca certified reference standard for calibration.
1.2 Sample Preparation
- Extract a small sub-sample (e.g., 1-2 mg) from the seized material.
- Dissolve the sub-sample in 1.0 mL of methanol and vortex mix for 30 seconds.
- Dilute a 100 µL aliquot of the methanolic solution in 10.0 mL of BR buffer (pH 7.0) to achieve a suitable concentration within the sensor's linear range.
1.3 Instrumental Analysis
- Place 3.0 mL of the diluted sample solution into the 3D-printed electrochemical cell.
- Using the smartphone application, initiate the voltammetric method:
- Technique: Square-Wave Voltammetry (SWV).
- Potential Range: Optimized for ADB-butinaca oxidation (e.g., +0.8 to +1.4 V vs. Ag/AgCl).
- Parameters: Frequency 20 Hz, amplitude 50 mV, step potential 2 mV.
- The acquisition is complete in less than 60 seconds. The software displays the voltammogram and identifies the characteristic peak of ADB-butinaca.
1.4 Data Interpretation
- A positive screening result is indicated by the presence of an oxidation peak at the characteristic potential for ADB-butinaca.
- All positive screening results must be confirmed by a validated laboratory-based technique, such as GC-MS [9].
Protocol 2: Automated Identification and Quantification of Narcotics via NMR
Application: High-throughput, operator-independent analysis of narcotics and new psychoactive substances (NPS) in pure form or complex mixtures.
2.1 Materials and Reagents
- NMR Spectrometer: Equipped with liquid handler and Advanced Chemical Profiling (ACP) software [11].
- NMR Solvent: Deuterated solvent (e.g., DMSO-d6, CDCl3).
- Internal Standard: Certified reference standard for quantification (e.g., TMS, maleic acid).
- NMR Tubes: Standard 5 mm tubes.
2.2 Sample Preparation
- Accurately weigh ~2-5 mg of the unknown forensic sample.
- Transfer the sample to an NMR tube.
- Add 0.6 mL of deuterated solvent containing a known concentration of internal standard.
2.3 Instrumental Analysis
- Load the sample tray with prepared NMR tubes.
- In the ACP software, select the pre-validated method for "Narcotics Screening".
- Initiate the automated sequence. The system (IconNMR and TopSpin) automatically:
- Locks, shims, and tunes the spectrometer for each sample.
- Acquires the 1D 1H-NMR spectrum.
- Processes the data (Fourier transform, phasing, baseline correction).
- Compares the processed spectrum against a curated database of narcotics and cutting agents.
- Identifies and quantifies all detectable constituents using the internal standard.
- Generates a comprehensive report.
2.4 Data Interpretation
- The ACP report provides a list of identified compounds with their respective concentrations.
- The report flags unknown signals that do not match the database, potentially indicating a New Psychoactive Substance (NPS) [11].
Workflow Visualizations
On-Site Drug Screening Workflow
Automated NMR Workflow
The Scientist's Toolkit: Essential Research Reagents and Materials
| Item | Function / Application |
|---|---|
| Boron-Doped Diamond Electrode (BDDE) | Robust, reusable sensor for electrochemical detection; provides a wide potential window and low background current [9]. |
| Britton-Robinson (BR) Buffer | A versatile supporting electrolyte for electroanalysis; its pH can be adjusted to optimize the electrochemical response of different analytes [9]. |
| Deuterated NMR Solvents (e.g., DMSO-d6) | Provides a signal-free environment for NMR analysis, allowing the solute's signals to be observed without interference. |
| Internal Standard (e.g., TMS) | Added in known concentration to the NMR sample; allows for precise quantification of identified compounds [11]. |
| Certified Reference Standards | Pure, authenticated analytical standards of target analytes (e.g., ADB-butinaca); essential for method development, calibration, and validation [9] [11]. |
| 3D Printing Filament (e.g., PLA, ABS) | Enables rapid, low-cost, and customizable fabrication of analytical devices and sample holders, such as the electrochemical cell [9]. |
Forensic science is undergoing a significant transformation, driven by the need for greater efficiency, reliability, and throughput in crime laboratories. The National Institute of Justice (NIJ) has established a comprehensive Forensic Science Strategic Research Plan for 2022-2026 to address these challenges through coordinated research and development [13]. This document frames the strategic priority of advancing rapid technologies within the context of this national framework, providing detailed application notes and experimental protocols to support researchers and forensic practitioners in enhancing workflow efficiency, particularly in the analysis of seized drugs and other chemical evidence.
A core objective of the NIJ's strategic plan is the "Application of Existing Technologies and Methods for Forensic Purposes," which explicitly calls for "rapid technologies to increase efficiency" [13]. This aligns with the broader community goal of meeting increasing demands for quality forensic services in the face of constrained resources. The integration of both qualitative analysis (identifying the presence or absence of substances) and quantitative analysis (determining their precise concentrations) is fundamental to this process, forming the basis for reliable and actionable forensic results [14] [15].
Strategic Priority: Rapid Technologies for Increased Efficiency
The NIJ's first strategic priority is to "Advance Applied Research and Development in Forensic Science" [13]. Within this priority, several objectives directly support the adoption and development of technologies that streamline forensic chemistry workflows.
Table 1: NIJ Strategic Objectives Supporting Workflow Efficiency
| Strategic Objective | Description | Impact on Forensic Efficiency |
|---|---|---|
| I.1. Application of Existing Technologies | Tools that increase sensitivity/specificity and rapid technologies to increase efficiency [13]. | Enables faster screening and analysis with fewer resources, reducing case backlogs. |
| I.4. Technologies Expediting Information Delivery | Expanded triaging tools and techniques to develop actionable results [13]. | Allows labs to prioritize evidence and provide investigators with timely intelligence. |
| I.6. Standard Criteria for Analysis | Evaluation of expanded conclusion scales and methods to express the weight of evidence [13]. | Streamlines interpretation and reporting, making results more consistent and understandable. |
The transition from traditional, often slower, wet-chemical techniques to advanced instrumental methods is key to this efficiency gain. While qualitative tests can confirm the presence of a substance, quantitative analysis is crucial for determining the concentration of an analyte, such as the precise amount of an illicit drug in a seized sample or the blood alcohol level in a suspect [14] [15]. Techniques like chromatography and spectroscopy, which can be adapted for both qualitative and quantitative purposes, are at the forefront of this modernization effort [14].
Analytical Techniques and Protocols for Efficient Workflows
Modern forensic laboratories employ a suite of sophisticated analytical techniques that provide both high-throughput screening and confirmatory quantitative results. The following protocols outline key methods for the analysis of seized drugs, a common and time-sensitive task in forensic chemistry.
Protocol 1: Rapid Screening of Seized Drugs Using FTIR Spectroscopy
Fourier Transform Infrared (FTIR) Spectroscopy is a powerful technique for the rapid identification of organic compounds based on their molecular bond vibrations and functional groups [16].
- Principle: A sample is bombarded with multiple wavelengths of infrared light. The resulting absorption spectrum creates a unique molecular "fingerprint" that can be compared against reference libraries for identification [16].
- Materials:
- FTIR spectrometer
- Attenuated Total Reflectance (ATR) accessory
- Solid or liquid sample
- Hydrophobic wipes and solvent (e.g., methanol) for cleaning
- Procedure:
- Clean the ATR crystal thoroughly with solvent and allow it to dry.
- Place a small amount of the solid sample directly onto the ATR crystal. For liquids, apply a small droplet.
- Apply pressure to ensure good contact between the sample and the crystal.
- Acquire the infrared spectrum (typically over a range of 4000-400 cm⁻¹).
- Compare the acquired spectrum against a validated library of known controlled substances and cutting agents.
- Applications: FTIR is highly effective for distinguishing between explosives, solvents, plastics, and different drug classes [16]. It is primarily used for identification (qualitative analysis) but can be used for semi-quantitative analysis [16].
Protocol 2: Confirmatory Analysis and Quantitation Using Gas Chromatography-Mass Spectrometry (GC-MS)
GC-MS is a gold-standard confirmatory technique that separates complex mixtures and provides definitive identification and quantitation of individual components [14] [16].
- Principle: The sample is vaporized and separated by Gas Chromatography (GC) based on the interaction of its components with a stationary phase and a gaseous mobile phase. The separated compounds are then ionized and analyzed by the Mass Spectrometer (MS), which identifies them based on their mass-to-charge ratio [16].
- Materials:
- GC-MS system
- Analytical column
- Inert carrier gas (e.g., helium)
- Certified reference standards for target analytes
- Appropriate solvents for sample preparation
- Procedure:
- Prepare a standard solution of the target analyte at a known concentration for calibration.
- Dissolve a weighed portion of the seized drug sample in a suitable solvent.
- Inject a small, precise volume of the sample solution into the GC inlet.
- The sample is vaporized and carried through the column by the carrier gas, separating the components based on their chemical properties.
- As each component elutes from the column, it enters the MS, is ionized, and produces a characteristic mass spectrum.
- Identify the compound by comparing its retention time and mass spectrum to the reference standard.
- Quantify the amount present by comparing the peak area or height of the analyte to the calibration curve generated from the standard.
- Applications: GC-MS is widely used for the confirmatory and quantitative analysis of drugs, alcohols in body fluids, and volatile compounds like fire accelerants [14] [16]. Liquid Chromatography-Mass Spectrometry (LC-MS) is another powerful tool for drug screening and is particularly useful for less volatile or thermally labile compounds [14].
The logical workflow from initial suspicion to confirmed, quantitative result integrates these techniques strategically, as shown in the following diagram.
Diagram 1: Drug Analysis Workflow from Screening to Quantitation.
The Scientist's Toolkit: Essential Research Reagents and Materials
Successful implementation of efficient forensic protocols relies on the use of specific, high-quality reagents and materials.
Table 2: Key Research Reagent Solutions for Forensic Chemistry
| Item | Function/Application |
|---|---|
| Certified Reference Standards | Pure, certified materials used for instrument calibration, method validation, and quantitative analysis of drugs and toxins [14]. |
| LC-MS Grade Solvents | High-purity solvents (e.g., methanol, acetonitrile) for mobile phase preparation and sample extraction, minimizing background interference in sensitive analyses [16]. |
| Derivatization Reagents | Chemicals that modify target analytes to improve their volatility, stability, or detectability in chromatographic systems like GC-MS [16]. |
| Solid Phase Extraction (SPE) Sorbents | Selective phases used to isolate, concentrate, and clean up analytes from complex biological or environmental matrices before analysis [14]. |
| Stable Isotope-Labeled Internal Standards | Standards used in quantitative MS to correct for sample loss and matrix effects, ensuring analytical accuracy and precision. |
| Buffers and Mobile Phase Additives | Chemicals (e.g., ammonium formate, trifluoroacetic acid) used to control pH and ionic strength, optimizing chromatographic separation and ionization efficiency. |
The strategic integration of rapid technologies and efficient workflows, as outlined in the NIJ's research plan, is critical for the future of forensic chemistry. The application of techniques like FTIR for rapid screening and GC-MS/LS-MS for definitive confirmation and quantitation directly addresses the need for increased laboratory efficiency and actionable results. By aligning research and daily practice with these national goals, forensic scientists, researchers, and drug development professionals can contribute to a more responsive, reliable, and impactful forensic science enterprise. Continued focus on foundational research, method validation, and workforce development will ensure these efficiency gains are sustainable and scientifically sound.
From Benchtop to Field: A Guide to Rapid Technologies in Action
The field of forensic chemistry is increasingly defined by its demand for rapid, definitive, and efficient analytical results. Growing caseloads, complex sample matrices, and the need for timely intelligence in investigations have driven the adoption of accelerated chromatography techniques. Among these, Rapid Gas Chromatography-Mass Spectrometry (GC-MS) and Comprehensive Two-Dimensional Gas Chromatography (GC×GC) stand out for their ability to dramatically increase throughput and analytical resolution. These technologies are transforming forensic workflows, moving labs from a backlogged, batch-processing model toward a dynamic, data-driven operation capable of providing critical insights with unprecedented speed.
This shift is underpinned by significant advancements in instrumentation. Modern benchtop gas chromatographs now prioritize ease of use, compact size, and integrated diagnostics, enabling more analysis to be performed in less time and space without sacrificing data quality [17]. Furthermore, the principles of green chemistry are being integrated into analytical methods, promoting the use of techniques like GC-MS that forgo the substantial volumes of hazardous organic solvents required by liquid chromatography, thereby reducing environmental impact and waste disposal costs [18]. This article provides detailed application notes and protocols for implementing these powerful techniques, framed within the context of enhancing efficiency in modern forensic science.
Current State of Benchtop GC Technology and Trends
The landscape of benchtop gas chromatography in 2025 is characterized by a focus on connectivity, automation, and operational simplicity. Major vendors are designing systems that integrate seamlessly into increasingly digitalized forensic laboratories.
Table 1: Key Features of Modern Mainline Benchtop Gas Chromatographs (2025)
| Vendor | Instrument Model | Key Features and Forensic Workflow Benefits |
|---|---|---|
| Agilent Technologies | 8890 GC System | Features autonomous diagnostics that check system health and provide alerts. Offers step-by-step maintenance instructions on a touch screen or remote browser interface [17]. |
| PerkinElmer | GC 2400 Platform | Includes a detachable touchscreen for remote instrument control and monitoring, enabling faster decision-making from anywhere in or out of the lab [17]. |
| Thermo Fisher Scientific | Trace 1600 Series | Designed for minimal user interaction via an advanced touchscreen with health monitoring and how-to videos. Allows for full instrument control through the chromatography data system (CDS) [17]. |
| Shimadzu | Nexis GC-2030 | Employs "Analytical Intelligence" for automated workflows and remote operation. The system features self-diagnostics to simplify maintenance [17]. |
A parallel trend is the rise of smaller-footprint benchtop GC systems. These instruments retain the core capabilities of their larger counterparts but are designed for dedicated routine applications, allowing forensic labs to maximize throughput per square foot of lab space. Examples include the Agilent 8850 GC and Intuvo 9000 GC, and the Shimadzu Brevis GC-2050, the latter of which is only 350 mm wide and designed for ease of use with minimal physical buttons [17].
Rapid GC-MS Methods for Forensic Analysis
Rapid GC-MS achieves significant reductions in analysis time through a combination of instrumental parameters: using shorter, narrower-bore capillary columns, higher carrier gas linear velocities, and faster temperature ramps. This section outlines a protocol for the rapid analysis of a common pharmaceutical combination, which is directly applicable to forensic drug analysis.
Application Note: Rapid GC-MS Analysis of Paracetamol and Metoclopramide
A green, fast, and sensitive GC-MS method has been developed for the simultaneous quantification of paracetamol (PAR) and metoclopramide (MET) in pharmaceutical formulations and human plasma, demonstrating the potential for high-throughput toxicological and counterfeit drug analysis [18].
Table 2: Performance Data for the Rapid GC-MS Assay
| Parameter | Paracetamol (PAR) | Metoclopramide (MET) |
|---|---|---|
| Analytical Range | 0.2 – 80 µg/mL | 0.3 – 90 µg/mL |
| Linearity (r²) | 0.9999 | 0.9988 |
| Precision (RSD %) | Tablet: 3.605% | Tablet: 3.392% |
| Plasma: 1.521% | Plasma: 2.153% | |
| Recovery (%) | Tablet: 102.87% | Tablet: 101.98% |
| Plasma: 92.79% | Plasma: 91.99% | |
| Detection Ion (m/z) | 109 | 86 |
| Total Runtime | < 5 minutes | < 5 minutes |
Experimental Protocol
The Scientist's Toolkit: Key Research Reagent Solutions
- Analytical Standards: High-purity Paracetamol (≥ 99.90%) and Metoclopramide HCl (≥ 99.98%) for calibration.
- Solvents: HPLC-grade ethanol for sample preparation and dilution.
- Internal Standard (Recommended for bioanalysis): A structurally similar compound or deuterated analog not found in the sample matrix.
- GC-MS System: Agilent 7890A GC coupled with a 5975C inert mass spectrometer with a Triple Axis Detector [18].
- Chromatographic Column: Agilent 19091S-433; 5% Phenyl Methyl Siloxane (30 m × 250 µm × 0.25 µm) [18].
- Consumables: Deionized water, helium carrier gas, sample vials, and vial caps.
Step-by-Step Procedure:
Instrument Setup:
- Configure the GC-MS system with the specified column.
- Set the carrier gas (Helium) to a constant flow rate of 2 mL/min [18].
- Configure the inlet temperature (e.g., 250°C) and use a split injection mode (e.g., 10:1 split ratio) with an injection volume of 1 µL.
- Set the GC oven program for rapid analysis: Initial temperature 80°C, ramp at 50°C/min to 280°C, and hold for 0.5 min. The total runtime will be under 5 minutes.
- Set the MS transfer line temperature to 280°C, ion source to 150°C, and quadrupole to 230°C. Operate the MS in Selected Ion Monitoring (SIM) mode for detection, monitoring m/z 109 for PAR and m/z 86 for MET [18].
Sample Preparation:
- For pharmaceutical tablets: Accurately weigh and crush tablets. Dissolve an equivalent of 500 mg PAR and 100 mg MET in ethanol, sonicate, and centrifuge. Dilute the supernatant as needed.
- For plasma: Perform a protein precipitation extraction. Add a known volume of ethanol (e.g., 300 µL) to a plasma aliquot (e.g., 100 µL), vortex mix, and centrifuge. Use the supernatant for analysis [18].
- Prepare calibration standards in ethanol or blank plasma across the specified concentration range (e.g., 0.2-80 µg/mL for PAR and 0.3-90 µg/mL for MET).
Data Acquisition and Analysis:
- Inject calibration standards and samples in sequence.
- Use the data system (e.g., Agilent MassHunter) to integrate the peak areas for the target ions.
- Construct a calibration curve by plotting the peak area (or area ratio to an internal standard) against the known concentration of each standard.
- Use the linear regression equation from the calibration curve to calculate the concentration of PAR and MET in the unknown samples.
Diagram 1: Rapid GC-MS Forensic Analysis Workflow
Comprehensive Two-Dimensional Gas Chromatography (GC×GC)
GC×GC provides a monumental leap in separation power for complex mixtures. It connects two chromatographic columns with distinct stationary phases through a modulator. The effluent from the first column is collected, focused, and reinjected in small pulses into the second column. This process produces a two-dimensional chromatogram where compounds are separated by two different chemical properties (e.g., volatility and polarity), resolving co-eluting peaks that would be inseparable by one-dimensional GC.
Data Analysis in GC×GC: Fisher Ratio for Non-Targeted Discovery
In forensic science, the power of GC×GC is often harnessed for non-targeted, discovery-based analysis, where the goal is to find minute, unknown differences between complex sample classes (e.g., comparing ignitable liquid residues from arson scenes). Fisher Ratio (F-ratio) analysis is a powerful supervised method for this task [19].
The F-ratio is defined as the ratio of class-to-class variance to the sum of within-class variances. It prioritizes compounds that show consistent and significant differences between sample groups over those with just a large signal [19]. The formula is expressed as:
Fisher Ratio = σcl² / σerr²
where σ_cl² is the variance between classes and σ_err² is the variance within classes [19].
Diagram 2: GC×GC F-Ratio Analysis for Feature Discovery
Three computational approaches exist for F-ratio analysis, with a 2020 study finding the pixel-based method to be the most sensitive for discovering spiked analytes in a complex gasoline matrix, followed by tile-based and peak table-based methods [19]. A null distribution analysis should be used to establish a statistical F-ratio cutoff and minimize false positives [19].
Quantitative Calibration Fundamentals
Accurate quantification is a cornerstone of forensic chemistry, whether for determining drug concentrations or quantifying impurities. The choice of calibration method is critical for achieving reliable results.
Table 3: Comparison of Common Quantitative Calibration Methods in GC
| Calibration Method | Principle | Advantages | Limitations | Best for Forensic Applications |
|---|---|---|---|---|
| Area Percent Normalization | Reports area % as concentration %. | Simple; no standards needed. | Assumes all components are detected and have equal response; highly inaccurate for quantitation [20]. | Screening for impurities relative to a main component. |
| External Standard | Calibration curve of peak area vs. standard concentration. | Mitigates variable detector response. | Does not correct for sample prep/injection variability; can be noisy [20]. | Simple "dilute-and-shoot" analyses with high reproducibility. |
| Internal Standard (IS) | Calibration curve of (analyte area/IS area) vs. concentration. | Corrects for sample prep and injection losses; improves precision [20]. | Finding a suitable IS that is not in the sample and behaves like the analyte can be challenging [20]. | Most bioanalyses and methods requiring extraction; essential for high-precision work. |
| Standard Addition | Analyte signal is measured after adding known amounts to the sample itself. | Corrects for complex matrix effects. | Time-consuming; requires more sample; best used with peak height [20]. | Analyzing samples with unique or un-mimickable matrices. |
For GC-MS analysis in complex matrices like blood or urine, the internal standard method is highly recommended. The best internal standard is a deuterated analog of the analyte, which has nearly identical chemical behavior but a different mass, allowing the MS to distinguish it [20].
Integration into Modern Forensic Workflows
The adoption of accelerated chromatography techniques aligns with a broader movement toward data-driven efficiency in forensic laboratories. Artificial Intelligence (AI) and machine learning are emerging as powerful tools for managing the complex data generated by these techniques and for optimizing lab operations [7].
Potential AI applications include:
- Resource Allocation and Case Prioritization: Using predictive models on past case data to estimate processing time and staffing needs, and to automatically prioritize cases or evidence types based on potential investigative value [7].
- Data Synthesis: AI can integrate results from multiple forensic disciplines (e.g., GC-MS, DNA, latent prints) to generate cohesive intelligence and suggest investigative leads [7].
A critical guardrail for any AI application in forensics is human verification. AI outputs, especially from generative systems, must be viewed as coming from "a witness with no reputation and amnesia," requiring rigorous validation and an audit trail of all inputs and outputs [7].
Rapid GC-MS and GC×GC represent the vanguard of analytical techniques that directly address the pressing needs of modern forensic chemistry for speed, resolution, and efficiency. The protocols and application notes detailed herein provide a framework for implementing these powerful technologies. When combined with robust quantitative calibration practices and emerging data science tools, they form a comprehensive strategy for transforming forensic workflows. This integration enables laboratories to not only clear backlogs but also to generate more definitive, data-rich results that can withstand legal scrutiny and provide stronger evidence for the justice system.
Direct Analysis in Real Time coupled with High-Resolution Mass Spectrometry (DART-HRMS) represents a transformative ambient ionization technique that enables rapid mass spectral analysis of samples in their native state without extensive preparation. This technology addresses critical needs in forensic chemistry workflows where case backlogs, difficult-to-analyze samples, and previously unseen materials demand new analytical tools [21] [22]. DART-HRMS operates at atmospheric pressure, allowing analysis of a wide range of analytes—including solids, liquids, and gases—directly on surfaces as varied as concrete, human skin, and currency [23].
The fundamental ionization mechanism of DART involves generating excited-state species in a heated gas stream (typically helium or nitrogen) that initiates a cascade of gas-phase reactions upon release [23] [22]. These processes create reagent ions that chemically ionize analytes present near the mass spectrometer inlet, with elevated temperature promoting sample desorption. The technique can generate both positive and negative ions depending on the analytical requirements [23]. This solvent-free approach eliminates time-consuming sample preparation, preserves sample integrity, and significantly reduces analysis time from hours to seconds while maintaining high sensitivity and specificity [22].
Technical Foundations & Ionization Mechanisms
DART Ionization Processes
The DART ion source creates a gas-phase ionization mechanism through a carefully controlled process. Inside the source, a corona discharge converts flowing inert gas into plasma containing ions, electrons, and excited-state species. Electrostatic lenses then remove ions and electrons, leaving only long-lived electronically or vibronically excited atoms or molecules [23]. When these excited species exit the source and interact with atmospheric gases and the sample, several ionization pathways can occur:
- Penning Ionization: Metastable atoms transfer their energy to analyte molecules having lower ionization energies, resulting in the formation of molecular ions [22].
- Proton Transfer: When excited-state species ionize atmospheric water molecules, they create protonated water clusters [H₃O⁺(H₂O)n] that can donate protons to analyte molecules with higher proton affinity than water [22].
- Electron Capture: For negative ion mode, the grid electrode at the DART exit provides low-energy electrons that can be captured by analytes with high electron affinity [23].
The resulting ions are then directed into the mass spectrometer for separation and detection. The high-resolution mass spectrometer provides accurate mass measurements, enabling determination of elemental composition and facilitating confident compound identification [24].
Instrumentation Components
A complete DART-HRMS system consists of several key components:
- DART Ion Source: Generates the excited-state species required for ionization, featuring a gas heater, grid electrode, and insulator cap [23].
- Mass Spectrometer: Typically a high-resolution time-of-flight (TOF) instrument that provides accurate mass measurements.
- Sample Introduction System: Various interfaces including automated linear rails, thermal desorber units, or manual positioning devices [23] [24].
- Gas Supply: High-purity helium or nitrogen gas sources that produce the excited-state species [22].
The incorporation of a thermal desorption (TD) unit extends application possibilities by providing controlled heating of samples prior to ionization, improving reproducibility for solid samples and surface wipes [24].
Application Protocols
The following section provides detailed methodologies for implementing DART-HRMS across various forensic applications, emphasizing the minimal sample preparation required.
Protocol 1: Analysis of Recreational Cannabis Products
Objective: To rapidly identify cannabinoids and terpenes in diverse commercial cannabis products without sample pretreatment [25].
Materials & Equipment:
- DART-HRMS system with Vapur interface
- High-purity helium gas (≥99.999%)
- OpenSpot sample cards or automated rail system
- Positive and negative mode mass calibration standards
- Commercially available cannabis products (edibles, concentrates, tinctures, topicals, vaporizers, flower)
Methodology:
- Instrument Setup:
- Set DART gas heater temperature to 350°C for solid samples or 250°C for liquids/topicals
- Configure helium gas flow to 2.0-3.0 L/min
- Set mass spectrometer to acquire data in the range of m/z 50-800
- Select positive ion mode for terpenes and neutral cannabinoids; negative ion mode for cannabinoid acids
Sample Analysis:
- For plant material: Position small floral clusters (~2-5 mg) directly in the DART gas stream using tweezers
- For edibles: Apply small aliquot (~1 µL) of extracted material or solid fragment to OpenSpot card
- For concentrates/topicals: Use glass dip tube to transfer trace amount to sampling card
- Analyze each sample for 30-60 seconds to ensure representative data acquisition
Data Interpretation:
- Identify protonated molecules [M+H]+ in positive ion mode for THC (m/z 315.2324), CBD (m/z 315.2324), CBN (m/z 311.2015)
- Identify deprotonated molecules [M-H]- in negative ion mode for CBDA (m/z 358.2147), THCA (m/z 358.2147)
- Detect terpenes including eucalyptol as [M+H]+ (m/z 155.1430) or [M-H]- (m/z 153.1277)
Key Advantages: This approach avoids difficulties typically encountered with traditional chromatographic methods for complex matrices, with analysis times under 2 minutes per sample compared to 20-30 minutes for LC-MS methods [25].
Protocol 2: Detection of Riot Control Agents on Fabrics
Objective: To screen clothing and surfaces for riot control agent (RCA) contamination using DART-TD-HRMS [24].
Materials & Equipment:
- DART ion source with thermal desorption unit
- Cotton fabric samples (pre-washed)
- Sample traps (glass fiber swabs, ST1318P)
- RCA reference standards (capsaicin, CS, CR, CN, PAVA)
- Acetonitrile (hyper grade for LC-MS)
Methodology:
- Sample Collection:
- Wipe suspect fabric areas (approximately 10 cm²) with glass fiber sample trap
- For liquid contamination, use dry swab; for particulate matter, slightly moisten with acetonitrile
- Alternatively, directly position small fabric sections (≤1 cm²) in thermal desorption unit
Instrument Parameters:
- Set TD unit temperature gradient: 50°C to 300°C at 100°C/min
- Configure DART gas temperature to 350°C (helium)
- Mass spectrometer acquisition: m/z 100-500 in positive ion mode
- Calibrate mass spectrometer using tune mix before analysis
Analysis Procedure:
- Place sample trap in TD autosampler or manually position fabric in holder
- Initiate thermal desorption and simultaneous data acquisition
- Analyze samples in batches of 10-20 with solvent blanks between specimens
- Acquisition time: 2 minutes per sample maximum
Compound Identification:
- Monitor for [M+H]+ of capsaicin (m/z 306.2063), CS (m/z 189.0088), CR (m/z 198.0913)
- Apply mass accuracy threshold of ≤5 ppm for confident identification
- Use extracted ion chromatograms for quantification when required
Validation Parameters: The method demonstrated detection of all 16 OPCW-listed potential RCAs with linear response from 0.5-100 ng/μL for most compounds [24].
Protocol 3: Entomotoxicological Screening of Blow Flies
Objective: To determine toxicological information from entomological evidence by screening blow flies for fentanyl-derivative accumulation [26].
Materials & Equipment:
- DART-HRMS system with high-resolution mass spectrometer
- Blow fly specimens (larvae, pupae, adults)
- Control and exposed insect colonies
- Solid-phase microextraction (SPME) fibers (optional)
- Multivariate statistical analysis software
Methodology:
- Sample Preparation:
- Collect insect specimens from remains or controlled feeding studies
- Rinse with distilled water to remove external contaminants
- Blot dry and homogenize individual specimens using glass homogenizer
- For direct analysis, position intact insects or body parts in DART stream
DART-HRMS Parameters:
- Set DART gas temperature to 400°C to facilitate desorption of insect matrices
- Use helium gas at 3.5 L/min flow rate
- Mass spectrometer resolution: ≥30,000 (FWHM)
- Data acquisition: m/z 70-1000 in both positive and negative modes
Metabolomic Analysis:
- Acquire mass spectral profiles of control and exposed insects
- Collect data from multiple life stages (larvae, pupae, adults)
- Perform 5-10 technical replicates per specimen to ensure reproducibility
Data Processing:
- Export raw mass spectral data to multivariate analysis software
- Apply principal component analysis (PCA) to differentiate metabolic profiles
- Use orthogonal projections to latent structures discriminant analysis (OPLS-DA) to identify significant m/z features
- Identify biomarkers of fentanyl exposure through database searching
Key Findings: Chemometric analysis facilitated differentiation of blow flies that fed on fentanyl-derivative-laced liver from controls across various life stages, enabling toxicological inference from insects [26].
Quantitative Performance Data
The following tables summarize key quantitative performance metrics for DART-HRMS across various forensic applications.
Table 1: Detection Capabilities for Different Compound Classes
| Compound Class | Example Analytes | Limit of Detection | Linear Range | Analysis Time | Reference |
|---|---|---|---|---|---|
| Cannabinoids | THC, CBD, CBN | 0.1-1 ng | 1-500 ng | <30 seconds | [25] |
| Riot Control Agents | Capsaicin, CS, CR | 0.1-0.5 ng | 0.5-100 ng/μL | <2 minutes | [24] |
| Pharmaceuticals | Fentanyl derivatives | Low ppb level | Not specified | <1 minute | [26] |
| Entomological Evidence | Insect metabolites | Not specified | Not specified | <2 minutes | [26] |
| Explosives & GSR | Inorganic residues | Not specified | Not specified | <30 seconds | [21] |
Table 2: Comparison of Analysis Time Between Traditional Methods and DART-HRMS
| Application | Traditional Method | Traditional Analysis Time | DART-HRMS Time | Time Reduction |
|---|---|---|---|---|
| Cannabis Analysis | GC-MS/MS | 20-30 minutes | 1-2 minutes | 85-95% |
| RCA Detection | LC-MS/MS | 15-25 minutes | 1.5-2 minutes | 90-95% |
| Entomotoxicology | HPLC with sample prep | 45-60 minutes | 2-3 minutes | 95-97% |
| Drug Screening | UPLC-QTOF | 10-15 minutes | 0.5-1 minute | 85-95% |
| Ink Differentiation | TLC & MS | 30-45 minutes | 1 minute | 95-98% |
Experimental Workflow Visualization
DART-HRMS Experimental Workflow: This diagram illustrates the streamlined workflow for non-extracted sample screening using DART-HRMS technology, highlighting key advantages including minimal sample preparation and atmospheric pressure operation.
Research Reagent Solutions
Table 3: Essential Materials for DART-HRMS Implementation
| Item | Specification | Function | Application Examples |
|---|---|---|---|
| Helium Gas | High purity (≥99.999%) | Production of excited-state metastable species | All DART-HRMS applications [23] [22] |
| Nitrogen Gas | High purity (≥99.999%) | Alternative to helium for some applications | Cost-effective analysis of low IP compounds [22] |
| OpenSpot Sample Cards | Polyester mesh or glass fiber | Sample presentation substrate | Cannabis products, powders, residues [25] |
| Sample Traps (ST1318P) | Glass fiber swabs | Surface sampling and thermal desorption | RCA detection on fabrics, surface screening [24] |
| Thermal Desorber Unit | Programmable temperature (50-400°C) | Controlled sample heating prior to ionization | Solid samples, swabs, low volatility compounds [23] [24] |
| Calibration Standards | Tune mix for positive/negative mode | Mass axis calibration | Daily instrument performance verification [25] [24] |
| SPME Fibers | Various coatings (PDMS, CAR/PDMS) | Headspace sampling for volatile compounds | Fire debris, ignitable liquids, volatile organics |
| Automated Rail System | Motorized sample positioning | High-throughput sequential analysis | 384-well plate screening, batch processing [23] |
DART-HRMS technology represents a paradigm shift in forensic chemical analysis, offering unprecedented capabilities for rapid screening of non-extracted samples across diverse matrices. The technique's minimal sample requirements, absence of extensive preparation, and rapid analysis times (typically 10 seconds to 2 minutes per sample) directly address workflow efficiency challenges in forensic laboratories [23] [22].
The applications demonstrated—from cannabis product screening and riot control agent detection to entomotoxicological assessments—highlight the versatility of this ambient ionization approach [25] [24] [26]. As forensic chemistry continues to confront emerging analytical challenges, including novel psychoactive substances and complex sample matrices, DART-HRMS stands positioned as a key enabling technology for rapid triage and comprehensive analysis. Future developments will likely focus on expanding compound libraries, validating quantitative performance, and further integrating automated sampling approaches to maximize throughput and reliability in forensic workflows.
Application Notes
The integration of portable Gas Chromatography-Mass Spectrometry (GC-MS) and Rapid DNA technologies into forensic workflows represents a significant advancement, dramatically increasing efficiency by delivering actionable intelligence from the sample site in hours instead of weeks or months. Deploying these platforms directly to the crime scene, border checkpoint, or battlefield enables investigators to make mission-critical decisions based on confirmed data, fundamentally changing the investigative tempo. The following application notes and quantitative data summarize the performance and utility of these platforms for various evidence types.
Application Note 1: Rapid DNA for Biological Evidence
Objective: To evaluate the performance of Rapid DNA systems in processing non-reference biological traces, such as blood and saliva, secured from crime scenes and compare the results to conventional laboratory DNA analysis.
Background: Rapid DNA technology has matured from processing buccal (cheek) swabs to handling a wider array of sample types encountered in casework. A primary driver for its implementation is the significant reduction in the turnaround time for DNA results, which can directly impact the speed and direction of criminal investigations [27].
Key Findings:
- Investigation Duration: A field experiment demonstrated that a decentralized Rapid DNA procedure significantly reduced the total duration of the investigative process compared to the regular laboratory procedure [27].
- Profile Success Rate: The success of generating a usable DNA profile is highly dependent on the sample type and its condition. Rapid DNA techniques are less sensitive than conventional laboratory equipment and are most suitable for traces with an expected high DNA quantity from a single donor [27].
- Sample Type Performance: One study found that the success rate for blood and saliva-based samples varied between the ANDE 6C and RapidHIT ID systems and was dependent on the specific sample type (e.g., blood on fabric, saliva on drink containers) [28]. Adherence to manufacturer instructions for sample collection was found to be critical, particularly for the ANDE system [28].
- Sensitivity: The sensitivity range for leading Rapid DNA systems is comparable, with both capable of generating full profiles from samples that typically yield 5–10 ng of DNA in a conventional workflow [28].
Table 1: Performance Summary of Rapid DNA Analysis for Crime Scene Traces
| Metric | Rapid DNA (RapidHIT) | Conventional Laboratory |
|---|---|---|
| Typical Turnaround Time | ~1.5 to 2 hours [29] [27] | Weeks to months [27] |
| Optimal Sample Types | Visible blood traces; single-donor, high-quantity saliva [27] | Wide range, including low-quantity and complex mixture samples [27] |
| Sensitivity | Lower; suitable for samples yielding ≥5-10 ng DNA [28] | Higher; capable of profiling low-template DNA [27] |
| Key Impact | Significant reduction in investigative process duration [27] | Gold standard for sensitivity and mixture deconvolution [27] |
Application Note 2: Portable GC-MS for Explosives and Chemical Evidence
Objective: To demonstrate the application of portable GC-MS for the confirmatory identification of explosive residues in field settings to support immediate threat assessment and intelligence gathering.
Background: Portable GC-MS instruments have been deployed for organic analysis in harsh environments for over two decades [30]. Their ability to provide separation and definitive mass spectral identification makes them indispensable for analyzing complex mixtures encountered in forensic and military scenarios.
Key Findings:
- Confirmatory Analysis: Portable GC-MS is capable of the confirmatory identification of pre- and post-detonation explosive threats, providing information on the source based on trace-level chemicals [31].
- Operational Benefits: On-scene analysis enables the development of render-safe procedures, drastically improves intelligence turnaround time, and guides optimal scene processing. It also ensures analysis reflects the scene's condition at the time of sampling, which is critical for volatile compounds [31].
- Technology Comparison: Both portable ion-trap and quadrupole GC-MS systems are available. While quadrupole systems generate spectra that are more easily comparable to standard libraries (e.g., NIST), ion-trap systems can operate with more field-friendly hardware, though their spectra may be affected by ion-chemistry events [31].
Table 2: Performance Summary of Portable GC-MS for Explosives Analysis
| Metric | Portable GC-MS | Traditional Laboratory GC-MS |
|---|---|---|
| Analysis Time | ~90 seconds to 5 minutes per sample [31] | Hours to days (including transport) |
| Primary Advantage | Real-time, confirmatory data at the sample site [31] | Ultimate resolution and sensitivity in a controlled environment |
| Key Applications | Explosives identification [31], chemical warfare agents [30], ignitable liquids [32] | Broadest range of forensic chemical analysis |
| Data Quality | Confirmatory identification possible [31] | Gold standard for definitive analysis |
Experimental Protocols
Protocol 1: Rapid DNA Analysis of Crime Scene Blood Traces Using a RapidHIT System
Principle: This protocol describes the procedure for generating a DNA ID from a visible blood stain at a crime scene or in a mobile laboratory using a RapidHIT instrument, enabling a database search in under two hours [27].
Materials:
- RapidHIT ID System (or similar Rapid DNA platform)
- Approved sample collection cartridge or swab (e.g., RapidINTEL cartridge, splitable 4N6 FLOQSwabs)
- Disposable gloves
- Personal protective equipment (PPE)
Procedure:
Sample Collection:
- Don PPE and gloves to avoid contamination.
- Using an approved swab, collect the blood stain from the surface. If using a splitable swab for validation, use a rotary motion to achieve a homogeneous distribution of the trace on the swab head [27].
- If required, air-dry the swab for a few minutes to allow solvent evaporation.
Instrument Preparation:
- Ensure the RapidHIT system has passed its daily performance check, which verifies GC, MS, and library search functionality.
- Load the sample cartridge into the instrument according to the manufacturer's instructions.
Sample Loading and Run Initiation:
- Place the collected swab into the designated lane of the sample cartridge.
- Close the instrument and initiate the automated run sequence. The process, including extraction, amplification, separation, and analysis, is fully automated and requires approximately 1.5 to 2 hours [27].
Data Analysis and Reporting:
- The instrument software will automatically process the raw data, interpret the DNA profile, and generate a report.
- For accredited procedures, the resulting DNA profile can be directly uploaded to the CODIS database for a search if the system is approved for such use [29].
Quality Control:
Protocol 2: Analysis of Explosive Residues Using Portable GC-MS
Principle: This protocol details the use of portable GC-MS with solid-phase microextraction (SPME) for the sampling and confirmatory identification of organic explosives residues in the field [31].
Materials:
- Portable GC-MS system (e.g., Smiths Detection Guardion)
- SPME fiber assembly (e.g., 65-μm PDMS/DVB)
- Helium carrier gas cartridge
- Headspace GC-MS vials
- Microsyringe
- Performance validation mixture
Procedure:
System Performance Check:
- At the start of operations, perform a system performance test using a standard validation mixture.
- Verify that GC retention times for all chemicals are within ±2 seconds of the expected values and that MS performance (mass calibration, resolution, sensitivity) and library search functions meet acceptance criteria [31].
Sample Collection (SPME Headspace Sampling):
- Transfer between 100–500 mg of solid explosive evidence to a headspace vial and seal it.
- Allow the vial to equilibrate at room temperature (e.g., 22 °C) for a minimum of 2 hours.
- Pierce the vial cap with the SPME holder and expose the fiber to the vial's headspace for a specified time, typically between 10–40 minutes [31].
Sample Collection (Direct Deposition for Liquid Standards):
- For standard solutions, deposit 20–200 ng of the explosive standard (e.g., RDX, TNT, PETN) directly onto the coated SPME fiber using a microsyringe.
- Allow the solvent to air-dry for up to 5 minutes [31].
GC-MS Analysis:
- Introduce the SPME fiber into the GC-MS injection port for thermal desorption.
- Initiate the GC-MS method. A typical field method is fast, with a total analysis time of approximately 3 minutes and a cycle time of about 5 minutes between injections [31].
- The GC method uses a resistively heated capillary column for rapid temperature programming.
Data Interpretation:
- The system software will automatically process the data and compare the acquired mass spectrum against its proprietary library and a condensed NIST library.
- Review the library search results for the confirmatory identification of explosive compounds. Be aware that ion-trap mass spectra may differ from quadrupole library entries due to ion chemistry [31].
Workflow and Signaling Pathways
The following diagram illustrates the logical workflow and decision-making process for deploying portable forensic platforms at a crime scene, highlighting how these tools are integrated to increase overall investigative efficiency.
On-Site Forensic Analysis Workflow
The Scientist's Toolkit: Essential Research Reagent Solutions
Table 3: Key Materials for Portable Forensic Analysis
| Item | Function |
|---|---|
| Splitable 4N6 FLOQSwabs | Allows a single biological trace to be sampled once and split, enabling parallel analysis by Rapid DNA and conventional laboratory methods for validation [27]. |
| RapidINTEL / I-Chip Cartridge | Sample cartridge specific to the Rapid DNA instrument brand (RapidHIT or ANDE); holds the sample and reagents for the fully automated process [28]. |
| SPME Fiber (PDMS/DVB) | A solid-phase microextraction fiber used for sampling volatile and semi-volatile organic compounds from headspace or via direct contact; serves as the introduction method for portable GC-MS [31]. |
| Helium Cartridge | Provides the carrier gas for the portable GC system; field-friendly disposable cartridges enable untethered operation [31]. |
| Performance Validation Mixture | A standard solution containing known compounds; used to verify the proper function of the GC, MS, and library search before operational use [31]. |
| Explosive Standards | Certified reference materials (e.g., RDX, TNT, PETN) used for method development, calibration, and quality control of the GC-MS analysis [31]. |
The integration of Artificial Intelligence (AI) and automation technologies is fundamentally transforming forensic chemistry and drug development research. These tools are revolutionizing how scientists manage complex data interpretation and workflow processes, enabling unprecedented levels of efficiency, accuracy, and scalability. In environments characterized by vast datasets and stringent reproducibility requirements, AI-powered automation moves beyond simple task execution to create intelligent, self-optimizing systems that enhance human expertise and accelerate discovery [33].
This document provides detailed application notes and experimental protocols for implementing these technologies within modern research laboratories. The guidance is structured to help researchers and scientists navigate the selection, deployment, and validation of automation tools, with a specific focus on applications in forensic chemistry workflows such as sample analysis, compound identification, and toxicological reporting [34].
Foundational Concepts and Definitions
Core Terminology
- Workflow Automation: The technology-enabled automation of activities or tasks that constitute a business process. It uses defined business rules to route items through workflow steps, streamlining repetitive, manual processes to increase efficiency, reduce errors, and free up human resources for higher-value work [35].
- AI Automation: The use of computer systems powered by machine learning and other AI subfields to perform tasks that typically require human intelligence. In scientific contexts, this includes data analysis, pattern recognition, and predictive modeling [36] [37].
- Automation in Digital Forensics: The use of technology to partially or fully automate tasks in a digital forensic process, crucial for managing increasing volumes of digital evidence. This ranges from basic automation (e.g., keyword searches) to full automation (autonomous operation) [34].
Levels of Workflow Automation
Modern workflow automation operates at varying levels of sophistication, from simple task automation to fully autonomous systems. Understanding these levels is crucial for selecting the right tools for a specific laboratory need [35].
Table: Levels of Workflow Automation Maturity
| Level | Name | Key Characteristics | Example in a Research Context |
|---|---|---|---|
| 1 | Manual Workflows with Triggered Automation | Task-based automation; human-initiated actions; no orchestration across steps [35]. | A laboratory information management system (LIMS) sends an email notification upon sample registration, but a human handles all subsequent steps [35]. |
| 2 | Rule-Based Automation | Processes automated based on predefined rules and conditions (IF/THEN logic); requires human oversight for exceptions [35]. | A chromatographic data system automatically flags results that fall outside a pre-defined calibration range for analyst review [35]. |
| 3 | Orchestrated Multi-Step Automation | Multiple tasks and systems connected sequentially for end-to-end workflow automation; fewer human handoffs; workflow visualization tools [35]. | A new sample submission triggers login, preparation vial assignment, instrument sequence creation, and preliminary data processing in multiple integrated systems [35]. |
| 4 | Adaptive Automation with Intelligence | Leverages AI/ML to adapt workflows based on data patterns and past outcomes; predictive decision-making; dynamic, self-adjusting workflows [35]. | An AI system routes spectral data for interpretation to the most effective analyst based on historical resolution times and expertise with specific compound classes [35]. |
| 5 | Autonomous Workflows | Fully automated, self-optimizing systems operating with minimal human intervention; closed-loop automation; continuous improvement via feedback loops [35]. | An integrated system detects an anomaly in a high-throughput screening run, automatically re-runs quality control checks, executes calibration scripts, and updates the electronic lab notebook [35]. |
Experimental Protocols for AI Integration
Protocol: Automated Data Review for Chromatographic Results
1. Purpose To establish a standardized method for using an AI tool to perform preliminary, automated review of chromatographic data (e.g., GC-MS, LC-MS) to identify outliers, confirm peaks against internal standards, and flag results requiring human expert review.
2. Scope Applicable to the initial data screening phase in quantitative analysis within forensic chemistry and pharmacokinetic studies.
3. Principles AI should enhance, not replace, expert judgment. All AI-generated outputs must be interpreted with professional skepticism and contextual analysis. The final responsibility for results lies with the qualified scientist [36].
4. Materials and Equipment
- Raw chromatographic data files (.raw, .d, etc.)
- AI-powered data review software (e.g., configured using a programming interface like Google AI Studio or a commercial scientific data AI platform) [37]
- Validated data processing method
- Computer system with adequate processing power
5. Procedure Step 1: Environment and Model Configuration.
- Access the AI environment (e.g., Google AI Studio) and select an appropriate model (e.g., Gemini for code/data structuring) [37].
- Configure the programming interface (API) settings, ensuring a sufficient context window for the data size.
Step 2: Data Preparation and Input.
- Export sample data, metadata, and acceptance criteria (e.g., retention time windows, signal-to-noise ratios, relative response factors) into a structured format (e.g., CSV, JSON) [37].
- Submit a clear, text-based prompt to the AI that includes the data and specific evaluation rules. Example prompt structure: "Act as a analytical chemist. Review the attached dataset of LC-MS results. For each sample, check if the internal standard peak area is within ±30% of the calibration standard average. Confirm that the reported concentration for the analyte is within the calibrated range. Flag any sample where the retention time deviates by more than ±0.2 minutes from the standard. Provide a summary output in JSON format listing 'Sample_ID', 'Passed_Checks' (True/False), and 'Flags' (list of any failed criteria)."
Step 3: AI Analysis and Output Generation.
- Execute the script or process to run the analysis.
- The AI will return a structured output (e.g., JSON) with its preliminary assessment [37].
Step 4: Human Oversight and Verification.
- A qualified scientist must review the AI-generated output.
- Cross-check a minimum of 20% of the results, including all flagged items, against the raw data to validate the AI's accuracy.
- The scientist makes the final determination on all results, documenting any discrepancies with the AI's assessment [36].
6. Documentation
- The AI model and version used must be documented in the laboratory notebook or report [36].
- The exact prompt and input parameters must be saved for reproducibility.
- The output from the AI and the scientist's verification notes must be retained as part of the permanent record.
Protocol: Intelligent Workflow Orchestration for Sample Management
1. Purpose To automate the multi-step workflow for managing incoming physical samples, from login to result reporting, by integrating multiple laboratory systems (LIMS, Electronic Lab Notebook (ELN), instruments).
2. Scope Applicable to the sample management lifecycle in a high-volume forensic or drug development laboratory.
3. Principles Seamless integration is key. The automation tool must offer extensive integration capabilities, typically via APIs, to connect with legacy systems, modern SaaS platforms, and custom applications [38] [33].
4. Procedure The following workflow diagram illustrates the automated sequence of events from sample receipt to final reporting.
The Scientist's Toolkit: Essential Research Reagents & Solutions
This section details key computational and material components essential for implementing AI and automation in a research setting.
Table: Essential Research Reagents and Solutions for AI Automation
| Item | Function/Explanation | Example in Use |
|---|---|---|
| Programming Interface (API) Access | Provides programmatic access to powerful AI models (e.g., Google Gemini, OpenAI GPT) for embedding AI into custom data pipelines and applications [37]. | Used to build a script that automatically sends raw spectral data to an AI model for preliminary interpretation and summary before scientist review [37]. |
| Workflow Automation Platform | Software that allows for the design, execution, and monitoring of automated multi-step processes, often with low-code visual interfaces and pre-built connectors [38] [35]. | Platforms like Xurrent are used to create an automated workflow that triggers instrument calibration, data backup, and report generation upon project completion in the ELN. |
| Retrieval-Augmented Generation (RAG) System | A method for grounding AI responses in specific, private data sources. It pulls relevant information from a knowledge base (e.g., internal SOPs, past reports) to inform the AI's output [33]. | Implemented to ensure an AI assistant's answers about laboratory protocols are based solely on the organization's validated SOPs, not general internet knowledge. |
| Data Visualization & Dashboard Tools | Tools that automatically generate charts, graphs, and interactive dashboards from processed data, providing intuitive insights into experimental results and workflow performance [38]. | A live dashboard displays key metrics from automated workflows, such as sample throughput, error rates per instrument, and average turnaround time, enabling proactive management. |
| Validated Reference Datasets | Curated, high-quality datasets used to test, validate, and fine-tune AI models for specific scientific tasks to ensure reliability and accuracy before application to real data [36]. | A set of known GC-MS spectra of controlled substances is used to validate an AI model's identification capabilities before it is deployed in a forensic laboratory. |
Data Presentation and Analysis
Quantitative Assessment of AI-Assisted Grading
A 2025 case study in an educational context provides a relevant model for quantifying AI performance in automated assessment, illustrating principles applicable to scientific data review. The study integrated the Gemini 2.5 AI model to evaluate student programming assignments, with results compared against teacher-assigned grades [37].
Table: Performance Metrics of AI in Automated Code Evaluation
| Metric | Finding | Implication for Scientific Use |
|---|---|---|
| Correlation with Human Expert | Moderate to high correlation was observed [37]. | AI shows promise for reproducible preliminary data checks in scientific workflows, such as automated spectral analysis. |
| Grading Strictness | The AI model tended to be stricter in its evaluation than human teachers [37]. | Scientists must be aware of potential bias towards false positives (over-flagging) and calibrate alert thresholds accordingly. |
| Grading Speed & Consistency | AI tools demonstrated the ability to improve grading speed and consistency [37]. | Automation can drastically reduce the time for initial data screening and ensure all datasets are evaluated against the same objective criteria. |
| Key Limitation | The AI showed limitations in interpreting creative or non-standard solutions [37]. | AI is a supplement to, not a replacement for, expert judgment. Unusual but valid scientific findings may be missed or misinterpreted by an AI. |
Ethical Framework and Governance
The implementation of AI must be guided by a robust ethical framework to ensure responsible and reliable use in sensitive fields like forensic chemistry [36] [33].
1. Human Oversight and Clinical Judgment: All AI outputs must be reviewed, interpreted, and contextualized by a qualified scientist. Automated decision-making that bypasses expert reasoning is ethically unacceptable [36]. 2. Transparency and Disclosure: The use of AI tools, including the type of technology and its role in the analysis, should be disclosed in the methodology section of reports. Final opinions must be attributed to the scientist [36]. 3. Algorithmic Bias Awareness: Evaluators must actively identify and mitigate algorithmic bias. AI systems can produce unfair or inaccurate outcomes if trained on flawed or non-representative data [36]. 4. Data Privacy and Security: Personal and sensitive data used in AI applications must comply with all relevant regulations (e.g., HIPAA, GDPR). Personally Identifiable Information (PII) must be safeguarded using best cybersecurity practices [36]. 5. Proficiency and Competency: Scientists integrating AI technologies into their practice must obtain appropriate training and understand the tools' limitations, ethical implications, and methodological considerations [36].
Maximizing Performance: Strategies for Optimizing Rapid Workflows
In the field of forensic chemistry, the demand for rapid and reliable analytical results is paramount for accelerating judicial processes and law enforcement responses. The efficiency of gas chromatography-mass spectrometry (GC-MS) workflows, a cornerstone technique for drug screening, is heavily dependent on the precise optimization of two critical parameters: temperature programming and carrier gas flow rate. Recent research demonstrates that systematic optimization of these parameters can reduce typical analysis times from 30 minutes to just 10 minutes while simultaneously improving detection limits by at least 50% for key substances like cocaine and heroin [39] [40]. This application note details validated protocols for parameter optimization that significantly enhance throughput in forensic drug analysis while maintaining the rigorous accuracy required for evidentiary standards.
Experimental Protocols
Materials and Reagents
Research Reagent Solutions
| Reagent/Material | Function and Specification |
|---|---|
| Agilent J&W DB-5 ms Column | Separation; 30 m × 0.25 mm × 0.25 μm [39] [40] |
| Helium Carrier Gas | Mobile phase; 99.999% purity [39] [40] |
| Methanol (99.9%) | Sample solvent for liquid-liquid extraction [39] [40] |
| Drug Standards (e.g., Cocaine, Heroin) | Target analytes for method development and validation [39] [40] |
| β-Glucuronidase (from bovine liver) | Enzymatic hydrolysis of conjugated metabolites in biological samples [41] |
| Ethyl Acetate | Solvent for liquid-liquid extraction of analytes from urine [41] |
Instrumentation and Configuration
The optimized method was developed using an Agilent 7890B gas chromatograph coupled with an Agilent 5977A single quadrupole mass spectrometer, equipped with a 7693 autosampler [39] [40]. Data acquisition was performed using Agilent MassHunter software (version 10.2.489) and Agilent Enhanced ChemStation software (Version F.01.03.2357) [39]. Library searches were conducted using the Wiley Spectral Library (2021 edition) and Cayman Spectral Library (September 2024 edition) for compound identification [39].
Optimized Temperature Programming Protocol
The following protocol outlines the steps for developing an efficient temperature program, moving from a generic scouting gradient to a finely optimized method.
Step 1: Initial Scouting Gradient Begin with a generic, wide-ranging temperature program to determine the sample's volatility range and complexity. The recommended initial parameters are [42]:
- Initial Temperature: 40 °C
- Initial Hold Time: 0.5 to 2 minutes (adjust based on injection technique; split injection may require little to no hold)
- Ramp Rate: 10 °C per minute
- Final Temperature: Set to the column's maximum temperature-programmed limit
- Final Hold Time: 10 minutes
This scouting run helps determine if the analysis requires a temperature program or can be performed isothermally. If all peaks of interest elute within a short segment (less than 25%) of the total gradient time, an isothermal method should be explored [42].
Step 2: Determine Isothermal Suitability (Optional) If the scouting gradient suggests isothermal operation may be feasible, calculate the appropriate temperature using Giddings's approximation [42]: [ T' \approx 0.92 Tf ] Where ( T' ) is the isothermal temperature and ( Tf ) is the elution temperature of the last analyte of interest from the scouting run.
Step 3: Optimize the Temperature Program If temperature programming is required, refine the parameters as follows [39] [40] [42]:
- Initial Temperature and Hold: Lower the initial temperature to improve the resolution of early-eluting peaks. A temperature of 40 °C is often practical. For splitless injections, an initial hold time (e.g., 30 seconds) is necessary for solvent focusing.
- Ramp Rate: The optimal ramp rate is approximately 10 °C per void time (( t0 )) of the column. For example, if ( t0 = 30 ) seconds, a ramp rate of 20 °C/min is a good starting point [42]. For rapid analysis, significantly higher ramp rates can be used, such as the 70 °C/min successfully applied in a validated rapid GC-MS method [39] [40].
- Final Temperature and Hold: Set the final temperature 10-30 °C above the elution temperature of the last analyte. Include a hold time at this temperature to ensure all compounds are eluted. A post-run thermal bake-out at the column's maximum temperature can be added to remove residual compounds.
Step 4: Resolve Critical Peak Pairs For critical pairs that remain unresolved, determine their approximate elution temperature from the optimized program. Use Giddings's approximation to calculate an isothermal temperature and introduce an isocratic hold at this temperature within the program. Begin with a 1-minute hold and adjust as needed [42].
Flow Rate Adjustment and Holdup Time Measurement Protocol
Precise control of the carrier gas flow rate is fundamental for achieving reproducible retention times and optimal separation efficiency.
Step 1: Measure the Gas Holdup Time (( t_M )) The holdup time is the time required for an unretained substance to travel through the column. It is essential for calculating flow rates and optimizing parameters.
- Recommended Method: Inject 1-5 µL of vapor from a butane lighter using a gas-tight syringe. Butane is typically unretained on standard capillary columns. The resulting peak's retention time is ( t_M ) [43].
- Verification: On thick-film columns where butane may be retained, use methane instead. The peak shape should be symmetrical; tailing suggests active sites or connection issues [43].
- Alternative Calculation: Modern data systems can calculate ( t_M ) based on column dimensions, carrier gas, pressures, and temperature. This can be verified by the butane method [43].
Step 2: Calculate Flow and Velocity Use the measured ( t_M ) to calculate key flow parameters [43]:
- Average Linear Velocity (( \bar{u} )): ( \bar{u} = \frac{L}{t_M} ), where ( L ) is the column length in cm.
- Average Volumetric Flow Rate (( F )): ( F = \frac{\pi r^2 L}{t_M} ), where ( r ) is the column radius.
Step 3: Optimize Flow Rate via Van Deemter Plot Construct a van Deemter plot to find the optimal linear velocity for maximum efficiency [43]:
- Vary the inlet pressure (and thus the flow rate) across a series of runs.
- For each run, inject an unretained marker to measure ( t_M ) and a retained, well-behaved analyte to measure the height equivalent to a theoretical plate (HETP).
- Plot HETP against the average linear velocity. The optimal flow rate corresponds to the minimum of the curve.
Step 4: Set Operational Flow Parameters Based on the optimization study, set the flow parameters for the method. The rapid GC-MS method used a fixed helium flow rate of 2 mL/min, which contributed to the reduced analysis time while maintaining performance [39] [40].
Sample Preparation Workflow
For the analysis of seized drugs, a liquid-liquid extraction procedure is employed [39]:
- Solid Samples: Grind tablets or powders with a mortar and pestle. Weigh approximately 0.1 g into a test tube and add 1 mL of methanol. Sonicate for 5 minutes, then centrifuge. Transfer the supernatant to a GC-MS vial.
- Trace Samples: Swab surfaces of interest (e.g., digital scales, syringes) with a methanol-moistened swab. Immerse the swab tip in 1 mL of methanol and vortex vigorously. Transfer the extract to a GC-MS vial.
Results and Data Presentation
Comparative Method Parameters and Performance
Systematic optimization of temperature and flow parameters yields substantial gains in speed and sensitivity. The table below contrasts the key parameters and outcomes of a conventional method versus the optimized rapid protocol.
Table 1: Optimized vs. Conventional GC-MS Method Parameters and Performance [39] [40]
| Parameter | Optimized Rapid Method | Conventional Method |
|---|---|---|
| Initial Temperature | 120 °C | 70 °C |
| Temperature Ramp | 70 °C/min to 300 °C | 15 °C/min to 300 °C |
| Run Time | 10.00 min | 30.33 min |
| Carrier Gas Flow (He) | 2 mL/min (fixed) | 1 mL/min |
| Cocaine LOD | 1 μg/mL | 2.5 μg/mL |
| Heroin LOD | Improved by >50% | Baseline |
| Method Repeatability (RSD) | < 0.25% (retention time) | Not Specified |
Workflow Logic and Optimization Pathway
The following diagram illustrates the logical sequence for optimizing GC-MS parameters, integrating both temperature programming and flow rate adjustments to achieve a rapid and robust forensic method.
Discussion
Impact on Forensic Workflow Efficiency
The implementation of the optimized parameters detailed in this protocol directly addresses the critical need for speed in forensic laboratories. The 67% reduction in analysis time (from 30 to 10 minutes) enables a significantly higher sample throughput, which is a decisive factor in reducing case backlogs [39] [40]. Furthermore, the concurrent improvement in detection limits enhances the method's reliability for trace sample analysis, a common scenario in forensic casework involving swabs from surfaces like scales and utensils [39]. When applied to 20 real case samples from Dubai Police Forensic Labs, the rapid GC-MS method achieved match quality scores consistently exceeding 90%, proving its practical utility in authentic forensic contexts [39] [40].
Integration with Broader Rapid Technologies
The optimization of core GC-MS parameters is a foundational element within a broader ecosystem of rapid forensic technologies. These include [44]:
- Ambient Ionization Mass Spectrometry: Techniques like Extractive-Liquid Electron Ionization-MS (E-LEI-MS) allow for direct sample analysis with minimal preparation, providing results in less than five minutes for screening purposes.
- Advanced Data Processing: The use of sophisticated software and algorithms for automated peak detection and deconvolution further compresses the data analysis timeline, which is often a bottleneck [45].
The synergy between hardware parameter optimization and these complementary technologies creates a powerful framework for accelerating the entire forensic chemistry workflow, from sample receipt to final report.
This application note provides a detailed experimental protocol for the optimization of temperature programming and carrier gas flow rates in GC-MS analysis. The data conclusively show that a meticulously optimized method, utilizing a high-speed temperature ramp of 70 °C/min and a fixed carrier gas flow of 2 mL/min, can dramatically increase analytical throughput while simultaneously enhancing sensitivity. This approach is perfectly aligned with the overarching thesis that targeted technological optimizations are instrumental in creating faster, more efficient, and reliable workflows in forensic chemistry, ultimately supporting faster judicial processes and strengthening public safety.
Ion suppression represents a significant challenge in mass spectrometry, negatively impacting key analytical figures of merit including detection capability, precision, and accuracy. This phenomenon occurs when matrix components co-eluting with analytes of interest interfere with the ionization process in the liquid chromatography-mass spectrometry (LC-MS) interface. Regardless of the sensitivity or selectivity of the mass analyzer used, ion suppression can lead to reduced analyte response, potentially resulting in false negatives or inaccurate quantification [46] [47]. The consequences are particularly detrimental in forensic chemistry, where reliable results are essential for legal proceedings, and in pharmaceutical development, where precision directly impacts drug safety and efficacy evaluations.
The mechanisms of ion suppression vary depending on the ionization technique employed. In electrospray ionization (ESI), competition for limited charge or space on droplet surfaces occurs, particularly problematic with biological matrices containing endogenous compounds with high basicities and surface activities. In atmospheric-pressure chemical ionization (APCI), though generally less susceptible to suppression than ESI, interference can still occur through effects on charge transfer efficiency from the corona discharge needle or through solid formation [47]. Understanding these fundamental mechanisms provides the foundation for developing effective strategies to overcome analytical hurdles in complex matrices.
Experimental Protocols for Detecting and Evaluating Ion Suppression
Post-Extraction Spike Method
This quantitative approach evaluates the extent of ion suppression by comparing analyte response in matrix versus clean solvent [47].
Procedure:
- Prepare a blank sample matrix (e.g., plasma, urine, tissue homogenate) and subject it to the standard extraction protocol
- Spike the analyte of interest into the extracted blank matrix at a known concentration
- Inject the post-extraction spiked sample into the LC-MS system
- Prepare an equivalent concentration of the analyte in neat mobile phase and inject
- Calculate the ion suppression effect using the formula: (100 - B)/(A × 100), where A represents the unsuppressed signal (neat mobile phase) and B represents the suppressed signal (post-extraction spike) [47]
Interpretation: A significant reduction in the analyte signal in the matrix compared to the neat solvent indicates ion suppression. While this method effectively quantifies the extent of suppression, it does not identify the chromatographic location of the interference.
Continuous Infusion Experiment
This qualitative method identifies the chromatographic regions affected by ion suppression and provides a visual profile of matrix effects [47] [46].
Procedure:
- Configure the LC-MS system to allow post-column infusion using a syringe pump or tee-connector
- Prepare a standard solution containing the analyte and internal standard at appropriate concentrations
- Begin continuous infusion of the standard solution at a constant flow rate (typically 5-20 μL/min)
- Inject a blank sample extract into the LC system while monitoring the analyte signal
- Observe the chromatographic baseline during the entire run time
Interpretation: A stable baseline indicates no significant ion suppression. Drops or dips in the baseline indicate regions where co-eluting matrix components suppress the analyte ionization. This method is particularly valuable during method development as it helps identify problematic retention windows that may require chromatographic optimization [47].
Quantitative Assessment of Ion Suppression
Table 1: Comparison of Ion Suppression Detection Methods
| Method | Detection Principle | Information Provided | Advantages | Limitations |
|---|---|---|---|---|
| Post-Extraction Spike | Compare analyte response in matrix vs. pure solvent | Extent of ion suppression | Quantitative results; Simple implementation | Does not identify chromatographic location of interference |
| Continuous Infusion | Monitor baseline during blank matrix injection | Chromatographic profile of suppression | Identifies problematic retention windows; Visual output | Qualitative rather than quantitative; Requires special instrument setup |
Table 2: Ion Suppression Mitigation Strategies and Applications
| Strategy | Mechanism of Action | Effectiveness | Implementation Complexity | Best Suited Applications |
|---|---|---|---|---|
| Sample Cleanup | Removes interfering matrix components | High | Moderate to High | Complex biological matrices (plasma, tissue) |
| Chromatographic Optimization | Separates analytes from interferents | High | Moderate | Methods with co-eluting compounds |
| Internal Standardization | Compensates for suppression effects | Medium to High | Low | All quantitative applications |
| Switching Ionization Modes | Alters ionization mechanism | Variable | Low | Methods with compatible analytes |
The sensitivity of analytical methods to ion suppression can be substantial. Studies have demonstrated that ion suppression can reduce analyte response by 50% or more in severe cases, potentially rendering target analytes undetected even on highly sensitive instrumentation [46]. The variability of matrix effects between individual samples further complicates this issue, as blood samples from different people can exhibit varying ion-suppression effects due to differences in matrix components [46]. In forensic contexts, this variability underscores the necessity of comprehensive method validation that accounts for population-level matrix variations.
Analytical Workflow for Managing Matrix Effects
The following workflow diagram illustrates a systematic approach to addressing ion suppression in analytical methods:
The Scientist's Toolkit: Essential Research Reagents and Materials
Table 3: Key Research Reagent Solutions for Managing Ion Suppression
| Reagent/Material | Function | Application Notes |
|---|---|---|
| Stable Isotope-Labeled Internal Standards | Compensates for ion suppression effects through normalized response | Ideally should elute at same time as analyte; Corrects for extraction and matrix effects |
| Selective Solid-Phase Extraction (SPE) Sorbents | Removes specific matrix interferents while retaining analytes | Various chemistries available (C18, mixed-mode, HLB); Choice depends on analyte and matrix properties |
| Enhanced Purity Solvents and Mobile Phase Additives | Reduces background interference and chemical noise | LC-MS grade solvents; High purity volatile additives (formic acid, ammonium acetate) |
| Specialized Sampling Materials | Standardizes sample collection to minimize matrix variability | ANDE swab devices with RFID tracking; Manufacturer-recommended collection materials crucial for Rapid DNA systems [48] |
The selection of appropriate sample collection materials is particularly critical in forensic applications. Studies comparing Rapid DNA technologies have demonstrated that the brand of cotton swabs used significantly impacts results, with deviations from manufacturer recommendations proving particularly detrimental to some systems [48]. This highlights the importance of standardized consumables in analytical workflows subject to regulatory scrutiny.
Advanced Applications in Forensic Chemistry and Rapid Technologies
The integration of Rapid DNA technologies into forensic workflows represents a significant advancement for addressing analytical challenges while improving efficiency. Systems such as the Applied BioSystems RapidHIT ID and ANDE 6C Rapid DNA Analysis Systems have demonstrated comparable sensitivity, generating full profiles from samples yielding 5–10 ng of DNA in conventional analysis [48]. These fully automated platforms complete the entire DNA processing workflow—including cell lysis, DNA extraction, amplification, separation, detection, and allele calling—in approximately 90 minutes, significantly faster than standard laboratory workflows [48].
The adaptation of these technologies for various sample types beyond buccal swabs has expanded their forensic applications. The implementation of specialized chemistries such as the I-Chip (featuring a DNA concentration module) and RapidINTEL cartridges (with smaller lysis buffer volume and increased amplification cycles) has enabled processing of more challenging forensic samples, including blood, saliva, and touch evidence [48]. This advancement supports diverse applications including evidence processing, sexual assault sample screening, missing persons investigations, disaster victim identification, and human trafficking prevention [48].
Effectively managing ion suppression requires a systematic approach incorporating rigorous assessment during method development and implementation of appropriate mitigation strategies. The evaluation of matrix effects should form an integral component of any quantitative LC-MS method validation, as emphasized by regulatory guidelines including the FDA's "Guidance for Industry on Bioanalytical Method Validation" [46]. The continuing advancement of rapid analytical technologies promises enhanced efficiency in forensic chemistry workflows, but these gains must be balanced with thorough validation to ensure analytical reliability.
Future developments in materials science, instrumentation, and data processing algorithms will likely provide additional tools for addressing the persistent challenge of matrix effects. Meanwhile, the fundamental principles outlined in this application note—comprehensive assessment, appropriate sample preparation, chromatographic optimization, and effective internal standardization—remain essential for producing reliable analytical data in the presence of complex matrices.
In modern forensic chemistry, the efficiency and reliability of analytical workflows are heavily dependent on the initial sample preparation stage. Innovations in this area, specifically the development of miniaturized kits and automated extraction systems, are revolutionizing practices by significantly accelerating processing times, improving analytical sensitivity, and enabling high-throughput operations [49] [39] [50]. These advancements are pivotal for addressing critical challenges such as casework backlogs, particularly in drug analysis and the processing of sexual assault evidence kits (SAEKs) [39] [50]. By integrating these rapid technologies, forensic laboratories can enhance their operational efficiency, reduce human error, and provide more timely and reliable results for the judicial system. This document details the application and protocols of these innovative tools within forensic chemistry workflows.
Miniaturized Kits for Forensic Sample Preparation
Miniaturization in forensic science involves scaling down analytical processes to consume less sample and solvent, thereby increasing portability, reducing costs, and enabling faster analysis [49]. This principle is central to several miniaturized separation techniques and the kits that support them.
Principles and Technologies
Miniaturized kits typically leverage microfluidic devices and capillary-based systems to handle liquid samples in the microliter range. The core technologies include:
- Capillary Electrophoresis (CE): CE offers high separation efficiency, automation capability, and minimal consumption of reagents and samples [49]. It is particularly valuable for the chiral separation of illicit drugs and their metabolites, which helps distinguish between the consumption of illegal drugs and legal medications [49].
- Nano-Liquid Chromatography (nano-LC): As a miniaturized form of HPLC, nano-LC provides enhanced sensitivity with a significantly reduced requirement for organic solvents, lowering operational costs and environmental impact [49].
- Magnetic Bead-Based Chemistry: Kits such as those employing sbeadex technology use superparamagnetic particles with specialized surface chemistry to bind nucleic acids or other analytes [51]. This technology streamlines purification by eliminating centrifugation and drying steps, facilitates automation, and effectively removes impurities that can inhibit downstream analysis like PCR [51].
Application Note: Seized Drug Analysis Using Rapid GC-MS
The following case study illustrates how optimized sample preparation and miniaturized principles in instrumentation can enhance forensic drug analysis.
- Objective: To develop and validate a rapid GC-MS method for screening seized drugs that reduces analysis time while maintaining or improving sensitivity [39].
- Background: Conventional GC-MS methods, while reliable, often involve analysis times of 30 minutes or more, contributing to forensic backlogs [39].
- Methodology:
- Sample Preparation: For solid drug samples, approximately 0.1 g of material was ground into a powder and extracted with 1 mL of methanol via sonication and centrifugation. For trace samples, swabs moistened with methanol were used to collect residues from surfaces, and the analytes were subsequently vortexed into 1 mL of methanol [39].
- Instrumental Analysis: The extracts were analyzed using an Agilent GC-MS system. The key innovation was the optimization of temperature programming and carrier gas flow rates on a standard 30-m column to shorten the run time from 30 minutes to just 10 minutes [39].
- Results and Discussion: The rapid GC-MS method demonstrated a 50% improvement in the limit of detection (LOD) for key substances like Cocaine (1 µg/mL) and Heroin compared to the conventional method. It exhibited excellent repeatability and reproducibility (Relative Standard Deviation, RSD < 0.25%) and was successfully applied to 20 real case samples from Dubai Police Forensic Labs, accurately identifying diverse drug classes with high confidence [39]. This showcases how streamlined preparation and rapid analysis directly increase workflow efficiency.
Table 1: Performance Data for Rapid GC-MS Method in Drug Analysis [39]
| Compound | LOD (µg/mL) | Repeatability (RSD%) | Reproducibility (RSD%) | Match Quality Score (%) |
|---|---|---|---|---|
| Cocaine | 1.0 | < 0.25 | < 0.25 | > 90 |
| Heroin | Improved by 50% | < 0.25 | < 0.25 | > 90 |
| MDMA | Data Specific | < 0.25 | < 0.25 | > 90 |
| THC | Data Specific | < 0.25 | < 0.25 | > 90 |
Protocol: DNA Purification using Sbeadex Magnetic Bead Technology
This protocol is designed for the purification of high-quality DNA from various sample types, suitable for downstream forensic applications.
- Kit Components:
- Sbeadex Magnetic Beads
- Lysis Buffer
- Wash Buffer 1 (contains guanidine hydrochloride)
- Wash Buffer 2 (ethanol-free)
- Elution Buffer (nuclease-free water)
- Procedure:
- Lysis: Add the sample (e.g., plant tissue, pathogen culture) to a tube containing Lysis Buffer and mix thoroughly to ensure complete cell disruption.
- Binding: Add Sbeadex magnetic beads to the lysate and incubate to allow DNA to bind to the beads. The novel binding mechanism ensures high purity.
- Washing:
- Place the tube on a magnetic stand to separate the beads from the supernatant. Discard the supernatant.
- Resuspend the bead-bound DNA in Wash Buffer 1, then separate and discard the supernatant.
- Perform a second wash with the ethanol-free Wash Buffer 2 to remove residual impurities.
- Elution: Add nuclease-free water to the washed beads, mix to elute the pure DNA, and place on a magnetic stand. Transfer the purified DNA to a new tube [51].
- Notes: The entire protocol can be completed in approximately 45 minutes. The elimination of a drying step and the use of an ethanol-free wash buffer simplify the process and improve DNA quality for sensitive downstream applications [51].
Automated Extraction Systems
Automation in sample extraction addresses the limitations of manual methods, which are time-consuming, labor-intensive, and prone to human error and contamination [50].
Principles and Technologies
Automated systems use robotic liquid handling and pre-programmed protocols to perform complex extraction workflows with minimal human intervention.
- Throughput and Efficiency: Systems like the AutoMate Express and Maxwell RSC 48 can process batches of samples simultaneously, dramatically increasing laboratory throughput [52] [50]. This is critical for reducing backlogs of sexual assault evidence kits (SAEKs) and seized drug samples.
- Consistency and Reproducibility: Automation standardizes the extraction process, minimizing variability between operators and ensuring that every sample is treated identically, which is essential for the admissibility of evidence in court [50].
- Flexibility: Modern systems are designed to handle a diverse array of sample types, from routine buccal swabs and bodily fluids to challenging samples like bones, teeth, adhesive materials (e.g., cigarette butts), and casework items containing illicit drugs [52] [53].
Application Note: Processing Sexual Assault Evidence Kits (SAEKs)
- Challenge: SAEKs often contain mixed DNA samples that are complex and time-consuming to process manually, contributing to significant backlogs [50].
- Solution: Automated systems can integrate a differential extraction process, which uses a degradative agent to selectively separate sperm cells from non-sperm (epithelial) cells. The system automates the numerous washing and centrifugation steps, increasing processing capabilities and yielding purer DNA fractions with minimal epithelial cell carryover [50].
- Outcome: The integration of the Maxwell RSC 48 Instrument for DNA extraction has been validated to meet forensic standards, providing high-quality, reliable DNA yields essential for accurate STR profiling. This allows laboratories to reallocate personnel from tedious manual tasks to data analysis, thereby accelerating case resolution [50].
Protocol: Automated Forensic DNA Extraction using the AutoMate Express System
This protocol outlines the steps for automated DNA extraction using the PrepFiler Express Kits on the AutoMate Express system.
- Kit Components:
- Prefilled, foil-sealed reagent cartridges.
- PrepFiler LySep Columns for efficient substrate separation.
- Procedure:
- Sample Lysis and Preparation:
- Add the forensic sample (e.g., a swab) and the appropriate lysis buffer to the PrepFiler LySep Column.
- Incubate and then centrifuge the column at high speed. The lysate flows through a proprietary membrane while the substrate (e.g., fabric, swab material) is retained.
- Instrument Setup:
- Transfer the tube containing the lysate directly to the AutoMate Express instrument.
- Load the prefilled reagent cartridge and select the desired elution volume (options range from 20 µL to 250 µL).
- Automated Extraction:
- Start the run. The instrument automatically performs all subsequent steps, including:
- Binding of DNA to magnetic particles.
- Multiple wash steps to remove inhibitors and contaminants.
- Elution of purified DNA in the selected volume.
- Start the run. The instrument automatically performs all subsequent steps, including:
- Output: The system processes 1 to 13 samples in a single run, yielding high-quality DNA free of PCR inhibitors, ready for downstream quantification and STR analysis [52].
- Sample Lysis and Preparation:
Table 2: Comparison of Automated Extraction Systems and Kits
| System/Kit | Key Technology | Sample Types | Throughput | Key Feature |
|---|---|---|---|---|
| AutoMate Express | Magnetic Particles | Bodily fluids, swabs, cloth, challenging samples (bone, tooth, adhesive) [52] | 1-13 samples/run | Greatest range of elution volumes (20-250 µL); integrated LySep Column [52] |
| Maxwell RSC 48 | Paramagnetic Particles | Human blood, saliva, buccal swabs, semen [50] | 48 samples/run | Medium- to high-throughput; validated for forensic inhibitor removal [50] |
| Sbeadex Kits | Magnetic Beads (sbeadex) | Plant tissue, pathogenic bacteria, viruses, yeasts [51] | Variable (automation compatible) | Ethanol-free wash buffers; no drying step; compatible with multiple robotic platforms [51] |
| PrepFiler Manual Kits | Magnetic Particles | Bodily fluid stains, swabs, calcified tissues [52] | Manual Processing | DNA yields and purity comparable to phenol-chloroform methods in 2-3 hours [52] |
The Scientist's Toolkit: Research Reagent Solutions
Table 3: Essential Materials for Sample Preparation and Extraction
| Item | Function |
|---|---|
| PrepFiler Express Forensic DNA Extraction Kit | Designed for automated extraction of DNA from standard forensic samples like bodily fluids on various substrates [52]. |
| PrepFiler Express BTA Forensic DNA Extraction Kit | Formulated for challenging samples such as bones, teeth, and adhesive-based materials (e.g., cigarette butts) [52]. |
| Sbeadex Magnetic Beads | The core of sbeadex kits, these beads have a novel surface chemistry for efficient binding and purification of DNA/RNA, removing PCR inhibitors [51]. |
| PrepFiler LySep Column | A unique column used to streamline the separation of biological lysate from the substrate (e.g., swab, fabric) during the initial lysis step, minimizing manual handling [52]. |
| Proteinase K | An enzyme often included as a separate component (e.g., in sbeadex Pathogen Kits) to boost extraction efficiency by aiding in cell disruption and nucleic acid release [51]. |
Workflow Integration Diagram
The following diagram illustrates the integrated workflow for forensic sample analysis, comparing traditional and innovative approaches.
Workflow Comparison: Traditional vs. Innovative
This diagram visualizes the streamlined process achieved by integrating automated systems and miniaturized kits, leading to faster results and reduced manual intervention.
The adoption of miniaturized kits and automated extraction systems represents a paradigm shift in forensic chemistry workflows. These technologies directly address the pressing needs for increased efficiency, reduced backlogs, and enhanced data reliability. By minimizing manual steps, these innovations reduce the potential for human error and contamination while freeing up skilled personnel for data interpretation. As the field continues to evolve, the ongoing development and validation of these sample preparation tools will be fundamental to advancing forensic science, strengthening the judicial process, and providing faster and more conclusive scientific evidence.
In the field of forensic chemistry, the increasing volume and complexity of analytical data necessitate robust digital infrastructure. The integration of Laboratory Information Management Systems (LIMS) with advanced software platforms is critical for maintaining data integrity, ensuring chain of custody, and accelerating research workflows. This document outlines application notes and protocols for implementing these systems within forensic chemistry contexts, particularly focusing on drug development and analysis. The content is framed within a broader thesis on how rapid technological adoption increases efficiency in forensic chemistry workflows.
LIMS Platform Capabilities for Forensic Chemistry
Laboratory Information Management Systems (LIMS) serve as the digital backbone for modern forensic laboratories, providing centralized control over samples, data, and workflows [54]. In 2025, leading platforms have evolved into comprehensive laboratory ecosystem managers that interface seamlessly with Electronic Laboratory Notebooks (ELNs), Scientific Data Management Systems (SDMS), and analytical instruments [55] [54].
Table 1: Comparison of Leading LIMS Platforms for Forensic and Chemical Applications
| Platform Name | Key Features | Strengths | Considerations | Compliance Support |
|---|---|---|---|---|
| Thermo Fisher SampleManager LIMS | Case management, chain of custody tracking, instrument integration [56] | Designed for regulated, enterprise-scale environments; strong vendor support [55] | Complex implementation; requires significant IT support [55] | FDA 21 CFR Part 11, GxP, ISO/IEC 17025, ASCLD/LAB [55] [56] |
| LabVantage | Integrated LIMS + ELN + SDMS + analytics; browser-based UI [55] | End-to-end data handling; highly configurable; global enterprise-ready [55] | Steep setup timeline (often 6+ months); can be overwhelming for small labs [55] | ISO/IEC 17025, GxP [55] |
| LabWare | Fully integrated LIMS and ELN suite; advanced instrument interfacing [55] | Enterprise-scale; highly flexible; strong regulatory confidence [55] | Steep learning curve; longer deployment time; resource demands [55] | GxP, GLP, FDA 21 CFR Part 11 [55] |
| Revvity Signals | FAIR-ready chemistry drawings; connection to Signals Notebook and Research Suite [54] | Unified laboratory operations; AI-powered analytics; cloud-based collaboration [54] | Part of broader ecosystem; potential integration complexity | Regulatory compliance management [54] |
| Matrix Gemini LIMS | Visual configuration without coding; modular licensing [55] | Cost-efficient scalability; code-free configuration; industry templates [55] | UI not slick; training required; not ideal for enterprise pharma [55] | Configurable for various regulatory needs [55] |
For forensic testing laboratories, LIMS software must manage complete testing processes including case management to ensure traceability and certainty of results [56]. Specific capabilities should include sample management to establish chain of custody, instrument integration to eliminate transcription errors, comprehensive audit trails, and workflow capabilities that map to actual laboratory processes [56].
Experimental Protocols
Protocol 1: Integration of LIMS with Forensic Chemistry Instruments
Objective: To establish bidirectional connectivity between analytical instruments and LIMS for automated data capture and sample tracking.
Materials:
- LIMS platform (e.g., Thermo Fisher SampleManager, LabVantage, LabWare)
- Analytical instruments (Q-TOF MS, GC-MS, HPLC)
- Integration middleware
- Standardized communication protocols (e.g., SILA, AnIML)
Procedure:
- System Configuration
- Define instrument-specific data formats and metadata requirements in LIMS
- Configure LIMS to accept raw data, processed results, and quality control metrics
- Establish user permissions and access controls for data security
Interface Setup
- Implement instrument-specific connectors using vendor-provided SDKs or APIs
- Configure automated data transfer triggered by instrument run completion
- Set up error handling and notification systems for failed transfers
Validation
- Execute test runs with certified reference materials
- Verify data integrity through checksum validation and audit trail review
- Confirm chain of custody maintenance through sample lifecycle
Quality Control
- Implement automated flagging of results outside predefined thresholds
- Establish regular review cycles for integration performance
- Maintain documentation for regulatory compliance
Troubleshooting:
- Data transfer failures: Verify network connectivity and file permissions
- Format mismatches: Review and update data parsing algorithms
- Performance issues: Optimize database indexing and storage architecture
Protocol 2: Implementation of AI-Powered Data Analysis
Objective: To integrate deep learning platforms with LIMS for enhanced data interpretation and predictive modeling.
Materials:
- LIMS with API access
- AI/ML platforms (e.g., Intellegens Alchemite, Iktos Makya)
- Computational resources (CPU/GPU clusters)
- Historical experimental data
Procedure:
- Data Preparation
- Extract structured and unstructured data from LIMS database
- Clean and normalize data using predefined criteria
- Annotate data with relevant metadata for training
Model Training
- Select appropriate algorithms based on data characteristics and research goals
- Train models using historical data with cross-validation
- Optimize hyperparameters for performance metrics
Integration
- Deploy trained models through containerized microservices
- Establish secure API connections between LIMS and AI platforms
- Implement result caching for performance optimization
Validation
- Compare AI-generated insights with expert analysis
- Assess false positive/negative rates using blinded samples
- Document model performance characteristics for regulatory review
Troubleshooting:
- Poor model performance: Review data quality and feature selection
- Integration failures: Verify API endpoints and authentication
- Computational bottlenecks: Scale resources or optimize algorithms
Workflow Visualization
Forensic DNA Analysis Workflow
Diagram 1: Forensic DNA analysis workflow from evidence to report.
LIMS Integration Architecture
Diagram 2: LIMS integration with instruments and software systems.
The Scientist's Toolkit: Research Reagent Solutions
Table 2: Essential Research Reagents and Materials for Forensic Chemistry Workflows
| Reagent/Material | Function | Application Notes |
|---|---|---|
| InnoXtract Forensic DNA Extraction Kits | Manual and automated kits compatible with forensic sample types—low-input, degraded, or inhibited [57] | Validated protocols for reproducibility and downstream compatibility; effective for buccal swabs, blood stains, bone, and hair [57] |
| InnoQuant HY DNA Quantitation Kit | qPCR-based quantification of total human and male DNA with assessment of degradation levels [57] | Automation-compatible workflows for high-throughput labs; flexible kit size formats available [57] |
| CE and NGS STR Panels | High-resolution STR, SNP, and mtDNA profiling via multiplex PCR and next-generation sequencing [57] | Optimized workflows for degraded, low-input, or complex DNA mixtures; customizable for jurisdictional requirements [57] |
| QTRAP and Q-TOF Technology | Sensitive quantitation of novel psychoactive substances (NPS) and metabolites in complex matrices [58] | Enables simultaneous identification and quantitation; supports retrospective data analysis [58] |
| Signals ChemDraw | Chemical communication and intelligence for drawing complex molecules and reactions [54] | FAIR-ready, allowing researchers to find chemistry drawings in documents, reuse them, and create reports quickly [54] |
| OpenEye Orion | Cloud-based computational chemistry extending traditional LIMS capabilities [54] | Includes comprehensive suites for small molecule discovery, antibody research, and formulations with AWS-powered computing infrastructure [54] |
Data Presentation and Analysis
Effective data presentation is crucial for interpreting forensic chemistry results. Tables should be self-explanatory, with clear titles, column headings, and units of measurement [59] [60]. Quantitative data benefits from statistical summaries that include absolute frequencies, relative frequencies, and cumulative distributions where appropriate [60].
Table 3: Example Data Table Structure for Forensic Method Validation
| Analyte | Retention Time (min) | Precision (%RSD) | Accuracy (%) | LOD (ng/mL) | LOQ (ng/mL) |
|---|---|---|---|---|---|
| Analyte 1 | 4.52 | 3.2 | 98.5 | 0.05 | 0.15 |
| Analyte 2 | 5.87 | 2.8 | 102.3 | 0.03 | 0.10 |
| Analyte 3 | 7.42 | 4.1 | 97.8 | 0.08 | 0.25 |
| Internal Standard | 6.15 | N/A | N/A | N/A | N/A |
For categorical data in forensic chemistry (e.g., presence/absence of compounds), frequency distributions presented in tables or bar charts effectively communicate results [60]. Numerical data, such as concentration measurements, benefit from histograms or frequency polygons that show distribution patterns [60].
The integration of robust LIMS platforms with advanced analytical software creates a connected laboratory environment that significantly enhances efficiency in forensic chemistry workflows. By implementing the protocols and utilizing the tools outlined in this document, researchers and drug development professionals can ensure data integrity, maintain chain of custody, and accelerate the transformation of raw data into actionable intelligence. As forensic technologies continue to evolve, the seamless data handling and integration capabilities provided by these systems will become increasingly critical for meeting regulatory requirements and advancing scientific discovery.
Proving Worth: Validation, Legal Admissibility, and Technology Benchmarking
Within the broader thesis investigating how rapid technologies increase efficiency in forensic chemistry workflows, establishing rigorous forensic validity is paramount. The adoption of any new analytical technique necessitates a comprehensive validation to understand its capabilities and limitations, ensuring the generation of consistent and reliable results for judicial processes [61]. This document outlines detailed application notes and protocols for the validation of rapid Gas Chromatography-Mass Spectrometry (GC-MS) methods, focusing on the critical parameters of sensitivity, repeatability, and reproducibility. With global incidences of drug trafficking and substance abuse on the rise, forensic laboratories are increasingly turning to rapid screening techniques to decrease case backlogs and expedite confirmatory analyses [39] [62]. The protocols herein are designed to provide researchers, scientists, and forensic professionals with a standardized framework to validate these emerging technologies, thereby enhancing the efficiency and reliability of forensic chemistry workflows.
Experimental Protocols
Method Validation for Seized Drug Screening
This protocol describes the comprehensive validation of a rapid GC-MS system for seized drug screening applications, based on established methodologies [61] [39]. The validation assesses nine key components to ensure analytical performance.
Materials and Reagents
- Instrumentation: Agilent 7890B GC system coupled with an Agilent 5977A single quadrupole mass spectrometer, equipped with a DB-5 ms column (30 m × 0.25 mm × 0.25 μm) [39].
- Carrier Gas: Helium (99.999% purity) at a fixed flow rate of 2 mL/min [39].
- Test Solutions: Single- and multi-compound test solutions of commonly encountered seized drug compounds (e.g., tramadol, cocaine, MDMA, synthetic cannabinoids) prepared in methanol or acetonitrile at specified concentrations (e.g., 0.25 mg/mL per compound) [61] [39].
- Data Analysis Software: Agilent MassHunter and Enhanced ChemStation for data acquisition; Wiley and Cayman Spectral Libraries for compound identification [39].
Procedure
- System Setup: Configure the rapid GC-MS system using the optimized parameters detailed in Table 1.
- Selectivity Assessment:
- Inject test solutions containing isomeric compounds (e.g., fluorofentanyl isomers, pentylone isomers).
- Evaluate the system's ability to differentiate between isomers based on retention times and mass spectral search scores [61].
- Precision Evaluation:
- Perform repeated injections (n=5 or n=10) of a multi-compound test solution within a day (repeatability) and over different days (intermediate precision).
- Calculate the percent relative standard deviation (% RSD) for retention times and mass spectral search scores. An acceptance criterion of ≤10% RSD is typically applied [61] [39].
- Limit of Detection (LOD) Determination:
- Analyze a series of diluted standard solutions to establish the minimum concentration at which a compound can be reliably detected.
- Compare LODs with those obtained from conventional GC-MS methods [39].
- Robustness and Ruggedness Testing:
- Robustness: Deliberately introduce small, deliberate variations in method parameters (e.g., temperature, flow rate) to assess the method's resilience.
- Ruggedness: Have a second analyst perform the analysis using the same protocol and instrument to assess transferability [61].
- Carryover/Contamination Check:
- Inject a blank solvent (e.g., methanol) immediately following the analysis of a high-concentration standard.
- Inspect the blank chromatogram for any peaks corresponding to the analytes [61].
- Analysis of Real Case Samples:
- Apply the validated method to authentic seized drug samples (e.g., powders, tablets, trace samples from swabs) using appropriate extraction procedures [39].
- Compare the identification results and match quality scores against those obtained from a conventional, confirmatory GC-MS method.
Protocol for Sample Preparation and Analysis
This protocol details the extraction and preparation of various forensic sample types for analysis with rapid GC-MS.
Materials
- Samples: Seized drug exhibits in solid (powders, tablets) or trace forms.
- Solvents: HPLC-grade methanol.
- Equipment: Ultrasonic bath, centrifuge, vortex mixer, mortar and pestle, GC-MS capped vials.
Procedure for Solid Samples
- Grinding: For tablets and capsules, grind the material into a fine powder using a mortar and pestle.
- Extraction: Weigh approximately 0.1 g of the powder into a test tube. Add 1 mL of methanol.
- Sonication and Centrifugation: Sonicate the mixture for 5 minutes, then centrifuge to separate the phases.
- Supernatant Transfer: Transfer the clear supernatant into a 2 mL GC-MS vial for analysis [39].
Procedure for Trace Samples
- Swabbing: Use a swab moistened with methanol to collect residues from surfaces (e.g., digital scales, syringes) using a single-direction technique.
- Extraction: Immerse the swab tip in 1 mL of methanol in a test tube. Vortex vigorously.
- Supernatant Transfer: Transfer the methanol extract to a 2 mL GC-MS vial for analysis [39].
Data Presentation
The following tables summarize quantitative validation data from recent studies on rapid GC-MS methods, providing benchmarks for sensitivity, repeatability, and reproducibility.
Table 1: Optimized Parameters for Rapid vs. Conventional GC-MS Methods
| Parameter | Rapid GC-MS Method [39] | Conventional GC-MS Method [39] |
|---|---|---|
| Total Run Time | 10 minutes | 30 minutes |
| Column | DB-5 ms (30 m × 0.25 mm × 0.25 μm) | DB-5 ms (30 m × 0.25 mm × 0.25 μm) |
| Carrier Gas Flow | 2 mL/min (Helium) | 1 mL/min (Helium) |
| Injection Temp | 250 °C | 250 °C |
| Oven Program | Optimized for faster analysis (e.g., higher ramp rates) | Standard, slower temperature programming |
Table 2: Validation Data for Sensitivity and Precision in Rapid GC-MS
| Validation Component | Key Findings | Acceptance Criteria Met? | Source |
|---|---|---|---|
| Sensitivity (LOD) | LOD for Cocaine: 1 μg/mL (improved from 2.5 μg/mL with conventional method). Improvement of ≥50% for key substances like Heroin. | Yes | [39] |
| Precision (Repeatability) | Retention time % RSDs ≤ 0.25% for stable compounds. Mass spectral search score % RSDs generally ≤ 10%. | Yes | [61] [39] |
| Robustness/Ruggedness | Retention time and spectral score % RSDs ≤ 10% across analysts and parameter variations. | Yes | [61] |
| Selectivity | Successful differentiation of some isomers (e.g., methamphetamine, m-fluorofentanyl). Inability to differentiate some other isomers. | Partial (Limitation identified) | [61] |
Table 3: The Scientist's Toolkit: Essential Research Reagent Solutions
| Reagent/Material | Function in the Experiment | Source Example |
|---|---|---|
| Multi-Compound Test Solutions | Used as quality control standards to assess system performance, precision, and retention time stability across multiple drug classes. | Cayman Chemical; Sigma-Aldrich (Cerilliant) [61] [39] |
| Methanol (HPLC Grade) | Primary solvent for preparing standard solutions and extracting analytes from solid and trace forensic samples. | Sigma-Aldrich [61] [39] |
| Helium Carrier Gas | Mobile phase for gas chromatography; transports the vaporized sample through the chromatographic column. | Supplier of high-purity gases [39] |
| DB-5 ms GC Column | A (5%-phenyl)-methylpolysiloxane stationary phase column used for the separation of a wide range of organic compounds, including seized drugs. | Agilent J&W [39] |
| Spectral Libraries | Electronic databases of reference mass spectra used for automated identification of unknown compounds by spectral matching. | Wiley Spectral Library; Cayman Spectral Library [39] |
Workflow and Relationship Visualizations
The following diagrams illustrate the logical workflow of the validation process and the role of rapid technologies in enhancing forensic efficiency.
Rapid GC-MS Validation Workflow
Tech Adoption Boosts Forensic Efficiency
Forensic chemistry laboratories are under increasing pressure to enhance throughput and efficiency without compromising the accuracy and reliability of results. A central thesis of modern forensic science is that rapid technologies increase efficiency in forensic chemistry workflows, enabling faster judicial processes and law enforcement responses [39]. This application note provides a detailed, quantitative comparison of performance metrics between conventional and rapid analytical methods, with a specific focus on Gas Chromatography-Mass Spectrometry (GC-MS) for drug screening. We present structured experimental protocols and data to guide researchers and scientists in evaluating and implementing accelerated methodologies in their laboratories.
Performance Metrics Comparison
The following tables summarize key quantitative performance metrics derived from comparative studies, highlighting the operational and analytical advantages of rapid methods.
Table 1: Operational Efficiency Metrics for GC-MS Drug Analysis
| Performance Metric | Conventional GC-MS Method | Rapid GC-MS Method | Improvement |
|---|---|---|---|
| Total Analysis Time | 30 minutes [39] | 10 minutes [39] | 66.7% Reduction |
| Sample Throughput (per 8h) | ~16 samples | ~48 samples | 200% Increase |
| Carrier Gas Flow Rate | 1 mL/min [39] | 2 mL/min [39] | 100% Increase |
| Oven Ramp Rate | Standard rate [39] | Optimized, faster rate [39] | Significant Increase |
Table 2: Analytical Performance Metrics for Drug Screening
| Performance Metric | Conventional GC-MS Method | Rapid GC-MS Method | Notes |
|---|---|---|---|
| Limit of Detection (LOD) for Cocaine | 2.5 μg/mL [39] | 1 μg/mL [39] | ≥50% Improvement |
| Repeatability (RSD) | >0.25% (for stable compounds) [39] | <0.25% (for stable compounds) [39] | Excellent precision maintained |
| Identification Accuracy (Match Score) | High [39] | >90% [39] | High confidence maintained |
| Analysis Carryover | Minimal [39] | Evaluated and minimal [39] | No significant contamination |
Experimental Protocols
Protocol 1: Rapid GC-MS Screening of Seized Drugs
This protocol is adapted from the method developed and validated by Askar et al. (2025) for the rapid screening of seized drugs [39].
Research Reagent Solutions
Table 3: Essential Reagents and Materials
| Item | Function / Description |
|---|---|
| Agilent 7890B GC & 5977A MSD | Instrumentation for separation and detection. |
| DB-5 ms Column (30 m × 0.25 mm × 0.25 μm) | Stationary phase for chromatographic separation. |
| Helium Carrier Gas (99.999% purity) | Mobile phase for transporting analytes through the GC column. |
| Methanol (99.9%) | Solvent for preparing test solutions and extracting samples. |
| Certified Reference Standards | e.g., Cocaine, Heroin, MDMA (from Sigma-Aldrich/Cerilliant or Cayman Chemical). Used for method calibration and identification. |
| General Analysis Mixture | Custom mixture of target analytes at ~0.05 mg/mL in methanol for method development and quality control. |
Step-by-Step Procedure
Sample Preparation:
- For solid samples: Grind tablets/capsules to a fine powder. Weigh ~0.1 g and add to a test tube with 1 mL of methanol. Sonicate for 5 minutes and centrifuge. Transfer the supernatant to a GC-MS vial [39].
- For trace samples: Swab surfaces with a methanol-moistened swab. Place the swab tip in 1 mL of methanol and vortex vigorously. Transfer the extract to a GC-MS vial [39].
Instrument Configuration:
- GC Parameters:
- Injector Temperature: 250°C
- Carrier Gas Flow Rate: 2.0 mL/min (constant flow)
- Oven Temperature Program:
- Initial: 80°C
- Ramp: 40°C/min to 300°C
- Hold: 2.5 minutes
- Total Run Time: 10 minutes [39]
- MS Parameters:
- Ionization Mode: Electron Impact (EI)
- Ion Source Temperature: 230°C
- Quadrupole Temperature: 150°C
- Acquisition Mode: Scan (e.g., 40-550 m/z)
- GC Parameters:
Data Analysis:
Protocol 2: Comparative Analysis using Conventional GC-MS
To ensure a fair head-to-head comparison, the same samples and reagents from Protocol 1 are analyzed using a conventional, longer GC-MS method.
Sample Preparation: Identical to Step 1 in Protocol 3.1.2.
Instrument Configuration:
- GC Parameters:
- Injector Temperature: 250°C
- Carrier Gas Flow Rate: 1.0 mL/min (constant flow)
- Oven Temperature Program: A slower, more gradual temperature ramp (specific parameters to be defined based on in-house methods). The key differentiator is a total run time of approximately 30 minutes [39].
- GC Parameters:
Data Analysis: Identical to Step 3 in Protocol 3.1.2.
Workflow and Relationship Diagrams
The following diagram illustrates the overarching workflow and logical relationship between conventional and rapid methods as established in the featured study.
Comparative Method Workflow
The experimental sequence for comparing conventional and rapid GC-MS methods for drug analysis shows parallel processing paths from sample preparation to performance evaluation. The rapid method pathway demonstrates direct improvements in throughput and detection limits leading to method validation.
Discussion
The quantitative data presented in this application note strongly supports the thesis that rapid analytical technologies can significantly enhance forensic chemistry workflows. The optimized rapid GC-MS method demonstrates a 66.7% reduction in analysis time, which directly translates to a 200% increase in sample throughput [39]. This efficiency gain addresses critical challenges such as forensic case backlogs and enables faster law enforcement and judicial decision-making.
Crucially, this gain in speed does not come at the cost of analytical quality. The data shows that the rapid method can improve sensitivity, with a 50% better detection limit for cocaine, while maintaining excellent repeatability (RSD < 0.25%) and high identification confidence [39]. This makes the method suitable for a wide range of forensic samples, from bulk solids to trace residues.
The successful implementation of such rapid methods hinges on systematic optimization and validation of key parameters, including temperature programming and carrier gas flow rates [39]. The protocols provided here offer a template for researchers to adapt and validate these methods in their own laboratories, contributing to the broader adoption of efficient workflows in forensic science.
The integration of rapid technologies into forensic chemistry workflows presents a paradigm shift for laboratory efficiency. Techniques such as rapid Gas Chromatography-Mass Spectrometry (GC-MS) and comprehensive two-dimensional gas chromatography (GC×GC) significantly reduce analysis times, enabling faster processing of evidence including illicit drugs, toxicological samples, and ignitable liquid residues [63] [39]. However, the adoption of these advanced methodologies in legal proceedings is contingent upon their adherence to stringent evidentiary standards governing expert testimony. In the United States, the Daubert Standard and Frye Test serve as the primary legal gatekeepers, determining which scientific evidence is sufficiently reliable for presentation in court [64] [65]. For researchers and forensic scientists, navigating these legal frameworks is not merely a procedural formality but a fundamental aspect of method development and validation, ensuring that technological advancements translate into legally admissible evidence.
Unpacking the Legal Frameworks
The Frye Standard: General Acceptance
The Frye Standard originates from the 1923 case Frye v. United States and established the "general acceptance" test for the admissibility of expert testimony [66] [67]. Under this standard, the scientific technique or principle underlying an expert's opinion must have gained widespread acceptance within its relevant scientific community to be admissible in court [65] [66]. The court's reasoning in Frye famously stated that a scientific technique must be "sufficiently established to have gained general acceptance in the particular field in which it belongs" [66]. This standard places the decision about reliability largely in the hands of the scientific community, with the judge acting as a gatekeeper to ensure this consensus exists but not deeply evaluating the underlying validity of the method itself [65] [68].
- Application Scope: The Frye test is primarily applied to novel scientific evidence and techniques. Its focus is not on the expert's conclusions, but on the principles and methodology that led to those conclusions [66].
- Current Jurisdictional Use: While the Frye Standard was replaced in federal courts by the Daubert Standard in 1993, it remains the governing law in several state courts, including California, Illinois, and New York [65] [68].
The Daubert Standard: Judicial Gatekeeping
The Daubert Standard emerged from the 1993 U.S. Supreme Court case Daubert v. Merrell Dow Pharmaceuticals, Inc., which redefined the role of federal judges in admitting expert testimony [64] [69]. This standard positions the trial judge as an active "gatekeeper" responsible for assessing not just general acceptance, but the overall reliability and relevance of the expert's methodology and its application to the facts of the case [64] [65]. The Court provided a non-exhaustive list of factors for judges to consider:
- Testability: Whether the expert's theory or technique can be (and has been) tested.
- Peer Review: Whether the method has been subjected to peer review and publication.
- Error Rate: The known or potential error rate of the technique.
- Standards: The existence and maintenance of standards controlling the technique's operation.
- General Acceptance: The degree to which the theory or technique is generally accepted in the relevant scientific community [64] [65] [69].
Subsequent cases, General Electric Co. v. Joiner and Kumho Tire Co. v. Carmichael, clarified that this gatekeeping function applies to all expert testimony, not just scientific testimony, and that appellate courts should review a trial judge's admissibility decisions for "abuse of discretion" [65]. The Daubert Standard is now used in all federal courts and has been adopted by a majority of states [64] [68].
Comparative Analysis: Daubert vs. Frye
Table 1: Key Differences Between the Daubert and Frye Standards
| Feature | Daubert Standard | Frye Standard |
|---|---|---|
| Originating Case | Daubert v. Merrell Dow Pharmaceuticals, Inc. (1993) [64] | Frye v. United States (1923) [66] |
| Core Question | Is the testimony based on reliable principles and methods, applied reliably to the case? [64] [69] | Is the scientific technique generally accepted in the relevant scientific community? [66] [67] |
| Judge's Role | Active gatekeeper who assesses methodological reliability and relevance [64] [65] | Gatekeeper who assesses the level of acceptance within the scientific community [66] |
| Flexibility | More flexible, allows for newer methods if proven reliable [65] [68] | More rigid, can exclude novel science until consensus is reached [65] [68] |
| Scope of Application | Applies to all expert testimony (scientific, technical, specialized) [65] | Primarily applied to novel scientific evidence [66] |
| Primary Jurisdictions | All federal courts and a majority of state courts [65] [68] | A minority of state courts (e.g., CA, IL, NY) [68] |
The fundamental difference lies in their approach: Frye asks "Is this science generally accepted?" while Daubert asks "Is this science reliable and relevant to this case?" [65] [68]. This makes Daubert a more flexible but also more demanding standard, as it requires judges to engage in a deeper scrutiny of the scientific methodology itself.
Figure 1: A flowchart comparing the admissibility pathways for expert testimony under the Frye and Daubert standards.
Application to Rapid Forensic Technologies
Legal Readiness of Advanced Chromatographic Methods
The transition of rapid forensic technologies from research to the courtroom requires meeting the specific factors of the Daubert Standard or the general acceptance mandate of Frye. For instance, comprehensive two-dimensional gas chromatography (GC×GC) has been extensively explored in forensic research for its superior peak capacity in analyzing complex mixtures like illicit drugs, decomposition odor, and fire debris [63]. A 2024 review, however, highlights that while the technique is analytically powerful, its Technology Readiness Level (TRL) for routine forensic casework varies by application and requires further development to meet legal admissibility criteria fully [63]. Key gaps include a need for more intra- and inter-laboratory validation studies, established error rates, and standardized protocols—all of which are critical under Daubert [63].
Conversely, rapid GC-MS methods show a direct path to admissibility through rigorous, standards-based validation. A 2025 study developed a rapid GC-MS method that reduced drug screening analysis time from 30 minutes to 10 minutes while improving the limit of detection for cocaine by 50% (from 2.5 μg/mL to 1 μg/mL) [39]. The method's validation directly addressed Daubert and Frye requirements:
- Testing & Error Rate: The method was systematically validated, demonstrating excellent repeatability and reproducibility with relative standard deviations (RSDs) less than 0.25% for stable compounds [39].
- Standards: The validation followed established forensic guidelines, such as those from the Scientific Working Group for the Analysis of Seized Drugs (SWGDRUG), and was successfully applied to 20 real case samples from a police forensic lab [39].
- Peer Review & General Acceptance: The methodology was published in a peer-reviewed journal, contributing to its general acceptance in the field [39].
Experimental Protocol: Validating a Rapid GC-MS Method for Seized Drugs
The following protocol, adapted from Askar et al. (2025), outlines the key steps for developing and validating a rapid GC-MS method to meet legal admissibility standards [39].
1. Instrumentation and Setup:
- GC-MS System: Agilent 7890B GC coupled with 5977A MSD.
- Column: Agilent J&W DB-5 ms (30 m × 0.25 mm × 0.25 μm).
- Carrier Gas: Helium, constant flow rate of 2 mL/min.
- Data Acquisition: Agilent MassHunter software.
2. Method Optimization for Rapid Analysis:
- Temperature Program: Drastically shorten the run time by optimizing the temperature ramp. The rapid method uses an initial oven temperature of 80°C, followed by a sharp increase of 60°C/min to 320°C, held for 2.17 minutes. The total run time is 10 minutes [39].
- Inlet Temperature: 280°C.
- MS Source Temperature: 230°C.
3. Validation Procedures (Addressing Daubert Factors):
- Limit of Detection (LOD): Determine the lowest detectable concentration for each target analyte. The rapid method achieved an LOD of 1 μg/mL for cocaine, a significant improvement over the conventional method's 2.5 μg/mL [39].
- Precision (Repeatability & Reproducibility): Analyze replicates (n=6) of standard mixtures across different days. Calculate Relative Standard Deviations (RSDs) for retention times. The validated method showed RSDs < 0.25%, demonstrating high precision [39].
- Accuracy/Identification Confidence: Analyze samples against certified reference materials and use spectral library matching (e.g., Wiley Spectral Library). The method produced match quality scores consistently exceeding 90% [39].
- Robustness: Test the method's performance under deliberate, small variations in parameters (e.g., flow rate ±0.1 mL/min, temperature ±2°C) to ensure reliability.
4. Application to Real Casework Samples:
- Sample Preparation:
- Analysis: Analyze extracts using the validated rapid GC-MS parameters and compare results against those from the laboratory's conventional, accredited method.
Table 2: Key Performance Metrics of a Validated Rapid GC-MS Method vs. Conventional GC-MS
| Performance Metric | Rapid GC-MS Method | Conventional GC-MS Method |
|---|---|---|
| Total Run Time | 10 minutes [39] | 30 minutes [39] |
| LOD for Cocaine | 1 μg/mL [39] | 2.5 μg/mL [39] |
| Precision (RSD) | < 0.25% [39] | Data not specified in source |
| Application | Seized drug analysis (solid and trace samples) [39] | Seized drug analysis [39] |
| Legal Defensibility | High (when fully validated per SWGDRUG/SISO standards) [39] | Established (gold standard) [63] |
The Scientist's Toolkit: Essential Reagents and Materials
Table 3: Key Research Reagent Solutions for Rapid Forensic Drug Analysis
| Item | Function/Application |
|---|---|
| DB-5 ms Capillary GC Column (30 m × 0.25 mm × 0.25 μm) | The standard stationary phase for the separation of a wide range of forensic analytes, including drugs and ignitable liquids [39]. |
| Certified Reference Materials (CRMs) | Commercially available, certified pure analytes (e.g., from Cerilliant/Sigma-Aldrich) used for method development, calibration, and accuracy determination [39]. |
| Methanol (HPLC/GC Grade) | The primary solvent used for preparing standard solutions and extracting drugs from solid and trace evidence samples [39]. |
| General Analysis Mixture Sets | Custom mixtures of common drugs of abuse (e.g., cocaine, heroin, MDMA, synthetic cannabinoids) at known concentrations used for method development and validation [39]. |
| Internal Standards | Stable isotope-labeled analogs of target analytes used to correct for sample matrix effects and variability in instrument response, improving quantitative accuracy. |
| Quality Control (QC) Samples | Prepared samples of known concentration, different from the calibration standards, used to ensure the analytical run remains in control and results are reliable. |
The integration of rapid technologies such as GC×GC and rapid GC-MS into forensic chemistry represents a significant leap forward in operational efficiency. However, the ultimate test of these advancements is their ability to produce evidence that withstands legal scrutiny under the Daubert and Frye standards. For researchers and laboratory professionals, this necessitates a paradigm where method validation is paramount. A proactive approach, focusing on determining error rates, establishing standardized protocols, conducting inter-laboratory studies, and publishing findings, is essential. By building a robust foundation of reliability and general acceptance, the forensic science community can ensure that its cutting-edge tools not only accelerate workflows but also fortify the integrity of the justice system.
The integration of rapid technologies into forensic chemistry workflows represents a critical strategic priority for modern crime laboratories. The National Institute of Justice's Forensic Science Strategic Research Plan specifically highlights the need for "rapid technologies to increase efficiency" and "expanded triaging tools and techniques to develop actionable results" [13]. These technologies aim to address systemic challenges including evidence backlogs, resource constraints, and the growing complexity of forensic analysis, particularly in seized drug and toxicology casework.
This application note establishes a framework for quantifying the return on investment (ROI) when implementing such rapid technologies, with specific focus on throughput gains and backlog reduction as primary value indicators. The methodology enables forensic laboratory managers and researchers to conduct data-driven cost-benefit analyses that capture both direct financial returns and critical operational improvements [70] [71].
Quantitative Framework for Cost-Benefit Analysis
Core ROI Calculation Methodology
The fundamental ROI calculation for forensic technology implementation follows a standardized financial approach, adapted for laboratory environments:
Basic ROI Formula:
Productivity-Focused Calculation:
Figure 1. Workflow for conducting cost-benefit analysis of rapid technologies in forensic chemistry. The process begins with scope definition and progresses through systematic evaluation of costs and benefits before reaching an implementation decision.
The Scientist's Toolkit: Essential Research Reagents and Materials
Table 2: Key Research Reagent Solutions for Forensic Chemistry Workflows
| Reagent/Material | Function/Application | Implementation Considerations |
|---|---|---|
| Carbon Quantum Dots (CQDs) | Fluorescent sensing materials for enhanced detection of trace evidence and controlled substances [72] | Tunable optical properties allow customization for specific analytes; compatible with various detection platforms |
| Reference Standards | Certified materials for method validation, instrument calibration, and quality control | Must cover target analytes and potential interferents; require proper storage and stability monitoring |
| Sample Preparation Kits | Streamlined extraction and purification protocols for specific evidence types | Reduce hands-on time and improve reproducibility; optimize recovery rates and minimize contaminants |
| Automated Platform Consumables | Reagent cartridges, columns, and plates designed for high-throughput systems | Compatibility with automation equipment; lot-to-lot consistency critical for reproducible results |
| Data Analysis Software | Computational tools for rapid data interpretation and reporting | Integration with laboratory information systems; algorithm validation for forensic applications |
Case Study: Carbon Quantum Dots in Drug Identification
Carbon Quantum Dots (CQDs) represent an emerging nanomaterial technology with significant potential for forensic chemistry applications. These fluorescent nanoparticles offer tunable optical properties, high sensitivity, and rapid response times that align with the need for rapid technologies in forensic workflows [72].
Implementation Protocol
Objective: Implement CQD-based sensing for rapid screening of seized drugs.
Materials:
- Synthesized or commercial CQDs (nitrogen-doped recommended for enhanced fluorescence)
- Sample preparation materials (solvents, extraction devices)
- Detection platform (fluorometer or customized reader)
- Reference standards of target controlled substances
- Validation samples with known composition
Procedure:
- CQD Functionalization: Modify CQD surface chemistry to enhance selectivity for target drug classes [72]
- Assay Development: Optimize CQD concentration, sample volume, and incubation conditions
- Validation: Establish sensitivity, specificity, and reproducibility using certified reference materials
- Integration: Incorporate CQD assay into existing workflow as a presumptive testing method
- Comparison: Conduct parallel analysis with traditional methods (e.g., color tests, GC-MS)
Efficiency Metrics:
- Analysis time reduction compared to traditional methods
- Increase in samples processed per shift
- Reduction in confirmatory testing requirements due to improved specificity
ROI Calculation Example
Table 3: Sample ROI Analysis for CQD Implementation in Drug Chemistry Unit
| Metric | Pre-Implementation | Post-Implementation | Change |
|---|---|---|---|
| Samples processed per day | 40 | 72 | +80% |
| Analysis time per sample (minutes) | 45 | 20 | -55% |
| Backlog cases (monthly average) | 320 | 145 | -55% |
| Laboratory operating cost per sample | $38.50 | $24.75 | -36% |
| Technology investment | - | $125,000 | - |
| Annual operational savings | - | $217,000 | - |
| Calculated ROI (first year) | - | - | 73.6% |
Technology Integration and Optimization Pathways
Figure 2. Technology integration pathway showing how rapid technologies are assessed, implemented, and optimized within forensic workflows to achieve specific efficiency outcomes.
The strategic implementation of rapid technologies in forensic chemistry workflows delivers measurable ROI through throughput gains and backlog reduction. Successful adoption requires:
- Comprehensive baseline assessment before technology implementation
- Systematic validation of both analytical performance and efficiency improvements
- Stakeholder engagement across laboratory management, technical staff, and funding entities
- Ongoing monitoring of efficiency metrics to validate ROI projections
Forensic laboratories should prioritize technologies that align with the NIJ Strategic Research Plan's emphasis on "tools that increase sensitivity and specificity of forensic analysis" while simultaneously addressing operational efficiency challenges [13]. The framework presented enables quantitative assessment of both financial returns and operational improvements, supporting informed decision-making in resource-constrained environments.
Conclusion
The integration of rapid technologies is unequivocally reshaping forensic chemistry, moving the field toward unprecedented levels of efficiency without compromising analytical rigor. The convergence of accelerated instrumentation like rapid GC-MS, direct analysis techniques, and portable platforms directly addresses critical challenges of case backlogs and slow judicial processes. As demonstrated, successful implementation hinges not only on methodological prowess but also on rigorous validation, optimization, and a clear understanding of legal admissibility standards. Future progress will be driven by the continued miniaturization of technology, deeper integration of AI for data analysis, and a stronger focus on developing standardized, court-ready validation frameworks. For biomedical and clinical research, these advancements promise parallel benefits, particularly in toxicology and pharmaceutical analysis, where speed and accuracy are equally paramount. The ongoing evolution of these tools will further blur the lines between the laboratory and the field, ultimately delivering faster justice and enhancing public safety.
References
- 1. Forensic Technology Market Size, Share & Forecast 2035 [https://www.researchnester.com/reports/forensic-technology-market/5074]
- 2. How DNA Labs Are Holding the Line as Federal Funding ... [https://promega.foleon.com/theishireport/the-ishi-report-august-2025/undermined-how-dna-labs-are-holding-the-line-as-federal-funding-falters]
- 3. Use of statistical design of experiments (DoE) in Forensic ... [https://www.sciencedirect.com/science/article/abs/pii/S2468170924000067]
- 4. Quantitative Forensic Toxicology by Standard Addition [https://www.cfsre.org/resources/presentations/quantitative-forensic-toxicology-by-standard-addition-consideration-experimentation-and-implementation]
- 5. Portable molecular diagnostic platform for rapid point-of- ... [https://www.nature.com/articles/s41467-025-57647-3]
- 6. The role of rapid and advanced microbiological methods in ... [https://www.sciencedirect.com/science/article/pii/S1198743X25004203]
- 7. The future of forensics: How AI can transform investigations [https://washingtondc.jhu.edu/news/ai-in-forensics/]
- 8. Guidance for SARS-CoV-2 Rapid Testing in Point-of-Care ... [https://www.cdc.gov/covid/php/lab/point-of-care-testing.html]
- 9. Portable Electrochemical Device for Rapid and On-Site ... [https://www.sciencedirect.com/science/article/abs/pii/S0925400525014856]
- 10. Technology in Forensic Sciences: Innovation and Precision [https://www.mdpi.com/2227-7080/12/8/120]
- 11. Advanced Chemical Profiling [https://www.bruker.com/en/products-and-solutions/mr/nmr-epr-td-nmr-industrial-solutions/advanced-chemical-profiling.html]
- 12. Quantitative matching of forensic evidence fragments using ... [https://www.nature.com/articles/s41467-024-51594-1]
- 13. Forensic Science Strategic Research Plan, 2022-2026 ... [https://nij.ojp.gov/topics/articles/forensic-sciences-strategic-research-plan-2022-2026]
- 14. Quantitative and qualitative analysis of chemicals in forensics [https://www.ebsco.com/research-starters/chemistry/quantitative-and-qualitative-analysis-chemicals-forensics]
- 15. How is Quantitative Analysis Used in Chemistry? [https://www.reagent.co.uk/blog/how-is-quantitative-analysis-used-in-chemistry/]
- 16. Forensic Chemistry: Analytical Techniques Explained [https://www.hawkins.biz/insight/chemical-analytical-techniques-in-forensic-investigations/]
- 17. Benchtop Gas Chromatographs in 2025 at Pittcon and ... [https://www.chromatographyonline.com/view/benchtop-gas-chromatographs-in-2025-at-pittcon-and-beyond]
- 18. BAGI-assessed green GC-MS method for rapid analysis of ... [https://www.nature.com/articles/s41598-025-25388-4]
- 19. A comparison of peak table, tile, and pixel-based Fisher ... [https://www.sciencedirect.com/science/article/abs/pii/S0039914019313013]
- 20. Fundamentals of Calibration in Gas Chromatography [https://www.chromatographyonline.com/view/from-detector-to-decision-part-iii-fundamentals-of-calibration-in-gas-chromatography]
- 21. Forensic applications of DART-MS: A review of recent ... [https://www.sciencedirect.com/science/article/pii/S2468170920300825]
- 22. Application of direct analysis in real-time mass spectrometry ... [https://ejfs.springeropen.com/articles/10.1186/s41935-022-00276-4]
- 23. DART-MS [https://www.bruker.com/en/products-and-solutions/mass-spectrometry/dart-ms.html]
- 24. Rapid screening of riot control agents using DART-TD-HRMS [https://pmc.ncbi.nlm.nih.gov/articles/PMC11269514/]
- 25. DART-HRMS triage approach part 2 – Application to the ... [https://www.sciencedirect.com/science/article/pii/S246817092300005X]
- 26. DART-HRMS and chemometric analysis for applications in ... [https://scholarsarchive.library.albany.edu/legacy-etd/3211/]
- 27. Introducing a Rapid DNA Analysis Procedure for Crime ... [https://pmc.ncbi.nlm.nih.gov/articles/PMC10145755/]
- 28. Comparative analysis of two Rapid DNA technologies for ... [https://pubmed.ncbi.nlm.nih.gov/37573630/]
- 29. What is Rapid DNA? [https://www.ande.com/what-is-rapid-dna]
- 30. Environmental and forensic applications of field-portable ... [https://www.sciencedirect.com/science/article/pii/S1044030501002513]
- 31. Optimized Explosives Analysis Using Portable Gas ... [https://www.spectroscopyonline.com/view/optimized-explosives-analysis-using-portable-gas-chromatography-mass-spectrometry-battlefield-fore-0]
- 32. GC×GC–MS for Forensic Analysis [https://www.spectroscopyonline.com/view/gc-gc-ms-forensic-analysis-1]
- 33. Transforming Workflows with Automation [https://medium.com/@dejanmarkovic_53716/2025s-ai-revolution-transforming-workflows-with-automation-5332594ee166]
- 34. Automation for digital forensics: Towards a definition for the ... [https://www.sciencedirect.com/science/article/pii/S0379073823002190]
- 35. Workflow automation in 2025: Everything you need to know ... [https://www.xurrent.com/blog/workflow-automation-ai-business-efficiency-guide]
- 36. Guidelines for Ethical AI Use in Forensic ... [https://www.abve.net/ai-guidelines]
- 37. AI-Powered Learning: Revolutionizing Education and ... [https://www.mdpi.com/2078-2489/16/11/1015]
- 38. Best AI Automation Tools for Skyrocketing Productivity 2025 [https://hypestudio.org/top-10-best-ai-automation-tools-for-skyrocketing-productivity-in-2025/]
- 39. Rapid GC-MS method for screening seized drugs in ... [https://www.frontiersin.org/journals/chemistry/articles/10.3389/fchem.2025.1559279/full]
- 40. Rapid GC-MS method for screening seized drugs in ... [https://pmc.ncbi.nlm.nih.gov/articles/PMC12185466/]
- 41. A Sensitive and Comprehensive LC‐MS/MS Method for the ... [https://pmc.ncbi.nlm.nih.gov/articles/PMC12423360/]
- 42. The Secrets of Successful Temperature Programming [https://www.chromatographyonline.com/view/secrets-successful-temperature-programming]
- 43. Go With the Flow: Thinking About Carrier Gas Flow in GC [https://www.chromatographyonline.com/view/go-flow-thinking-about-carrier-gas-flow-gc]
- 44. Drug screening in pharmaceutical and forensic ... [https://www.nature.com/articles/s41598-025-14772-9]
- 45. Experimental GC-MS Flow Tuning: Boost Efficiency [https://eureka.patsnap.com/report-experimental-gc-ms-flow-tuning-boost-efficiency]
- 46. ; a critical review on causes, evaluation, prevention... Ion suppression [https://pubmed.ncbi.nlm.nih.gov/24054567/]
- 47. : A Major Concern in Mass Spectrometry Ion Suppression [https://www.chromatographyonline.com/view/ion-suppression-major-concern-mass-spectrometry]
- 48. Comparative analysis of two Rapid DNA technologies for ... [https://www.sciencedirect.com/science/article/abs/pii/S1872497323001035]
- 49. Forensic Drugs Analysis: A Review of Miniaturized ... [https://www.chromatographyonline.com/view/forensic-drugs-analysis-review-miniaturized-separation-techniques-0]
- 50. The Role of Automation in Reducing the SAEK Backlog [https://www.forensicmag.com/Forensic-Tips/613002-The-Role-of-Automation-in-Reducing-the-SAEK-Backlog/]
- 51. sbeadex nucleic acid purification technology [https://www.biosearchtech.com/products/nucleic-acid-sample-preparation/nucleic-acid-extraction-and-purification-reagents/nucleic-acid-purification-kits/sbeadex-kits]
- 52. AutoMate Express Forensic DNA Extraction System and ... [https://www.thermofisher.com/us/en/home/industrial/forensics/human-identification/forensic-dna-analysis/sample-preparation-extraction/automate-express-forensic-dna-extraction-system-prepfiler-dna-extraction-kits.html]
- 53. How Forensic Scientists Use Automated Liquid Handling [https://www.aurorabiomed.com/how-forensic-scientists-use-automated-liquid-handling/?srsltid=AfmBOoq-rQrOTIqh-X8aRgik0FPO5mIV6WvLAs-nksNkt21E3Rt128FF]
- 54. The latest LIMS software for Chemistry in 2025 [https://www.scientific-computing.com/article/latest-lims-software-chemistry]
- 55. Best LIMS of 2025: A Guide to the Top Laboratory ... [https://labworks.com/blog/best-lims-of-2025-a-guide-to-the-top-laboratory-information-management-system/]
- 56. Forensic Testing LIMS | Thermo Fisher Scientific - US [https://www.thermofisher.com/us/en/home/digital-solutions/lab-informatics/lims-forensics-testing.html]
- 57. forensic science solutions [https://biosecureid.com/fss/]
- 58. SOFT 2025 [https://sciex.com/events/soft-2025]
- 59. Figures and Charts - UNC Writing Center [https://writingcenter.unc.edu/tips-and-tools/figures-and-charts/]
- 60. Presenting data in tables and charts - PMC [https://pmc.ncbi.nlm.nih.gov/articles/PMC4008059/]
- 61. Validation of a rapid GC–MS method for forensic seized ... [https://www.sciencedirect.com/science/article/abs/pii/S2468170924000614]
- 62. Development & Validation of A Rapid GC-MS Method for ... [https://www.nist.gov/publications/development-validation-rapid-gc-ms-method-seized-drug-screening]
- 63. Are We Ready for It? A Review of Forensic Applications and ... [https://pmc.ncbi.nlm.nih.gov/articles/PMC12012292/]
- 64. Daubert Standard | Wex | LII / Legal Information Institute [https://www.law.cornell.edu/wex/daubert_standard]
- 65. Daubert vs. Frye: Standards of Admissibility for ... [https://www.expertinstitute.com/resources/insights/daubert-vs-frye-navigating-the-standards-of-admissibility-for-expert-testimony/]
- 66. The Frye Standard | Expert Testimony, Admissibility, History [https://www.expertinstitute.com/resources/insights/admitting-expert-testimony-under-the-frye-standard-the-ultimate-guide/]
- 67. What is Frye test? Simple Definition & Meaning [https://lsd.law/define/frye-test]
- 68. The Daubert Standard vs. The Frye Standard and How ... [https://www.brandonjbroderick.com/daubert-standard-vs-frye-standard-and-how-they-impact-personal-injury-cases]
- 69. What is Daubert standard? Simple Definition & Meaning [https://lsd.law/define/daubert-standard]
- 70. Cost-Benefit Analysis: A Quick Guide with Examples and ... [https://www.projectmanager.com/blog/cost-benefit-analysis-for-projects-a-step-by-step-guide]
- 71. Cost-Benefit Analysis Template: Evaluate Project ... [https://www.manifest.ly/blog/cost-benefit-analysis-template-evaluate-project-feasibility-and-roi/]
- 72. Carbon quantum dots (CQDs) in forensic investigations [https://pubs.rsc.org/en/content/articlehtml/2025/ra/d5ra05791d]