Portable vs. Laboratory IR Spectroscopy: A Strategic Guide for Field Detection in Biomedical Research
This article provides a comprehensive comparison of portable and laboratory-based infrared (IR) spectroscopy, tailored for researchers and professionals in drug development.
Portable vs. Laboratory IR Spectroscopy: A Strategic Guide for Field Detection in Biomedical Research
Abstract
This article provides a comprehensive comparison of portable and laboratory-based infrared (IR) spectroscopy, tailored for researchers and professionals in drug development. It explores the foundational principles, core strengths, and limitations of each approach. The scope extends to practical methodologies and applications in field detection, troubleshooting for real-world use, and a critical validation of performance against traditional lab techniques. By synthesizing current research and market trends, this guide aims to empower scientists in selecting and optimizing the right spectroscopic tool for enhanced efficiency and accuracy in pharmaceutical quality control, clinical diagnostics, and environmental monitoring.
Core Principles: Understanding Portable and Laboratory IR Spectroscopy
Portable Infrared (IR) spectroscopy is a chemical analysis technique that has been miniaturized from traditional laboratory systems into rugged, field-deployable instruments. These devices maintain the core principle of IR spectroscopy—the interaction between infrared light and matter to excite molecular vibrations—but are engineered for on-site analysis outside the controlled laboratory environment [1]. The technology has evolved significantly from the early fieldable FTIR systems developed in the 2000s, becoming standard equipment for many forensic and hazmat teams by enabling real-time, on-scene identification of substances [2].
The global portable spectrometer market, valued at $1,675.7 million in 2020, reflects this shift toward field-based analysis, projected to reach $4,065.7 million by 2030 [3]. This growth is driven by the critical need for rapid, accurate decision-making in field settings where transporting samples to a laboratory is impractical or would cause critical delays [2]. For researchers and drug development professionals, portable IR spectroscopy provides a viable alternative to laboratory-based systems, offering a balance between performance and field portability for applications ranging from pharmaceutical raw material verification to forensic substance identification.
Technology Fundamentals and Measurement Techniques
At its core, IR spectroscopy exploits the fact that chemical compounds absorb specific frequencies of infrared light that correspond to the natural vibrational frequencies of their chemical bonds [1]. When IR light passes through or interacts with a sample, certain frequencies are absorbed, creating a unique absorption pattern that serves as a molecular "fingerprint" for identification purposes [1].
Most modern portable IR systems utilize Fourier-Transform Infrared (FT-IR) technology, which employs an interferometer to simultaneously measure all infrared wavelengths, rather than checking each frequency individually [1]. This approach provides significant advantages in speed and accuracy with better signal-to-noise ratio compared to historical IR techniques [1]. The mathematical operation of Fourier transform then converts the raw data into a recognizable IR spectrum.
Portable IR spectrometers primarily employ three measurement techniques, each with distinct advantages for field use:
Attenuated Total Reflection (ATR): This has become the primary technique in portable instruments due to minimal sample preparation requirements and non-destructive analysis [1]. The sample is placed on a crystal (typically diamond, germanium, or zinc selenide), and IR light is directed through the crystal where it partially interacts with the sample [1]. ATR is particularly valuable in field settings where preparing samples to specific thicknesses is impractical.
Transmission: The "original" IR technique where light passes completely through the sample [1]. This method often requires extensive sample preparation, such as diluting liquids with solvents or grinding solids with potassium bromide to create pellets [1]. While transmission provides excellent quantitative results, its application in field settings is limited due to the destructive nature and preparation time.
Reflection: This technique detects IR light reflected off the sample surface, making it useful for analyzing solid samples that cannot be easily prepared for transmission or ATR [1]. Various reflection methods exist, including specular reflection for reflective surfaces and diffuse reflection (DRIFTS) for scattered light measurements from surfaces like soils or catalysts [1].
For field portability, ATR has emerged as the dominant sampling technique due to its robustness, minimal sample preparation, and ability to handle a wide variety of sample types without modification.
Key Characteristics for Field Deployment
Performance Metrics in Field Conditions
Portable IR spectrometers are characterized by specific performance metrics that determine their effectiveness in field applications. Unlike laboratory systems, field instruments must maintain performance while contending with environmental challenges including temperature variations, physical shock, vibration, and weather conditions.
The limit of detection (LOD) represents a critical performance characteristic, especially for detecting low concentrations of target analytes in complex mixtures. Experimental data from cocaine detection studies demonstrates that portable IR spectroscopy can identify cocaine HCl in mixtures with adulterants at concentrations as low as 25% for common cutting agents including mannitol, caffeine, and baby formula [4]. This detection capability proves sufficient for analyzing typical street samples, where cocaine purity often ranges from approximately 60% at importation levels down to about 30% at retail levels [4].
Spectral resolution determines the instrument's ability to distinguish between closely spaced absorption peaks, which is crucial for identifying similar compounds or mixtures. While portable systems typically offer slightly lower resolution than high-end laboratory instruments, modern field-portable FTIR systems provide sufficient resolution for most identification tasks, with many systems capable of 4-8 cm⁻¹ resolution.
Analysis speed represents another critical field characteristic, with modern portable systems capable of identifying materials in under a minute [2]. This rapid analysis enables real-time decision making in emergent situations where delayed analysis could impact public safety or operational outcomes [2].
Ruggedization and Usability Features
Engineering portable IR systems for field use requires addressing challenges not encountered in laboratory environments. As Dr. Christopher Brown of 908 Devices explains, "Making it small isn't good enough in its own right. Once it's small and carried around by hand, it's prone to damage. It will be dropped and exposed to harsh temperatures, issues that don't apply to lab systems" [2].
Successful field instruments incorporate:
- Shock and vibration isolation to maintain optical alignment and component integrity
- Temperature resilience for operation in varying environmental conditions
- Simplified user interfaces designed for operation by non-scientist personnel
- Built-in automation and intelligence that replicates the decision-making typically performed by trained scientists [2]
These usability enhancements transform sophisticated analytical instruments into "answer boxes" that provide definitive identification with minimal operator training or expertise [2]. The software components incorporate advanced algorithms to handle complex data interpretation challenges, such as identifying target compounds within complex mixtures or environmental backgrounds [2].
Experimental Comparison: Portable IR vs. Alternative Techniques
Experimental Protocol for Field Instrument Evaluation
A comprehensive study comparing portable IR spectroscopy with alternative field techniques established a rigorous experimental protocol for evaluating on-scene drug analysis methods [4]. The research assessed performance characteristics including limit of detection, specificity (false positives/negatives), ease of use, analysis speed, required operator skill, and destructive nature.
The experimental design utilized:
- Sample Preparation: Two-component mixtures were created using pure cocaine HCl with five adulterants: lidocaine, mannitol, caffeine, Sweet 'N Low artificial sweetener, and Enfragrow powdered baby formula [4]. Samples with concentrations of 0.1, 0.5, 1, 5, 10, 25, and 50% by mass of cocaine HCl were prepared, with additional samples at 35% and 15% concentrations prepared for more precise limit of detection determination [4].
- Instrumentation: The study compared the Smiths Detection HazMatID Elite portable IR spectrometer with diamond ATR sampling against a Smiths Detection ACE-ID portable Raman spectrometer and color-based Narcotics Identification Kit (NIK) Test G [4].
- Analysis Criteria: For spectroscopic methods, a positive identification was recorded when the instrument library search function provided a "hit" for cocaine HCl. For color tests, positive results followed the prescribed color change sequence specified by the manufacturer [4].
Comparative Performance Data
Table 1: Performance Comparison of Field Drug Testing Techniques
| Performance Characteristic | Portable IR Spectroscopy | Portable Raman Spectroscopy | Color-Based Field Tests |
|---|---|---|---|
| Limit of Detection | 25% cocaine HCl with common adulterants [4] | Variable; higher for fluorescing compounds [4] | 10% cocaine HCl [4] |
| False Positive Rate | Minimal [4] | Minimal [4] | High (73 known interferents) [4] |
| Analysis Time | Under 1 minute [2] | Minutes | Few minutes per test [4] |
| Sample Preparation | Minimal (ATR) [1] | Minimal | Required sampling [4] |
| Destructive to Sample | No (ATR) [1] | No | Yes [4] |
| Ease of Use | Simple operation with automated interpretation [2] | Moderate | Simple but subjective [4] |
| Adulterant Interference | Less severe [4] | More severe [4] | Significant false positives [4] |
| Cost per Analysis | Higher initial investment | Higher initial investment | $2-5 per test [4] |
Table 2: Direct Comparison: Portable IR vs. Portable Raman Spectroscopy
| Characteristic | Portable IR Spectroscopy | Portable Raman Spectroscopy |
|---|---|---|
| Excitation Source | Infrared light | Laser light |
| Molecular Information | Molecular vibrations and dipole moments | Molecular vibrations and polarizability |
| Fluorescence Interference | Not affected | Significant issue with colored samples, heroin, additives [4] |
| Sampling Technique | Primarily ATR | Direct illumination through glass containers |
| Water Compatibility | Affected by water absorption bands | Less affected by water |
| Limit of Detection | Generally lower for organic compounds [4] | Higher for fluorescing compounds [4] |
| Field Deployment | Better for most drug identification [4] | Limited by fluorescence issues [4] |
The experimental data demonstrates that portable IR spectroscopy provides superior performance compared to color-based tests, despite higher initial instrumentation costs. The minimal false positive rate is particularly significant in forensic applications, where erroneous color tests have led to wrongful incarcerations [4]. When compared directly with portable Raman spectroscopy, IR exhibits advantages for drug identification due to fewer issues with fluorescence interference, which particularly affects common drugs like heroin and various additives [4].
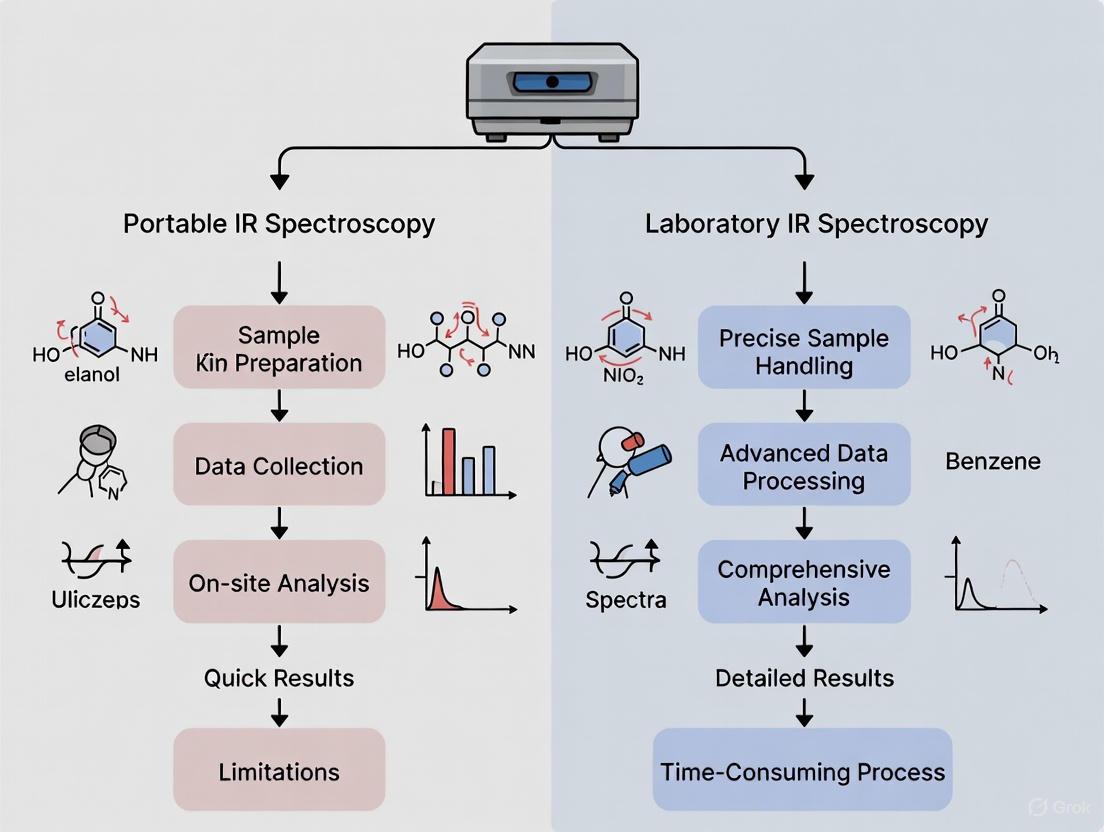
Diagram 1: Portable IR Spectroscopy Field Workflow. This diagram illustrates the streamlined process for sample analysis using ATR sampling technique in field conditions.
The Researcher's Toolkit: Essential Equipment and Reagents
Table 3: Essential Research Reagent Solutions for Portable IR Spectroscopy
| Item | Function | Application Notes |
|---|---|---|
| ATR Cleaning Solvents | Remove sample residue from crystal surface | High-purity methanol, ethanol, or isopropanol; compatible with specific crystal material [1] |
| Validation Standards | Instrument performance verification | Polystyrene films or certified reference materials for wavelength accuracy checks |
| Sample Collection Tools | Collect and handle field samples | Stainless steel spatulas, forceps; avoid contamination between samples |
| Diamond ATR Crystal | Sample interface for measurement | Diamond provides durability for field use; chemical inertness preserves sample integrity [1] |
| Portable IR Spectrometer | Primary analysis instrument | Ruggedized design, shock/vibration isolation, temperature stability [2] |
| Spectral Library | Reference database for compound identification | Customizable to include target compounds; verified reference spectra [4] |
| Battery Power System | Field operation power source | Extended-life batteries for all-day operation; vehicle charging capability |
| Calibration Reference | Ensure measurement accuracy | Sealed reference sample for periodic field validation |
The fundamental components of portable IR spectroscopy leverage the interaction between infrared light and molecular vibrations. The technology specifically probes the mid-infrared region (MIR), where fundamental molecular vibrations occur, providing distinctive spectral fingerprints for chemical identification [1]. The key technological elements include:
- IR Source: Emits broadband infrared radiation covering the spectral range of interest
- Interferometer: Creates an interference pattern containing information about all infrared frequencies simultaneously [1]
- Sample Interface: Typically an ATR crystal enabling minimal sample preparation [1]
- Detector: Measures the interferogram signal after interaction with the sample
- Processing Unit: Applies Fourier Transform algorithm to convert raw data into interpretable spectra [1]
Portable IR spectroscopy represents a mature field analysis technology that balances laboratory-grade performance with field-deployable practicality. The defining characteristics—rugged construction, simplified operation, rapid analysis, and non-destructive sampling—make it particularly valuable for applications requiring on-site chemical identification. While the initial investment exceeds traditional color tests, the superior accuracy and minimal false positive rates provide significant operational advantages, particularly in forensic and pharmaceutical field testing.
For researchers and drug development professionals, portable IR spectroscopy offers a viable alternative to laboratory-based systems when field deployment is necessary. The technology continues to evolve with ongoing improvements in detection limits, data interpretation automation, and further miniaturization [2]. As the field detection landscape changes with emerging substances of concern, portable IR spectroscopy remains well-positioned to adapt to new analytical challenges, providing reliable chemical identification when and where it is needed most.
Laboratory IR Spectroscopy Explained: High-Precision Analysis in Controlled Environments
Infrared (IR) spectroscopy is a foundational technique for elucidating molecular structure through the interaction of infrared light with matter. In the controlled setting of a laboratory, this method achieves a level of precision, accuracy, and comprehensive data quality that is difficult to replicate with portable instruments. This guide details the core principles, performance characteristics, and experimental protocols that define high-precision laboratory IR spectroscopy, providing a benchmark for its comparison with portable alternatives in field detection research.
The Core Principles of Laboratory IR Spectroscopy
At its heart, IR spectroscopy functions by measuring the absorption of infrared light by chemical bonds in a molecule. When the frequency of the IR light matches the natural vibrational frequency of a bond, energy is absorbed, and this absorption is recorded as a spectrum.
The entire process is governed by fundamental physical principles. The harmonic oscillator model describes the vibrational motion of bonds, akin to masses connected by a spring. The key equation derived from this model directly correlates the spectral peak position (in wavenumbers, cm⁻¹) to molecular structure [5]:
W = (1 / (2πc)) * √(k / MR)
Where:
- W = Peak wavenumber position (cm⁻¹)
- c = Speed of light
- k = Force constant of the bond (a measure of bond strength)
- MR = Reduced mass of the atoms involved in the vibration
This equation reveals that peak positions are determined by molecular structure: stronger bonds (higher k) and lighter atoms (lower MR) result in peaks at higher wavenumbers [5]. Furthermore, the intensity (height) of a peak is related to the concentration of the absorbing species and the change in the bond's dipole moment during vibration, as described by Beer's Law (A = εlc) [5].
The following diagram illustrates the logical workflow and key relationships involved in obtaining and interpreting an IR spectrum in a laboratory setting.
Performance Comparison: Laboratory vs. Portable IR Spectroscopy
The controlled environment and sophisticated engineering of laboratory instruments lead to distinct performance advantages. The table below summarizes a direct comparison based on experimental data.
Table 1: Performance Comparison of Laboratory Benchtop vs. Portable IR Spectrometers
| Performance Characteristic | Laboratory Benchtop FT-NIRS | Portable Short-Wave NIRS | Experimental Context & Citation |
|---|---|---|---|
| Spectral Range | 1000 - 2500 nm (wider range) | 740 - 1070 nm (limited range) | Analysis of citric acid-adulterated lime juice [6]. |
| Wavenumber Accuracy | Within 1.1 cm⁻¹ at 4 cm⁻¹ resolution | Not specified, generally lower | Measured using polystyrene and acetaminophen standards [7]. |
| Detection Accuracy | 94% (PLS-DA model)98% (SIMCA model) | 94% (PLS-DA model)94.5% (SIMCA model) | Discrimination of genuine vs. adulterated lime juice samples [6]. |
| Key Discriminatory Wavelengths | 1100 - 1400 nm & 1550 - 1900 nm | 950 - 1050 nm | Critical wavelengths for identifying adulteration in lime juice [6]. |
| Typical Initial Cost | High (e.g., ~$30,000 for a benchtop MIR) [8] | Low-cost to moderate (<$2,500 for portable NIR) [8] | Market survey of spectroscopic devices. |
Beyond the direct comparison, laboratory systems excel in applications requiring the highest levels of certainty. For instance, they are the gold standard for pharmaceutical quality control and are indispensable in research for characterizing new compounds, where their high resolution and sensitivity are critical [9] [10].
Key Experimental Protocols in the Laboratory
To illustrate the application of laboratory IR spectroscopy, here are detailed methodologies from published research.
Protocol for Detecting Food Adulteration
Aim: To discriminate between genuine and citric acid-adulterated lime juice using a benchtop Fourier-Transform NIR (FT-NIR) spectrometer [6].
Materials & Methods:
- Instrumentation: Buchi N-500 FT-NIR spectrometer with an InGaAs detector.
- Spectral Acquisition: Diffuse reflectance spectra were collected in triplicate for each sample across 4000 - 10,000 cm⁻¹ (1000 - 2500 nm) at a 4 cm⁻¹ resolution.
- Sample Presentation: Homogenized lime juice samples were placed in a round glass cuvette with a 2 mm path length.
- Data Preprocessing: Spectra were converted to absorbance units. Chemometric techniques applied included:
- Standard Normal Variate (SNV) or Multiplicative Scatter Correction (MSC) to reduce scattering effects.
- Principal Component Analysis (PCA) for exploratory data analysis and outlier detection.
- Partial Least Squares Discriminant Analysis (PLS-DA) and Soft Independent Modeling of Class Analogy (SIMCA) to build classification models.
Conclusion: The laboratory FT-NIR system, combined with robust chemometric models, achieved a 98% success rate in correctly identifying adulterated samples, demonstrating its power for authenticating food products [6].
Protocol for Pharmaceutical Analysis
Aim: To quantify the Active Pharmaceutical Ingredient (API) in simulated solid dosage forms (tablets) [8].
Materials & Methods:
- Instrumentation: A laboratory-grade FT-IR or high-performance benchtop NIR spectrometer.
- Sample Preparation: Binary powder mixtures of API (e.g., antimalarial or antiretroviral drugs) and common excipients (e.g., microcrystalline cellulose) were prepared with known concentration gradients (e.g., 0-100% API). Powders were mixed for a minimum of 3 minutes to ensure homogeneity. For some tests, tablets were pressed from these powders.
- Spectral Acquisition: Diffuse reflectance spectra were collected for both loose powders and intact tablets.
- Data Analysis: Univariate and Multivariate regression models (e.g., PLS-R) were built to correlate spectral data with the known API concentration.
Conclusion: Laboratory-grade NIRS was able to quantify API strength within a margin of 2.5% (w/w), meeting the required accuracy for pharmaceutical quality assurance standards [8].
The Scientist's Toolkit: Essential Reagents & Materials
A high-precision IR laboratory is equipped with specialized materials and reagents to ensure analytical integrity.
Table 2: Essential Research Reagent Solutions for Laboratory IR Spectroscopy
| Item | Function & Importance |
|---|---|
| Ultrapure Water System (e.g., Milli-Q) | Provides solvent water free of organic contaminants that could interfere with spectral analysis [9]. |
| HPLC-Grade Solvents | High-purity solvents for sample preparation and cleaning to avoid introducing spectral artifacts [6]. |
| Internal Standards (e.g., d4-Citric Acid) | Used in quantitative LC-MS/MS methods to validate sample nature and verify IR findings [6]. |
| Certified Reference Materials | Essential for instrument calibration, method validation, and ensuring quantitative accuracy [7]. |
| ATR Crystals (Diamond, ZnSe) | Durable, chemically inert crystals for Attenuated Total Reflectance sampling, allowing direct analysis of solids and liquids with minimal preparation [4]. |
Laboratory IR spectroscopy remains the undisputed reference for applications where results must be unimpeachable. Its high spectral resolution, wavenumber accuracy, and compatibility with a wide range of standardized sampling accessories make it indispensable for pharmaceutical quality control, fundamental research, and forensic analysis. While portable spectrometers offer remarkable capabilities for rapid, on-site screening, the data they produce is often most authoritative when validated against the gold-standard performance of a laboratory instrument. The choice between them is not a matter of superiority, but of selecting the right tool based on the required balance between precision and portability.
In the realm of analytical science, the ability to accurately identify and quantify substances is paramount across industries ranging from pharmaceuticals and forensics to environmental monitoring. For decades, Fourier Transform Infrared (FT-IR) spectroscopy has been the cornerstone laboratory technique for detailed molecular fingerprinting. The emergence of Near-Infrared (NIR) spectroscopy and the subsequent development of handheld devices for both technologies have fundamentally reshaped the analytical landscape, moving powerful analysis from the controlled lab directly to the sample. This guide provides an objective, data-driven comparison of these core technologies, framed within the critical context of selecting the appropriate tool for field-based detection research. Understanding the distinct capabilities, performance boundaries, and practical implementation requirements of FT-IR, NIR, and their portable counterparts is essential for researchers, scientists, and drug development professionals aiming to optimize their analytical strategies.
Fundamental Principles and Comparative Specifications
At their core, both FT-IR and NIR are vibrational spectroscopy techniques, but they probe different regions of the infrared spectrum, leading to distinct applications and performance characteristics.
FT-IR Spectroscopy: FT-IR operates primarily in the mid-infrared (MIR) region, typically from 4000 to 400 cm⁻¹ [11]. It provides spectra that are rich in fundamental molecular vibration information, resulting in sharp, well-defined absorption bands. This makes FT-IR exceptionally powerful for molecular fingerprinting and identifying unknown materials by matching their unique spectral patterns to reference libraries [11] [12]. The "Fourier Transform" refers to the mathematical process used to convert the raw interferogram signal into a recognizable spectrum, which allows for higher signal-to-noise ratios and faster scan times compared to older dispersive IR instruments.
NIR Spectroscopy: NIR spectroscopy utilizes the near-infrared region, from approximately 780 to 2500 nanometers [11]. NIR spectra consist of broad, overlapping absorption bands that are primarily overtone and combination bands of fundamental C-H, O-H, and N-H vibrations [11]. While this makes NIR spectra less intuitive to interpret visually, the technique is highly amenable to chemometric analysis (e.g., PCA, PLS) for quantitative modeling and classification [13]. The nature of NIR light allows for deep penetration into samples and minimal sample preparation.
Core Technical Specifications
The table below summarizes the key technical differences between the two technologies, particularly highlighting the portable formats most relevant for field detection.
Table 1: Core Technical Specifications of FT-IR and NIR Spectroscopy
| Feature | FT-IR (Lab & Portable) | NIR (Portable Focus) |
|---|---|---|
| Spectral Range | Mid-IR (4000 - 400 cm⁻¹) [11] | Near-IR (780 - 2500 nm) [11] |
| Spectral Information | Fundamental vibrations; sharp, distinct peaks for specific functional groups [11] | Overtone and combination bands; broad, overlapping peaks [11] |
| Primary Strength | Qualitative identification, molecular fingerprinting, structural analysis [11] [12] | Rapid quantitative analysis, classification, process monitoring [11] |
| Sample Preparation | Often required for lab systems; minimal for portable ATR [14] | Typically minimal to none; non-destructive [11] |
| Typical Analysis Speed | Seconds to minutes | Seconds or less [11] |
| Data Analysis | Library searching, functional group analysis | Requires chemometrics (e.g., PLS, SVM) for quantitative work [13] [15] |
| Penetration Depth | Shallow (micrometers with ATR) | Deeper (millimeters) |
Experimental Performance Data in Key Applications
The theoretical differences between FT-IR and NIR translate into measurable performance variations in real-world applications. The following experimental data provides a quantitative basis for comparison.
Field Detection of Illicit Drugs
The decentralized analysis of controlled substances is a critical application for portable spectroscopy. A 2024 study evaluated a portable NIR device (MicroNIR) for analyzing illicit drugs seized in Australia, using laboratory methods for confirmation [13].
Table 2: Performance of Portable NIR in Illicit Drug Identification [13]
| Drug Substance | Identification Accuracy | Sensitivity |
|---|---|---|
| Crystalline Methamphetamine HCl | 98.4% | 96.6% |
| Cocaine HCl | 97.5% | 93.5% |
| Heroin HCl | 99.2% | 91.3% |
The study concluded that the NIR technology, supported by robust infrastructure, provided accurate results in real-time with clear operational applications for frontline policing [13]. Quantification was also highly accurate, with 99% of NIR-predicted values falling within ±15% of the reference laboratory uncertainty [13].
A comparative study from 2018 highlighted the performance of portable IR (FT-IR) spectroscopy for the on-scene analysis of cocaine HCl, directly comparing it to portable Raman spectrometers and traditional color-based tests [4]. The study found that portable IR spectrometers offered high-performance characteristics, including ease of use, rapid analysis, non-destructive capability, and minimal false positives and negatives [4]. It was determined that portable IR spectroscopy had a lower limit of detection and less severe interference from adulterants compared to portable Raman, making it a superior tool for this application [4].
Material Identification and Quality Control
In pharmaceutical and material science, both techniques are well-established. A 2025 review underscores FT-IR's pivotal role in quality control and Process Analytical Technology (PAT), particularly for monitoring protein formulations and biopharmaceuticals during manufacturing [16]. Its ability to analyze very high concentration protein solutions (~200 mg/ml) without dilution is a significant advantage [16].
NIR's strength in this domain is its speed and minimal preparation. As noted in the comparative analysis, NIR is "ideal for scenarios requiring immediate insights" and is "revolutionizing quality control processes" in pharmaceuticals [11].
Experimental Protocols for Field-Ready Analysis
For researchers to replicate or design studies using these technologies, understanding the standard experimental workflow is crucial.
- Sample Collection & Integrity: Collect seized drug specimens. For solid samples, ensure they are homogeneous. No further preparation is required.
- Instrument Calibration: Ensure the portable NIR spectrometer (e.g., Viavi MicroNIR) is calibrated according to manufacturer specifications.
- Spectral Acquisition: Place the spectrometer probe in direct contact with the sample or use a reflectance accessory. Acquire spectra typically as an average of multiple scans to improve the signal-to-noise ratio.
- Chemometric Model Application: Process the acquired spectrum using a pre-validated chemometric model (e.g., based on Partial Least Squares - Discriminant Analysis or PLS-R for quantification). The model must be built from a database of chemically relevant and representative specimens.
- Result Interpretation: The model outputs an identification (e.g., "Cocaine HCl") and/or a quantification value (e.g., "78% purity"). Results can be acted upon in real-time.
- Surface Inspection: Visually identify the area of interest on the material (e.g., composite, metal).
- Interface Selection: Choose the appropriate sampling interface. For reflective surfaces, use an external reflectance interface. For softer or non-reflective surfaces (paints, polymers), use a diamond internal reflectance (ATR) interface.
- Spectral Acquisition: Place the handheld FT-IR spectrometer's sampling interface firmly and directly onto the analysis site. Initiate the scan. The instrument's internal battery allows for untethered operation.
- Spectral Matching & Analysis: The instrument software automatically compares the collected spectrum against a curated library. For quantitative measures (e.g., level of oxidation), a pre-loaded quantitative method is applied.
- Data Reporting: Results, such as contaminant identification or a pass/fail status, are displayed on the device screen and can be saved or transmitted.
Technology Selection Workflow
The following diagram illustrates the decision-making process for selecting the appropriate core technology based on analytical goals and operational constraints.
The Scientist's Toolkit: Essential Research Reagent Solutions
Successful implementation of these spectroscopic technologies, especially in field research, relies on more than just the spectrometer. The following table details key ancillary materials and solutions.
Table 3: Essential Research Reagents and Materials for Field Spectroscopy
| Item/Solution | Function in Research & Analysis |
|---|---|
| ATR Diamond Crystals | The sampling interface for handheld FT-IR, allowing for minimal sample preparation and direct analysis of solids and liquids [14]. |
| Validated Chemometric Models | Machine learning algorithms (e.g., PLS, SVM) essential for translating complex NIR spectra into quantitative and qualitative results [13] [15]. |
| Certified Reference Materials | High-purity compounds used to calibrate instruments and build/validate identification libraries and quantitative models [17]. |
| Portable Instrument Calibration Kits | Rugged, stable materials used for wavelength and photometric validation of handheld devices in the field to ensure data integrity. |
| Curated Spectral Libraries | Databases of known material spectra that are essential for the library-matching identification algorithms used by FT-IR [12]. |
The choice between FT-IR, NIR, and their handheld implementations is not a question of which technology is universally superior, but which is optimal for a specific analytical challenge within the context of field detection research.
FT-IR spectroscopy, particularly in handheld format, is the unequivocal choice when the analytical requirement is definitive identification and molecular fingerprinting of unknown materials, contaminants, or for verifying chemical structure [11] [14]. Its strength lies in providing detailed, information-rich spectra that can be directly matched to reference libraries.
NIR spectroscopy excels in environments that demand speed, non-invasiveness, and quantitative precision [11]. Its unparalleled capability for real-time decision-making, supported by robust chemometric models, makes it ideal for high-throughput screening, classification, and monitoring dynamic processes in the field [13].
For the modern researcher, the "portable versus laboratory" debate is increasingly being won by the practical advantages of bringing the spectrometer to the sample. The advent of high-performance handheld devices has decentralized the analytical laboratory, providing actionable data with lab-grade accuracy precisely when and where it is needed most. As these technologies continue to evolve with enhanced integration of machine learning and more rugged, user-friendly designs, their role in empowering researchers and accelerating drug development and field-based scientific discovery will only become more profound.
Practical Deployments: Key Applications of Portable and Lab IR in Biomedicine
Pharmaceutical Quality Assurance and Detection of Substandard/Falsified Drugs
The global threat of substandard and falsified (SF) drugs represents a critical public health challenge, particularly in low- and middle-income countries where approximately 10.5% of medicines are estimated to be spurious compared to only 3% in high-income countries [18]. These illegitimate medical products range from those containing no active pharmaceutical ingredient (API) to those with incorrect dosage, harmful impurities, or fraudulent packaging. The World Health Organization classifies them into three categories: substandard (authorized but failing quality specifications), unregistered/unlicensed (unauthorized by relevant authorities), and falsified (deliberately fraudulent in identity, composition, or source) [18]. Infrared (IR) spectroscopy has emerged as a powerful analytical technique to combat this problem, providing chemical fingerprinting capabilities that can identify authentic drugs and detect counterfeits efficiently. This guide objectively compares the implementation of this technology in two distinct formats: traditional laboratory instruments and modern portable systems for field detection research.
IR Spectroscopy Fundamentals and Technological Formats
IR Spectroscopy Principles
Infrared spectroscopy operates on the principle that molecules absorb specific frequencies of infrared light that correspond to their vibrational modes [1]. When IR radiation interacts with a pharmaceutical sample, chemical bonds within the molecules absorb energy at characteristic frequencies, creating a unique spectral fingerprint that can identify the substance and quantify its components [1]. The mid-infrared (MIR) region (approximately 4000-400 cm⁻¹) is particularly valuable for pharmaceutical analysis because it contains fundamental vibrational transitions that provide distinct, well-resolved spectral features for most APIs and excipients [1] [18].
Fourier Transform Infrared (FTIR) spectroscopy has largely replaced traditional dispersive IR instruments due to significant advantages in speed, sensitivity, and optical throughput [19]. FTIR utilizes an interferometer to simultaneously measure all infrared frequencies, followed by a Fourier Transform mathematical processing to decode the signal into a conventional spectrum [19] [1]. This results in faster acquisition times with superior signal-to-noise ratios compared to dispersive technologies [19].
Attenuated Total Reflection (ATR) Sampling
Attenuated Total Reflection (ATR) has become the predominant sampling technique for pharmaceutical analysis by IR spectroscopy [1]. ATR enables direct analysis of solid dosage forms with minimal sample preparation by measuring the interaction between IR light and a sample placed in contact with a high-refractive-index crystal [1]. The light penetrates only a few microns into the sample (typically 0.5-5 µm), making it particularly suitable for analyzing tablet surfaces [18]. Diamond ATR crystals offer exceptional chemical resistance and durability, ideal for routine quality control applications [1] [18].
Table 1: Comparison of IR Spectroscopy Sampling Techniques
| Technique | Sample Preparation | Analysis Time | Destructive | Primary Applications |
|---|---|---|---|---|
| ATR | Minimal (direct tablet placement) | <2 minutes | Non-destructive | Routine quality control, counterfeit screening |
| Transmission | Extensive (grinding, KBr pelleting) | 10-15 minutes | Destructive | Reference methods, research |
| Diffuse Reflectance | Moderate (powder presentation) | 5-10 minutes | Non-destructive | Powder analysis, content uniformity |
Laboratory vs. Portable IR Spectroscopy: Technical Comparison
Benchtop Laboratory Systems
Traditional benchtop FTIR spectrometers represent the gold standard for pharmaceutical analysis in controlled laboratory environments. These systems offer uncompromised performance with high spectral resolution (typically ≤4 cm⁻¹), exceptional signal-to-noise ratios, and extensive accessory compatibility [20]. The stationary nature of these instruments provides exceptional stability for long-term monitoring studies and regulatory compliance applications.
Laboratory systems are particularly suited for method development, structural elucidation, and quantitative analysis requiring the highest precision [1]. Their sophisticated optical systems and temperature-stabilized detectors provide the measurement reproducibility necessary for pharmaceutical quality control in regulated environments, where performance qualification (PQ) tests must be conducted regularly to maintain compliance with pharmacopeial standards [20].
Portable Handheld Systems
Portable FTIR spectrometers bring laboratory-grade analytical capabilities to field settings where pharmaceutical quality assessments are needed most [21] [14]. Modern handheld instruments, such as the Agilent 4300 Handheld FTIR and Bruker MOBILE-IR II, incorporate ruggedized designs (often with IP65 protection against dust and water jets), internal batteries for off-grid operation, and intuitive software interfaces suitable for non-specialist operators [22] [21].
These systems implement the same fundamental FTIR technology as laboratory instruments but in miniaturized, environmentally robust packages. Key advancements include permanently aligned optics that withstand vibration and shock, temperature-stable interferometers, and interchangeable sampling interfaces that maintain optical alignment when switching between measurement modes [14]. The Agilent 4300 system, for example, enables users to transition between samples with no alignment adjustments simply by changing the sampling interface [21].
Table 2: Performance Comparison of Benchtop vs. Portable FTIR Systems
| Parameter | Benchtop Laboratory FTIR | Portable Handheld FTIR |
|---|---|---|
| Spectral Range | Full MIR (typically 4000-400 cm⁻¹) | Full MIR (typically 4000-650 cm⁻¹) |
| Resolution | ≤0.5 cm⁻¹ to 4 cm⁻¹ (user-selectable) | Typically 2-8 cm⁻¹ (fixed) |
| Signal-to-Noise Ratio | >40,000:1 (1-minute acquisition) | 5,000-15,000:1 (varying with measurement time) |
| Detector Type | Liquid N₂-cooled MCT or DTGS | Thermoelectrically-cooled MCT or DTGS |
| Sampling Accessories | Extensive range (ATR, transmission, reflectance) | Limited to integrated interfaces (often ATR) |
| Operational Environment | Laboratory conditions (controlled temperature/humidity) | Field conditions (-10°C to 40°C, 0-95% RH) |
| Regulatory Compliance | Full compliance with 21 CFR Part 11, GMP/GLP | Varies by manufacturer; increasingly compliant |
| Typical Cost | $50,000 - $150,000 | $25,000 - $60,000 |
Experimental Data and Performance Validation
Experimental Protocol for Pharmaceutical Screening
A validated experimental approach for detecting SF pharmaceuticals using ATR-FTIR spectroscopy involves the following methodology, adapted from published research [18]:
Sample Collection: Obtain representative samples from the supply chain, including authentic reference materials from manufacturers and suspect samples from field sites.
Spectral Acquisition:
- Use consistent pressure application for ATR contact
- Collect spectra over 4000-650 cm⁻¹ range
- Employ 4 cm⁻¹ resolution with 32-64 scans per measurement
- Maintain consistent environmental conditions (temperature, humidity)
- Include background scans before each sample or every 15-30 minutes
Data Processing:
- Apply ATR correction algorithms to compensate for penetration depth variations
- Perform vector normalization or standard normal variate (SNV) transformation
- Employ second derivatives (Savitzky-Golay, 13-21 points) to enhance spectral features
Multivariate Analysis:
- Develop classification models using principal component analysis (PCA)
- Implement partial least squares discriminant analysis (PLS-DA) or soft independent modeling of class analogies (SIMCA)
- Validate models with independent test sets using cross-validation techniques
Performance Validation Study
Research evaluating ATR-FTIR for antibiotic authentication demonstrates the effectiveness of this approach. One comprehensive study analyzed 27 different antibiotics comprising 56 pharmaceutical brands and 481 total samples [18]. The methodology achieved 99.6% accuracy in classifying authentic versus falsified products using a multivariate classification approach [18].
The minute spectral differences between generic versions of the same antibiotic were successfully resolved, highlighting the technique's sensitivity to formulation variations. The model correctly identified substandard samples with incorrect excipient ratios and detected falsified products with wrong APIs through distinct spectral fingerprints in the 1800-600 cm⁻¹ region [18].
Diagram 1: Experimental workflow for pharmaceutical authentication using IR spectroscopy
Field Deployment and Practical Implementation
Application in Supply Chain Monitoring
Portable FTIR systems offer particular advantages for monitoring pharmaceutical quality at various points in the supply chain, including:
- Manufacturing facilities: Raw material identification and in-process quality checks [23]
- Distribution warehouses: Rapid screening of incoming and outgoing shipments [22]
- Pharmacies and healthcare facilities: Verification of product authenticity before dispensing [23] [18]
- Border checkpoints: High-throughput screening of imported pharmaceutical products [24]
The methodology enables rapid analysis with results available in under 2 minutes, compared to hours or days required for laboratory-based chromatography methods [18]. This accelerated timeline allows for immediate intervention when SF products are detected, potentially preventing their distribution to patients.
Economic Considerations
The economic argument for portable IR spectroscopy in pharmaceutical quality surveillance is compelling. While traditional laboratory analysis requires significant infrastructure investment (dedicated space, climate control, trained personnel) and involves substantial per-test costs, portable systems offer a fundamentally different economic profile [23]. Handheld FTIR instruments provide lower upfront costs (typically 40-60% less than benchtop systems), minimal maintenance requirements, and operational independence from laboratory infrastructure [23] [14].
Table 3: The Scientist's Toolkit: Essential Materials for Pharmaceutical IR Analysis
| Item | Function | Application Notes |
|---|---|---|
| Portable FTIR Spectrometer | Field-based spectral acquisition | Diamond ATR interface preferred for pharmaceutical solids |
| Authentic Reference Standards | Spectral library development | Obtain directly from manufacturers with documentation |
| Portable Computer/Tablet | Data collection and analysis | Ruggedized, IP65-rated for field use |
| Multivariate Analysis Software | Spectral processing and classification | PCA, PLS-DA, SIMCA algorithms essential |
| Sample Collection Kit | Proper handling of evidence | Vials, gloves, documentation materials |
| Portable Printer | Generation of analysis reports | Battery-powered for field documentation |
| Stabilization Platform | Steady surface for measurements | Critical for reproducible ATR contact |
Integrated Strategy and Future Directions
Complementary Implementation Framework
Rather than positioning portable and laboratory IR systems as competing alternatives, an integrated approach leverages the unique strengths of each technology. A tiered analytical strategy provides optimal resource allocation:
Primary Field Screening: Portable FTIR instruments conduct rapid assessment of large numbers of samples at point of collection, providing immediate pass/fail results.
Secondary Laboratory Confirmation: Suspect samples identified in field screening undergo comprehensive analysis using benchtop FTIR systems with advanced sampling accessories and higher resolution capabilities.
Tertiary Advanced Characterization: Samples confirmed as substandard or falsified proceed to orthogonal analytical techniques (HPLC, MS) for definitive characterization of impurities and degradation products.
Diagram 2: Tiered analytical strategy for comprehensive pharmaceutical quality assessment
Emerging Technological Trends
The field of portable spectroscopy continues to evolve with several promising developments:
Enhanced Connectivity: Cloud-based spectral libraries and real-time data sharing capabilities enable immediate comparison against centralized databases during field operations [23].
Artificial Intelligence Integration: Machine learning algorithms improve pattern recognition for detecting increasingly sophisticated counterfeits that display only subtle spectral variations [23].
Multi-Technology Platforms: Hybrid instruments combining FTIR with complementary techniques like Raman spectroscopy or X-ray fluorescence provide orthogonal verification in a single device [3].
Miniaturization Advancements: Ongoing development of micro-electromechanical systems (MEMS) and quantum cascade lasers promises further reductions in instrument size and cost while maintaining analytical performance [3].
The portable spectrometer market reflects this trajectory, projected to grow from $1.68 billion in 2020 to $4.07 billion by 2030, indicating increasing adoption across multiple sectors including pharmaceutical quality assurance [3].
Both benchtop and portable IR spectroscopy systems offer distinct advantages for pharmaceutical quality assurance and detection of substandard and falsified drugs. Benchtop systems remain the gold standard for method development, regulatory compliance, and research applications requiring the highest sensitivity and precision. Portable instruments provide unprecedented capabilities for field-based screening, supply chain monitoring, and rapid decision-making at the point of need. The most effective anti-counterfeiting strategies will leverage both technologies in a complementary framework, with portable systems enabling widespread surveillance and laboratory instruments providing definitive confirmation. As portable FTIR technology continues to advance, these field-deployable tools will play an increasingly vital role in global efforts to ensure pharmaceutical quality and patient safety.
Fourier-transform infrared (FT-IR) spectroscopy has emerged as a revolutionary analytical technique in clinical and biomedical research, enabling rapid, non-destructive analysis of biological samples. This universal optical sensing technique provides highly specific spectral "fingerprints" that reveal valuable information about the chemical composition and molecular structure of biological materials, including biofluids, tissues, and cells [25]. The current diagnostic landscape for autoimmune diseases, infectious diseases, and various pathologies primarily relies on patient history, physical examination, and laboratory tests that often require complex procedures and trained personnel [25] [26]. However, FT-IR spectroscopy, particularly when enhanced by advanced chemometric methods, offers a promising alternative that is rapid, simple, eco-friendly, and requires minimal reagents, substantially reducing testing costs [25].
A significant development in this field is the ongoing transition from traditional benchtop spectrometers to portable handheld devices, moving analytical capabilities from centralized laboratories directly to point-of-care settings. While benchtop systems have established the gold standard for spectral resolution and accuracy in controlled environments, technological advancements are rapidly bridging the performance gap with portable units [27]. This comparison guide objectively examines the performance characteristics, applications, and technical considerations of both approaches within the context of clinical and biomedical analysis, providing researchers and drug development professionals with evidence-based insights for selecting appropriate spectroscopic tools for field detection and diagnostic research.
Performance Comparison: Portable vs. Benchtop IR Spectroscopy
Direct comparative studies provide the most valuable insights for researchers evaluating spectrometer configurations. A 2023 study specifically compared the effectiveness of a handheld FTIR unit (Agilent 4300 Handheld) with a benchtop system (Perkin Elmer Spectrum 100 ATR-IR) for detecting Staphylococcus epidermidis in human bone grafts, offering concrete performance data [27].
Table 1: Direct Performance Comparison of Handheld and Benchtop FTIR Systems
| Parameter | Agilent 4300 Handheld FTIR | Perkin Elmer Spectrum 100 ATR-IR |
|---|---|---|
| Spectral Range | 4000 to 650 cm⁻¹ | 4000 to 650 cm⁻¹ |
| Spectral Resolution | 2 cm⁻¹ | 0.5 cm⁻¹ |
| Scanning Procedure | 8 scans per sample | 8 scans per sample from three positions |
| Key Finding | Successfully detected loss in bone quality due to infection | Successfully detected loss in bone quality due to infection |
| Statistical Analysis | Principal Component Analysis (PCA) showed significant results | Principal Component Analysis (PCA) showed significant results |
| Sample Throughput | Suitable for on-site analysis | Requires sample transport to laboratory |
| Infrastructure | Battery-powered, minimal space requirements | Requires dedicated lab space and power |
The study demonstrated that despite the benchtop system's superior spectral resolution (0.5 cm⁻¹ versus 2 cm⁻¹), both instruments yielded significant results in detecting infection-related biochemical changes in bone tissue when using appropriate data analysis strategies [27]. This indicates that for many diagnostic applications, the lower resolution of handheld devices remains sufficient to generate clinically useful data.
Table 2: General Characteristics and Application Suitability
| Feature | Portable/Handheld IR Spectrometers | Benchtop IR Spectrometers |
|---|---|---|
| Primary Advantage | On-site analysis, point-of-care testing | High spectral resolution and accuracy |
| Typical Resolution | 2-8 cm⁻¹ | 0.5-4 cm⁻¹ |
| Sample Preparation | Minimal, often none | May require specific preparation |
| Cost Structure | Lower upfront cost, reduced maintenance | High initial investment, maintenance fees |
| Operator Skill | Minimal training required | Requires skilled operators |
| Environmental Robustness | Rugged design, IP ratings available (e.g., IP65) | Designed for controlled laboratory settings |
| Data Management | Cloud-based software, mobile integration | Laboratory information management systems |
| Ideal Use Case | Field deployment, screening, supplier sites | Research validation, quantitative analysis |
Portable NIR and IR solutions provide distinct benefits in today's fast-paced clinical environments, offering flexibility for real-time measurements at point-of-care, production floors, or supplier sites [23]. Their cost efficiency, with lower upfront costs and reduced maintenance, delivers a clear return on investment, while their ease of use with intuitive interfaces enables teams to conduct high-quality analyses quickly with minimal training [23].
Experimental Protocols and Methodologies
Protocol for Infectious Disease Detection in Bone Grafts
The study comparing handheld and benchtop FTIR for detecting Staphylococcus epidermidis in bone grafts followed a meticulous experimental protocol [27]:
- Sample Collection and Preparation: Femoral heads were obtained from patients undergoing hip replacement surgery. Bone chips (3–5 mm in diameter) were extracted from spongious tissue using a bone mill. A total of 40 human bone samples were examined (30 non-infected, 10 infected).
- Biofilm Development: Staphylococcus epidermidis ATCC 12228 was cultured in Mueller-Hinton broth at 37°C for 24 hours. The inoculum was diluted to 10⁶ CFU/mL, and 200 µL of the suspension was added to wells containing bone allografts. Plates were incubated at 37°C for 48 hours to form biofilms. After incubation, samples were washed with PBS to remove planktonic bacteria and dried in an aspirator (3.2 kPa) for 10 minutes at room temperature.
- Spectral Acquisition: For the benchtop system (Perkin Elmer Spectrum 100), spectra were collected from three positions per sample with a resolution of 0.5 cm⁻¹ across 4000-650 cm⁻¹. For the handheld device (Agilent 4300 Handheld FTIR), spectra were collected with a resolution of 2 cm⁻¹ across the same spectral range. Both instruments utilized 8 scans per measurement.
- Data Analysis: The acquired spectral information was used for spectral and unsupervised classification, specifically principal component analysis (PCA), to differentiate between infected and non-infected samples.
This protocol successfully demonstrated that both instruments could detect a loss in bone quality due to infection, highlighting the utility of MIR spectroscopy as a valuable diagnostic tool when tissue is scarce and time is critical [27].
Protocol for COVID-19 Diagnosis Using ATR-FTIR Spectroscopy
A 2021 proof-of-concept study investigated ATR-FTIR spectroscopy with machine learning to predict COVID-19 positive samples, providing another robust methodological framework [26]:
- Sample Collection: The study included oropharyngeal swab suspension fluid samples from 243 patients from two Brazilian states, transported using different viral transport mediums.
- Spectral Acquisition: ATR-FTIR spectra were collected from the swab suspension fluids. The method is label-free and requires minimal sample preparation.
- Data Processing and Modeling: Second derivative spectra were used to calculate partial least squares (PLS) components for differentiation. A classification model based on PLS associated with cosine k-nearest neighbors (KNN) was built.
- Performance Metrics: The model achieved 84% and 87% sensitivity, 66% and 64% specificity, and 76.9% and 78.4% accuracy for the two different transport mediums, respectively.
This methodology underscores the potential of FT-IR spectroscopy as a simple, label-free, cost-effective solution for high-throughput screening of suspect patients in healthcare centers and emergency departments [26].
Figure 1: FT-IR Spectroscopy Diagnostic Workflow for Infection Detection. This workflow outlines the key steps from sample preparation to diagnostic output, as implemented in the bone graft and COVID-19 studies [26] [27].
The Scientist's Toolkit: Essential Research Reagent Solutions
Successful implementation of IR spectroscopy in clinical and biomedical research requires specific materials and analytical approaches. The following table details key research reagent solutions and their functions in spectroscopic analyses.
Table 3: Essential Research Reagent Solutions for IR Spectroscopy in Biomedicine
| Reagent/Solution | Function in Research | Application Example |
|---|---|---|
| Mueller-Hinton Broth | Culture medium for biofilm development | Culturing Staphylococcus epidermidis for bone graft infection studies [27] |
| Phosphate Buffered Saline (PBS) | Washing buffer to remove planktonic bacteria | Preparing bacterial biofilm samples for FT-IR analysis [27] |
| Viral Transport Medium | Preserves viability of viruses during transport | COVID-19 sample collection and storage for ATR-FTIR analysis [26] |
| Chemometric Software (PCA, PLS, KNN) | Mathematical tools for spectral data analysis | Developing classification models for disease diagnosis [26] [25] |
| ATR Crystals (Diamond) | Sampling interface for minimal preparation | Analyzing biofluids, tissues, and cells in ATR-FTIR mode [22] [28] |
| Biofluid Collection Kits | Standardized sample acquisition | Collecting blood, saliva, or urine for diagnostic spectroscopy [28] |
Technological Advancements and Integration with Artificial Intelligence
The field of infrared spectroscopy is rapidly evolving through technological miniaturization and integration with artificial intelligence. Portable IR spectrometers now incorporate features such as thermoelectrically cooled MCT detectors (eliminating the need for liquid nitrogen), heatable ATR crystals for practical flexibility, and robust designs with IP65 protection for harsh environments [22]. Internal batteries enable operation independent of infrastructure, while cloud-based software and mobile interfaces enhance data accessibility and remote analysis capabilities [23] [22].
The convergence of spectroscopic technologies with artificial intelligence and machine learning represents a particularly transformative development. AI-assisted detection of biomarkers combines portable, user-friendly devices with sophisticated data processing, revolutionizing diagnostic practices through continuous real-time analysis [29]. This integration enhances diagnostic accuracy and reduces reliance on traditional laboratory settings, enabling the transition from reactive healthcare to predictive and personalized medicine. The combination of polymic patient signatures (metabolomic, proteomic, genomic, and transcriptomic) with pathological and clinical data helps determine optimal biomarker levels, training future sensor technologies based on AI for clinically significant and personalized output data [29].
Figure 2: AI-Enhanced Portable Spectroscopy System Architecture. Modern portable spectrometers integrate rugged hardware with cloud-based data processing and machine learning algorithms to deliver real-time diagnostic capabilities [23] [22] [29].
The comparative analysis of portable and benchtop IR spectroscopy systems reveals a dynamic technological landscape with complementary strengths. Benchtop systems continue to offer superior spectral resolution and remain valuable for research validation and quantitative analysis in controlled laboratory settings. However, portable handheld spectrometers have demonstrated remarkable capabilities for on-site analysis, with performance characteristics sufficient for many clinical applications including infectious disease detection, bone quality assessment, and rapid screening for conditions like COVID-19.
The integration of FT-IR spectroscopy with artificial intelligence and machine learning represents a paradigm shift in biomedical analysis, enabling the development of robust classification models for disease diagnosis with sensitivity and specificity metrics comparable to conventional methods. As portable spectrometers become increasingly sophisticated, with enhanced connectivity, ruggedized designs, and user-friendly interfaces, their implementation in point-of-care settings, field research, and decentralized healthcare models is poised to expand significantly. This technological evolution, combined with the technique's inherent advantages of minimal sample preparation, rapid analysis, and cost-effectiveness, positions IR spectroscopy as an increasingly indispensable tool in the researcher's arsenal for clinical and biomedical analysis.
Material Identification and Verification in Drug Development
In the field of drug development, the accurate identification and verification of raw materials and active pharmaceutical ingredients (APIs) are fundamental to ensuring product safety, efficacy, and quality control. For decades, this critical task has been dominated by traditional laboratory-based infrared (IR) spectroscopy, a trusted technique for molecular characterization [30]. However, a significant shift is underway. The advent of portable IR spectrometers is moving analysis from the central laboratory directly to the point of need—be it the warehouse, production floor, or supplier site [23].
This guide provides an objective comparison between portable and laboratory IR spectroscopy, framing them as complementary tools within a modern analytical strategy. We will compare their performance characteristics, detail experimental protocols for their evaluation, and discuss their respective roles in enhancing efficiency and decision-making in pharmaceutical research and development.
Technology Comparison: Portable vs. Laboratory IR Spectroscopy
The core distinction between these systems lies in their design philosophy. Laboratory FT-IR systems are engineered for maximum performance: high resolution, superior sensitivity, and versatility for a wide range of complex applications. They are the undisputed reference standard. In contrast, portable IR systems prioritize accessibility, speed, and convenience, offering good analytical performance in a compact, on-the-go format [23] [31].
Table 1: Key Technical and Operational Characteristics
| Characteristic | Laboratory FT-IR Spectrometer | Portable IR Spectrometer (e.g., IR-ATR with PLAD) |
|---|---|---|
| Technology Basis | Fourier Transform Interferometer | Often pyroelectric detector array (PLAD) with linear variable filter (LVF) [31] |
| Typical Resolution | Can be < 1 cm⁻¹ (e.g., 4 cm⁻¹ common) [20] | Limited and variable, ~10–30 cm⁻¹ [31] |
| Spectral Range | Full Mid-IR (e.g., 4000-400 cm⁻¹) | Tailored windows (e.g., specific ATR spectral ranges) [31] |
| Sensitivity (LOD) | Very High (ideal for trace analysis) | Good, but generally higher than FT-IR |
| Sample Throughput | Lower (requires transport to lab) | Very High (on-the-spot analysis) [23] |
| Operational Cost | High (initial investment, maintenance, skilled operator) | Lower (affordable upfront cost, reduced maintenance) [23] |
| Space Requirements | Dedicated lab bench space | Compact and lightweight; no dedicated space needed [23] |
| Primary Use Case | Regulatory compliance, R&D, quantitative analysis of complex mixtures | Rapid screening, raw material identification, field verification [23] [30] |
A 2023 study directly compared a portable IR-ATR spectrometer using a pyroelectric detector array to a conventional laboratory FT-IR system for applications relevant to food and pharma, such as analyzing solvents and contaminants. The findings confirmed that while the portable system has a lower spectral resolution, its predictive performance for specific parameters can match that of the FT-IR, making it suitable for many quantitative screening applications [31].
Experimental Performance Data and Validation
To make an informed choice, researchers must understand how these instruments perform in real-world pharmaceutical scenarios. The following experimental data highlights their capabilities and limitations.
Raw Material Identification and Quantification
A key application is the identification of APIs and excipients. A study screening 926 pharmaceutical and dietary supplement products using a toolkit that included a portable FT-IR demonstrated the power of portable devices. The toolkit successfully identified over 650 APIs with high reliability. Critically, when an API was identified by two or more devices in the toolkit, the results were highly reliable and comparable to those from full-service laboratories, with 119 out of 124 positive items correctly identified [28].
For quantification, the performance can be benchmarked using common solvents. The table below summarizes data from a model study comparing a portable IR-ATR system to an FT-IR for quantifying N,N-Dimethylformamide (DMF) [31].
Table 2: Quantitative Performance for DMF in Water
| Instrument Type | Concentration Range (g/L) | Linearity (R²) | Limit of Detection (LOD) |
|---|---|---|---|
| Laboratory FT-IR | 10 - 100 | > 0.99 | Lower |
| Portable IR-ATR | 10 - 100 | > 0.99 | Higher than FT-IR |
| Laboratory FT-IR | 100 - 1000 | > 0.99 | Lower |
| Portable IR-ATR | 100 - 1000 | > 0.99 | Higher than FT-IR |
Detection of Adulterants and Counterfeit Drugs
Portable spectrometers are powerful tools for combating counterfeit drugs. Research has shown that portable NIR and IR solutions can effectively detect adulterants like sibutramine and phenolphthalein in weight-loss herbal medicines. Using spectral preprocessing, the models achieved a coefficient of determination (R²) greater than 0.93, demonstrating high accuracy for on-site screening [32]. This capability allows for rapid checks at distribution centers and pharmacies without shipping samples to a lab [23].
Performance Qualification in Regulated Environments
In regulated laboratories, performance qualification (PQ) is essential to ensure instruments remain fit for purpose. For laboratory IR systems, this involves regular tests for parameters like wavenumber accuracy, resolution, and signal-to-noise ratio (S/N) using reference materials like polystyrene films [20]. The U.S. and European pharmacopoeias have differing requirements, particularly for resolution, which must be carefully considered during method validation [20].
For portable instruments, a PQ strategy must be established that demonstrates their performance is suitable for their intended use, such as raw material verification. This often involves testing against a set of known standards to verify identification accuracy before use.
Essential Workflows and Methodologies
The application of IR spectroscopy, whether with portable or lab-based systems, relies on robust experimental and data analysis workflows.
Workflow for Material Verification
The following diagram illustrates a logical workflow for material identification and verification that integrates both portable and laboratory instruments, leveraging the strengths of each.
Protocol for Quantitative Model Development
For quantitative analysis (e.g., determining API concentration or detecting adulterants), both benchtop and portable systems rely on chemometrics. The following is a generalized protocol for developing a predictive model [32] [31]:
- Sample Set Preparation: Prepare a calibration set of samples with known concentrations of the analyte, spanning the expected range. For a portable device, ensure the sample presentation (e.g., ATR crystal pressure) is consistent.
- Spectral Acquisition: Collect spectra for all calibration samples using the IR spectrometer. For portable devices, ensure the measurement conditions (e.g., temperature, humidity) are representative of the intended use environment.
- Spectral Preprocessing: Process the raw spectra to remove non-chemical variances (e.g., light scattering, baseline offset). Common techniques include:
- Standard Normal Variate (SNV)
- Multiplicative Scatter Correction (MSC)
- Savitzky-Golay Derivatives (1st or 2nd derivative)
- Variable Selection (Optional but Recommended): Identify the most informative spectral regions to improve model robustness. Methods include interval Partial Least Squares (iPLS) and Genetic Algorithms (GA). This is more common for NIR data [32].
- Model Calibration: Develop a multivariate regression model, typically Partial Least Squares (PLS), linking the preprocessed spectra to the known concentrations.
- Model Validation: Test the model on an independent set of validation samples not used in calibration. Evaluate using Root Mean Square Error of Prediction (RMSEP) and the Coefficient of Determination (R²).
The Scientist's Toolkit: Key Research Reagent Solutions
Successful implementation of IR spectroscopy in drug development relies on more than just the spectrometer. The following table details essential materials and their functions.
Table 3: Essential Materials for IR Analysis in Drug Development
| Item | Function & Importance |
|---|---|
| Certified Reference Materials (CRMs) | For instrument performance qualification (PQ) and method validation. Polystyrene films are commonly used for wavenumber verification [20]. |
| ATR Cleaning Solvents | High-purity solvents (e.g., methanol, ethanol) for cleaning the ATR crystal between samples to prevent cross-contamination [31]. |
| Chemometrics Software | Essential for quantitative analysis and complex classification tasks. Enables spectral preprocessing, model development, and sample prediction [32]. |
| Spectral Databases | Libraries of verified API and excipient spectra for rapid identification and verification of raw materials [30]. |
| Stable Calibration Samples | Samples with known, stable concentrations of target analytes for periodic checking of quantitative model performance over time. |
The Future: AI and Advanced Data Analysis
The future of IR spectroscopy, both portable and laboratory-based, is being shaped by artificial intelligence (AI). Recent research has demonstrated that Transformer-based AI models can now elucidate molecular structures directly from IR spectra with remarkable accuracy, achieving a Top-1 accuracy of 63.79% [33]. This AI-driven approach is overcoming traditional limitations in interpreting complex spectral data, particularly in the fingerprint region. For drug development, this could accelerate the identification of unknown impurities, degradation products, and novel compounds, transforming IR from a verification tool into a more powerful discovery tool.
The choice between portable and laboratory IR spectroscopy is not a matter of declaring one superior, but of selecting the right tool for the specific task within the drug development pipeline.
- Portable IR spectrometers excel as tools for rapid screening and decentralized decision-making. Their value lies in speed, cost-effectiveness, and the ability to provide immediate answers at the point of need, such as for raw material verification in a warehouse or quick checks on the production floor [23].
- Laboratory FT-IR systems remain the unmatched reference for definitive analysis. They are indispensable for method development, regulatory compliance, quantitative analysis requiring the highest sensitivity, and advanced research applications [20] [30].
A modern, efficient quality control strategy leverages the strengths of both. By using portable devices for high-volume, time-sensitive screening and reserving laboratory resources for complex, non-routine, or definitive analyses, drug development professionals can achieve new levels of efficiency, agility, and quality assurance.
On-Site Environmental Monitoring and Sample Screening
The demand for rapid, on-site analysis has grown significantly across various scientific fields, including environmental monitoring, food safety, and pharmaceutical development. This guide provides an objective comparison between portable and laboratory-based infrared (IR) spectroscopy, two instrumental approaches with distinct advantages and operational paradigms. Portable IR spectrometers bring the laboratory to the sample, offering immediacy and mobility, whereas benchtop systems, typically based on Fourier-transform infrared (FT-IR) technology, provide high-resolution analysis in a controlled environment [34]. The choice between these approaches is not a matter of which is universally better, but which is more suitable for specific application requirements, constraints, and analytical goals [34]. This article compares their performance using published experimental data, details standard methodologies for evaluation, and provides a framework for selecting the appropriate tool for field detection research.
Performance Comparison: Portable vs. Laboratory IR Spectroscopy
Direct performance comparisons between portable and laboratory IR systems reveal a trade-off between analytical rigor and operational flexibility. The following tables summarize key performance characteristics and application-based findings from experimental studies.
Table 1: General Performance Characteristics of Portable vs. Laboratory IR Spectroscopy
| Performance Characteristic | Portable IR Spectroscopy | Laboratory Benchtop FT-IR |
|---|---|---|
| Analytical Accuracy | Good, but may not match lab-grade precision [34] [31]. | High accuracy and precision in a controlled environment [31]. |
| Spectral Resolution | Limited and potentially variable (e.g., 10–30 cm⁻¹) [31]. | High and consistent resolution [31]. |
| Sensitivity (LOD) | Suitable for many field applications; may be higher than portable Raman for certain drugs [4]. | Generally superior, detecting lower analyte concentrations [4]. |
| Sample Throughput | High; enables rapid, on-the-spot decision-making [34]. | Slower due to sample transport and preparation logistics [34]. |
| Operational Cost | Lower upfront cost; eliminates sample transport fees [34]. | High initial investment and ongoing operational costs [34]. |
| Environmental Ruggedness | Designed for field use in various environments [34]. | Requires a stable, controlled laboratory setting [34]. |
| Ease of Use | Designed for use by non-scientist personnel [4]. | Requires trained technicians and experts [34]. |
Table 2: Experimental Performance in Specific Applications
| Application Domain | Experimental Findings | Implication for Technique Selection |
|---|---|---|
| Food Adulteration (Lime Juice) | Portable SW-NIRS (740-1070 nm) and benchtop FT-NIRS (1000-2500 nm) showed similar classification accuracy (~94%) for detecting citric acid adulteration when coupled with PLS-DA [6]. | Portable NIRS is a viable screening tool for supply chain checks, while benchtop systems may be preferred for confirmatory analysis. |
| Pharmaceutical Analysis | Handheld NIR and Raman devices are effective for verifying genuine medicines through primary packaging, though their performance depends on the embedded algorithm and instrument quality [35]. | Handheld devices are excellent for rapid screening against spectral libraries at the point of care, but may struggle with highly complex mixtures. |
| Cocaine HCl Detection | Portable IR spectroscopy demonstrated a lower limit of detection and less severe adulterant interference compared to portable Raman spectroscopy [4]. | Portable IR is better suited for on-scene drug analysis, particularly for substances like heroin that can cause fluorescence in Raman. |
| Quantitative Food Analysis | A compact IR-ATR system showed comparable predictive performance to an FT-IR for quantifying parameters like oil oxidation, despite its lower spectral resolution [31]. | For many quantitative tasks where high resolution is not critical, portable systems can deliver results comparable to laboratory instruments. |
Experimental Protocols for Method Validation
To ensure reliable results from a portable IR device, researchers should follow standardized experimental protocols. The following workflow outlines a general method for developing and validating a quantitative application, such as detecting adulterants in food.
Sample Collection and Preparation
A sufficient number of samples representing both the target material and potential adulterants or variations are required to build a robust model. For a study on lime juice adulteration, researchers collected 16 authentic lime fruit samples and 28 pre-identified adulterated samples [6]. Samples must be homogenized to ensure spectral consistency; this is often done using an ultra-turrax homogenizer before analysis [6]. For solid powders (e.g., cocaine with adulterants), samples are prepared by mixing pure analyte with common cutting agents (e.g., lidocaine, mannitol, caffeine) in specific mass percentages (e.g., 0.1% to 50%) to create a calibration curve [4].
Reference Analysis
For quantitative methods or to confirm the nature of samples, a primary reference method is essential. In the lime juice study, the citric acid to iso-citric acid ratio in all samples was determined in triplicate using a validated liquid chromatography-tandem mass spectrometry (LC-MS/MS) method [6]. This provides the ground truth data against which the IR spectral data is calibrated.
Spectral Acquisition
Spectral collection must be consistent and well-documented. For a benchtop FT-NIR spectrometer, typical parameters include [6]:
- Spectral Range: 1000 - 2500 nm (4000 - 10,000 cm⁻¹)
- Scanning Resolution: e.g., 4 cm⁻¹
- Number of Scans: Triplicate per sample
- Measurement Mode: Diffuse reflectance with a fixed pathlength cuvette (e.g., 2 mm)
Portable devices are operated according to manufacturer guidelines, often with a direct contact probe for solids and liquids.
Data Preprocessing and Chemometric Modeling
Raw spectral data is preprocessed to remove physical artifacts and enhance chemical information [6] [35]. Common techniques include:
- Standard Normal Variate (SNV): Corrects for scatter and path length differences.
- Multiplicative Scatter Correction (MSC): Similar to SNV, addresses scaling and offset effects.
- Derivatives (1st or 2nd): Resolve overlapping peaks and remove baseline drift.
After preprocessing, chemometric models are built:
- Principal Component Analysis (PCA): An unsupervised method for exploring data and detecting outliers [6].
- Partial Least Squares-Discriminant Analysis (PLS-DA): A discriminant model for classifying samples (e.g., genuine vs. adulterated) [6].
- Soft Independent Modeling of Class Analogy (SIMCA): A class-modeling technique that creates a model for a single class (e.g., "genuine" product), which is more rigorous for authenticity purposes [35].
Model Validation
The final model must be validated to assess its predictive power on new, unknown samples. This is typically done by splitting the data into a training set (e.g., 70-80% of samples) to build the model and a test set (the remaining 20-30%) to evaluate it [6]. Performance is reported using metrics such as accuracy, sensitivity, and specificity.
The Scientist's Toolkit: Essential Research Reagent Solutions
Successful implementation of IR methods, both in the lab and in the field, relies on a set of key reagents, standards, and computational tools.
Table 3: Key Reagents, Standards, and Software for IR-Based Analysis
| Item | Function/Description | Example in Application |
|---|---|---|
| Chemical Standards | High-purity analytes and adulterants for creating calibration models. | Pure Cocaine HCl, lidocaine, mannitol, caffeine for drug mixture studies [4]. |
| Organic Solvents | HPLC or analytical grade solvents for sample preparation, extraction, and cleaning. | Methanol, ethanol, and water for preparing calibration solutions of mycotoxins and fatty acids [31]. |
| Internal Standards | Deuterated or otherwise tagged compounds for use with reference methods. | Citric acid-2,2,4,4-d4 for precise LC-MS/MS quantification of citric acid in lime juice [6]. |
| Chemometrics Software | Software packages for preprocessing spectral data and building classification/quantification models. | Use of PLS-DA and SIMCA for discriminating genuine and falsified pharmaceutical tablets [35]. |
| Spectral Libraries | Curated databases of reference spectra for compound identification. | On-board library search functions in portable instruments for identifying controlled substances like cocaine [4]. |
Decision Workflow: Selecting the Right Tool for Your Research
Choosing between portable and laboratory IR spectroscopy depends on the specific analytical problem. The following decision pathway can guide researchers in selecting the most appropriate technique.
The comparative analysis of portable and laboratory IR spectroscopy demonstrates that both are indispensable tools in the modern analytical arsenal. Portable IR spectrometers offer a powerful solution for on-site environmental monitoring and sample screening, providing rapid, cost-effective, and reasonably accurate results that enable immediate decision-making in the field [34]. Their performance in applications like food adulteration detection and pharmaceutical verification is often sufficient for screening purposes [6] [35]. Conversely, laboratory-based FT-IR systems remain the gold standard for applications demanding the highest possible accuracy, sensitivity, and spectral resolution, serving as a crucial platform for confirmatory analysis and method development [31]. The decision between the two should be guided by a clear understanding of the analytical requirements, weighing factors such as needed precision, operational constraints, and the ultimate purpose of the data. As portable technology continues to advance, the performance gap is likely to narrow further, expanding the frontiers of what is possible in on-site analysis.
Overcoming Challenges: Strategies for Optimizing Field and Lab Performance
Mitigating Environmental and Operational Limitations of Portable Devices
The evolution of infrared (IR) spectroscopy has ushered in a new era for field detection research, marked by the transition from traditional laboratory benchtops to portable and handheld devices. This shift brings unparalleled flexibility for on-site analysis in diverse sectors, including pharmaceuticals, environmental monitoring, and food safety [23]. However, this portability comes with a unique set of environmental and operational challenges that can impact the reliability and accuracy of data collection. For researchers and drug development professionals, understanding these limitations and the strategies to mitigate them is crucial for integrating portable IR spectroscopy into robust field-deployable methods. This guide objectively compares the performance of portable and laboratory IR systems, supported by experimental data and detailed protocols, to equip scientists with the knowledge to effectively leverage portable technology.
Performance Comparison: Portable vs. Laboratory IR Spectroscopy
The choice between portable and laboratory IR systems involves trade-offs between analytical performance and operational flexibility. The following table summarizes a direct comparison based on key parameters critical for field detection research.
Table 1: Performance and Operational Comparison of Portable vs. Laboratory IR Spectrometers
| Feature | Portable/Handheld IR Spectrometers | Laboratory Benchtop IR Spectrometers |
|---|---|---|
| Primary Advantage | Portability, on-site analysis, real-time decision-making [23] | High performance, reliability, and accuracy [23] |
| Typical Accuracy | Now achieving parity with benchtop systems for many applications [23] | High accuracy; the traditional benchmark |
| Analysis Environment | Field, production floor, supplier sites [23] | Controlled laboratory settings |
| Sensitivity & Resolution | Can be lower due to miniaturized components; technology is rapidly improving [9] | Generally higher and more consistent |
| Sample Throughput | Designed for rapid, individual measurements on-site | Optimized for high-throughput, automated analysis of multiple samples |
| Upfront Cost | Lower initial investment [23] | High initial cost, often with hidden maintenance fees [23] |
| Operational Cost | Lower maintenance and operational costs [23] | Requires skilled operators, increasing overhead [23] |
| Space Requirements | Compact and lightweight; no dedicated lab space needed [23] | Stationary, bulky, and requires significant lab space [23] |
| Ease of Use | Intuitive interfaces, minimal training required [23] | Often requires skilled operators, slowing processes [23] |
| Data Management | Increasingly cloud-based for remote access and analysis [23] | Typically relies on local, PC-based software systems |
| Vulnerability to Environment | High (temperature, humidity, vibration) [14] | Low (stable, controlled lab environment) |
Key Limitations of Portable Devices and Mitigation Strategies
While portable IR spectrometers are transformative, their effective use requires acknowledging and addressing their inherent constraints, particularly in challenging field conditions.
Environmental Limitations
Portable instruments are designed to be used outside the controlled laboratory, making them susceptible to environmental variables that can affect the sample, the instrument itself, and the resulting spectral data.
- Temperature and Humidity Fluctuations: Variations in ambient temperature can cause drift in the instrument's calibration and alter the physical state of the sample. High humidity can lead to water vapor absorption in the spectrum, particularly problematic in the NIR and MIR regions, obscuring important sample peaks [14].
- Vibration and Physical Orientation: Field applications may expose the device to vibrations from industrial settings or uneven terrain. Furthermore, unlike benchtop systems that remain stationary, a handheld spectrometer must deliver stable performance regardless of its physical orientation [14].
Mitigation Strategies:
- Environmental Buffering: Allow the instrument and samples to acclimate to the field environment for a stable period before analysis when possible.
- Built-In Environmental Monitoring: Use instruments that log ambient temperature and humidity, allowing analysts to flag data collected outside predefined acceptable ranges.
- Robust Instrument Design: Select devices specifically designed to be rugged, insensitive to vibration, and capable of consistent performance in any physical orientation [14].
Operational Limitations
Operational challenges relate to the practical use of the device in the field and the management of the data it produces.
- Power Dependency: Portable devices rely on battery power, which limits operational time and can be a critical failure point in extended field campaigns.
- Reduced Sensitivity and Resolution: The miniaturization of optical components can sometimes result in lower sensitivity and spectral resolution compared to high-end benchtop systems, potentially affecting the detection of trace-level analytes or the differentiation of complex mixtures [9].
- Data Integrity and Management: The convenience of field data collection must be matched by robust data management practices to ensure integrity, traceability, and seamless transfer to laboratory information management systems (LIMS).
Mitigation Strategies:
- Power Management: Carry spare, fully charged batteries or portable power packs. Optimize instrument settings (e.g., scan number, resolution) to balance data quality with battery consumption.
- Advanced Chemometrics: Compensate for potential limitations in hardware by employing advanced data processing techniques. Chemometric methods like Principal Component Analysis (PCA) and Partial Least Squares (PLS) modeling can extract meaningful information from complex spectral data, enabling accurate classification and quantification [28].
- Cloud-Based Software and Connectivity: Utilize portable systems with integrated cloud-based software. This allows for real-time data upload, remote access to results, and integration with centralized data platforms, enhancing flexibility and data accessibility [23].
Experimental Protocols for Performance Validation
Validating the performance of a portable IR spectrometer against a laboratory standard is a critical step before deploying it for critical field research. The following protocols provide a framework for this comparison.
Protocol 1: Method Comparison for Material Identification
This experiment is designed to validate the qualitative identification capabilities of a portable device.
- Objective: To compare the identification accuracy of a portable IR spectrometer against a laboratory FT-IR for a set of known pharmaceutical raw materials.
- Materials:
- Procedure:
- a. Analyze each reference material in triplicate using the laboratory FT-IR system following a validated method.
- b. Analyze the same materials in triplicate using the portable IR spectrometer in a controlled lab environment.
- c. Analyze the materials again with the portable instrument in a simulated field environment (e.g., a warehouse with temperature variation).
- d. Collect all spectra and pre-process them (vector normalization, baseline correction).
- Data Analysis:
- For each instrument and condition, perform a spectral library search for each material and record the hit quality index (HQI).
- Calculate the percentage of correct identifications (HQI ≥ match threshold) for each system.
- Use PCA to visualize the clustering of the spectra from the different instruments and conditions.
- Expected Outcome: A successful validation will show >95% correct identification for the portable device in the controlled lab and >90% in the simulated field, with PCA demonstrating strong clustering between the portable and lab data for the same material [28].
Protocol 2: Quantitative Analysis Under Environmental Stress
This protocol tests the robustness of a portable NIR system for quantitative measurement under varying environmental conditions.
- Objective: To assess the impact of temperature fluctuations on the quantitative accuracy of a portable NIR spectrometer for determining moisture content in a powder.
- Materials:
- Portable NIR spectrometer (e.g., Metrohm OMNIS NIRS Analyzer) [9].
- Controlled climate chamber.
- Powder samples with a range of known moisture content (e.g., 2-10%), as determined by loss on drying (LOD).
- Procedure:
- a. Develop a PLS calibration model for moisture content using the portable NIR spectrometer at a stable 20°C.
- b. Place the instrument and samples in the climate chamber and set temperatures to 15°C, 20°C, 25°C, and 30°C. Allow for equilibration at each temperature.
- c. At each temperature, analyze the validation set of samples and use the 20°C calibration model to predict the moisture content.
- d. Record the predicted values and compare them to the known LOD values.
- Data Analysis:
- Calculate the Root Mean Square Error of Prediction (RMSEP) at each temperature.
- Plot RMSEP against temperature to visualize performance degradation.
- Statistically compare the predictions at each temperature to the reference values using a t-test.
- Expected Outcome: The study will quantify the increase in prediction error (RMSEP) as the temperature deviates from the calibration point, highlighting the need for temperature correction algorithms or robust calibration models that include environmental variation [3].
The Scientist's Toolkit: Essential Research Reagents and Materials
Table 2: Key Materials for Field-Based IR Spectroscopy Research
| Item | Function |
|---|---|
| Certified Reference Materials (CRMs) | Essential for on-the-go calibration verification and quality control of the portable instrument, ensuring data reliability [9]. |
| Portable Solid Standard Accessory | A durable, stable solid with a known spectrum (e.g., polystyrene) used for quick wavelength and photometric validation in the field. |
| Environmental Data Logger | Monitors and records ambient temperature and humidity during analysis, providing critical metadata for interpreting spectral results. |
| Robust Sample Presentation Kit | Includes durable ATR crystals, cleaning solvents, and pads for consistent and reproducible sample presentation with minimal preparation. |
| Cloud-Based Chemometrics Software | Enables real-time, on-site data processing, pattern recognition, and multivariate analysis, turning raw spectra into actionable information [23]. |
Workflow and Logical Relationships
The following diagram illustrates the decision-making workflow and strategic approach for deploying portable IR spectrometers in field research, from task definition to data acquisition, highlighting the critical mitigation steps for environmental and operational challenges.
Diagram 1: Field Deployment Workflow for Portable IR
Portable IR spectroscopy has firmly established itself as a powerful tool for field detection research, capable of achieving accuracy levels comparable to benchtop systems for a wide array of applications [23]. The limitations of these devices, primarily stemming from environmental exposure and operational constraints, are not insurmountable. They can be effectively mitigated through a combination of strategic planning, robust instrument design, advanced data analytics, and rigorous method validation against laboratory standards. For researchers in drug development and other fields, the ability to conduct rapid, on-site analysis with reliable results promises to accelerate workflows, enhance supply chain monitoring, and drive innovation. By understanding the comparative landscape and implementing the discussed protocols and strategies, scientists can confidently integrate portable IR devices into their research toolkit, pushing the boundaries of laboratory analysis into the field.
Addressing Sample Preparation and Throughput Challenges in Lab Settings
In the realm of chemical analysis, infrared (IR) spectroscopy stands as a pivotal technique for identifying molecular structures and compounds. Traditionally confined to controlled laboratory environments, this technology now extends into the field through portable systems, creating a critical decision point for researchers and drug development professionals. The core challenge lies in balancing analytical precision with operational practicality, particularly when addressing time-sensitive applications such as on-scene forensic analysis, continuous pharmaceutical manufacturing, and environmental monitoring.
This comparison guide objectively evaluates portable and laboratory IR spectroscopy systems, focusing specifically on their performance in overcoming two persistent laboratory challenges: sample preparation complexity and analytical throughput limitations. While laboratory Fourier-Transform Infrared (FTIR) spectrometers provide the benchmark for analytical performance with high resolution and sensitivity, portable IR and near-infrared (NIR) systems offer compelling advantages for rapid, on-site analysis with minimal sample preparation. The following analysis synthesizes experimental data to guide selection based on application-specific requirements, framing these technologies within the broader thesis of field detection research.
Technology Comparison: Operational Parameters and Performance
The fundamental differences between portable and laboratory-based systems create distinct operational profiles. Understanding these parameters is essential for appropriate technology selection.
Table 1: Key Operational Characteristics of IR Spectroscopy Technologies
| Feature | Portable FTIR | Portable NIR | Laboratory FTIR |
|---|---|---|---|
| Primary Use Case | On-scene identification of solids, liquids, and gases [4] [2] | Continuous process monitoring & uniformity testing [36] | Definitive identification & quantitative analysis [37] |
| Typical Sample Preparation | Minimal; often direct ATR contact [4] | Minimal; non-contact reflectance probes [36] | Variable; may require ATR, pellets, or liquid cells [37] |
| Analysis Speed | Seconds to minutes [4] [2] | Real-time, continuous [36] | Minutes to hours (incl. prep) [37] |
| Sensitivity/LOD | ~25% for cocaine in mixtures [4] | Nanomolar for specific compounds [38] | High; detects low-concentration analytes [37] |
| Spectral Range | Mid-infrared (MIR)[ccitation:7] | Near-infrared (780-2500 nm) [36] | Full range (MIR, sometimes NIR) [37] |
| Key Limitation | Lower sensitivity vs. lab systems [4] | Model-dependent for quantitative analysis [36] | Requires controlled lab environment [37] |
The data reveals a clear trade-off. Laboratory FTIR systems offer superior sensitivity and resolution, making them indispensable for definitive identification and research applications [37]. Conversely, portable systems excel in speed and operational flexibility, enabling analysis in non-laboratory settings with significantly less sample preparation [4] [36].
Experimental Performance Data in Key Applications
Controlled studies across different fields provide quantitative performance data, helping to contextualize the capabilities of each technology.
Forensic Substance Identification
A direct comparison of on-scene analysis methods for cocaine HCl identified significant performance differences [4]:
Table 2: Performance Comparison for Cocaine HCl Identification
| Method | Limit of Detection (in Mixtures) | False Positives | Analysis Time | Destructive |
|---|---|---|---|---|
| Color-Based Test (NIK) | 10% cocaine [4] | Many (e.g., lidocaine) [4] | A few minutes [4] | Yes [4] |
| Portable FTIR | 25% cocaine [4] | Minimal with library search [4] | Under a minute [4] | No [4] |
| Portable Raman | 1% cocaine [4] | Fluorescence interference [4] | Under a minute [4] | No [4] |
Experimental Protocol: Two-component mixtures of cocaine HCl with common adulterants (lidocaine, mannitol, caffeine, artificial sweetener, baby formula) were prepared at concentrations from 0.1% to 50% by mass. Each method was tested against these samples to determine its limit of detection (LOD) and susceptibility to interference [4].
While portable Raman showed a lower LOD, portable FTIR was less susceptible to fluorescence interference from common adulterants and drugs like heroin, making it a more robust choice for field use [4].
Continuous Pharmaceutical Manufacturing
Near-infrared (NIR) spectroscopy has been successfully implemented for online monitoring of continuous drug production, addressing significant throughput challenges. An experimental study on nifedipine production demonstrated the use of an online NIRS system with a partial least squares regression (PLSR) model to predict water content during the mixing process [36].
Experimental Protocol:
- Platform: A custom-built platform with a fixed NIRS instrument height and a sliding rail system for consistent spectral acquisition.
- Data Preprocessing: Spectra were preprocessed using Savitzky-Golay (S-G) smoothing combined with Standard Normal Variate (SNV) transformation to reduce scattering effects and noise [36].
- Uniformity Assessment: The Adaptive Moving Block Standard Deviation (AMBSD) method dynamically adjusted the analysis window size to adapt to changes in the mixing state, successfully monitoring blend homogeneity in real-time [36].
This application highlights how portable NIR systems can eliminate the throughput bottleneck created by offline sampling, providing real-time data for process control.
High-Throughput Soil Analysis
A study on grassland soils compared the cost-effectiveness of mid-infrared (MIR) spectroscopy to traditional elemental analysis for measuring soil organic carbon (SOC) and nitrogen (N) [39]. Using 1000 soil samples, researchers tested how the number of calibration samples affected the predictive accuracy of three models: Partial Least Squares (PLS), Random Forest (RF), and Support Vector Machine (SVM) [39].
Key Finding: The predictive accuracy of all three models was less affected by sample size variation when >400 calibration samples were used. The non-linear models (SVM and RF) performed similarly to the classical PLS model [39]. This demonstrates that MIR spectroscopy, coupled with robust calibration models, can serve as a high-throughput, low-cost alternative for analyzing large sample sets, such as those required for environmental monitoring or carbon sequestration projects.
Decision Framework and Experimental Design
Selecting the appropriate technology requires a systematic approach based on analytical requirements and operational constraints. The following workflow and decision matrix provide guidance for researchers.
Diagram 1: Technology Selection Workflow
Essential Research Reagent Solutions
The following table details key materials and their functions in IR spectroscopy experiments, particularly for field detection research.
Table 3: Essential Research Reagents and Materials for IR Spectroscopy
| Item | Function | Application Context |
|---|---|---|
| ATR Crystal (Diamond) | Enables direct sampling of solids/liquids without preparation [4] | Portable FTIR forensics; lab analysis |
| Savitzky-Golay Filter | Spectral preprocessing to reduce noise and enhance features [36] [39] | Data analysis for NIR & MIR |
| Partial Least Squares (PLS) | Multivariate calibration for quantitative analysis [36] [39] | Converting spectral data to concentrations |
| KBr Pellets | Traditional method for analyzing solid samples in transmission mode | Laboratory FTIR analysis |
| Standard Normal Variate (SNV) | Scatter correction technique for reflectance spectra [36] | NIR data preprocessing |
| Moving Block Standard Deviation | Algorithm for monitoring mixing uniformity in real-time [36] | Continuous pharmaceutical manufacturing |
The choice between portable and laboratory IR spectroscopy is not a matter of superior technology, but rather of appropriate application. For definitive identification, method development, and analyses demanding the highest sensitivity, laboratory FTIR remains the gold standard. However, for field applications requiring rapid results, continuous process monitoring, and situations where sample throughput is limited by preparation complexity, portable FTIR and NIR systems offer transformative advantages.
The evolving landscape of IR spectroscopy continues to blur the lines between laboratory and field analysis. As portable systems improve in sensitivity and data analysis algorithms become more sophisticated, the application envelope for on-site analysis will expand. Nevertheless, the fundamental trade-offs captured in this guide will continue to inform strategic decisions for researchers and drug development professionals seeking to optimize their analytical operations against the competing demands of precision, throughput, and practicality.
In forensic science and drug development, the shift from the laboratory to the field for substance identification places a premium on data integrity. Infrared (IR) spectroscopy is a pinnacle technique for forensic identification, but the interpretation of its data is notoriously challenging. IR spectra are a summation of contributions from various biomolecules and are susceptible to interfering physical effects like scattering, reflection, and interference, which manifest as baseline distortions and intensity changes [40]. These challenges necessitate robust chemometric protocols—the statistical and mathematical methods for extracting meaningful information from chemical data—to ensure that results are reliable, reproducible, and defensible. This guide objectively compares portable and laboratory Fourier-Transform Infrared (FTIR) spectrometers, focusing on the experimental data and best practices that underpin data integrity in field detection research.
Technology Comparison: Portable vs. Laboratory FTIR Spectrometry
Fundamental Principles and Key Differentiators
While all modern IR spectrometers typically use FTIR technology, which is faster and provides a better signal-to-noise ratio than historical dispersive instruments [19] [1], the implementation in portable and lab-based systems differs significantly. Laboratory benchtop systems, such as the Bruker Tensor 27, are designed for optimal performance in a controlled environment, often incorporating accessories like nitrogen-purged integrating spheres for highly accurate directional hemispherical reflectance (DHR) measurements [41]. In contrast, portable systems like the Agilent 4300 Handheld FTIR or the Bruker MOBILE-IR II are engineered for robustness. They feature rugged, sealed designs (e.g., IP65 protection), internal batteries, vibration damping, and shock resistance to withstand the rigors of field use [2] [22]. Their operational software is also streamlined for ease of use by non-scientists, functioning as an "answer box" with built-in automation for data collection and interpretation [2].
Performance Benchmarking: Experimental Data
A direct comparison under controlled laboratory conditions provides the clearest view of performance parity. A 2018 study benchmarked the portable Agilent 4300 (using Diffuse Reflectance Infrared Fourier Transform, DRIFT) against the laboratory-grade Bruker Tensor 27 (using both DRIFT and DHR) for the analysis of key soil properties [41].
Table 1: Performance Comparison of Portable and Laboratory FTIR Spectrometers [41]
| Performance Metric | Agilent 4300 Handheld (DRIFT) | Bruker Tensor 27 (DRIFT) | Bruker Tensor 27 (DHR) |
|---|---|---|---|
| Spectral Quality & Noise | Good, slightly higher noise | Good | Best, lowest noise |
| PLS Calibration Accuracy (for SOC, N, etc.) | As good as or slightly better than Bruker DRIFT | Good | Best |
| Key Spectral Regions (for SOC, N) | Good match with Bruker DHR | Good match with Bruker DHR | Reference standard |
| Primary Application | On-site and laboratory analysis | Laboratory analysis | High-accuracy laboratory analysis |
The study concluded that portable FTIR instruments are a viable alternative for mid-infrared measurements in the lab and offer great potential for on-site applications, with performance that can be comparable to benchtop systems [41].
For field applications, a study on cocaine analysis compared portable IR and Raman spectrometers against traditional color-based tests. Portable IR spectroscopy was determined to be superior to portable Raman for on-scene testing due to its lower limit of detection, less severe adulterant interferences, and its ability to avoid the fluorescence issues common with Raman when analyzing substances like heroin [4]. The high-stakes nature of this application underscores the importance of accuracy; color tests have led to false convictions, while portable vibrational spectroscopy provides a higher level of confirmation [4].
Best Practices for Ensuring Data Integrity
Analytical Instrument Qualification (AIQ) and Performance Verification
For regulated laboratories, maintaining data integrity begins with Analytical Instrument Qualification (AIQ). A core component of AIQ is Performance Qualification (PQ), which consists of ongoing tests to verify that an instrument continues to perform suitably for its intended use under actual operational conditions [20]. This is distinct from Operational Qualification (OQ), which demonstrates that the instrument meets predefined specifications in a controlled test environment.
The foundation of effective OQ and PQ is a User Requirements Specification (URS), a document that defines the laboratory's specific technical and operational needs [20]. Without a URS, any subsequent qualification testing is irrelevant. For FTIR instruments, typical PQ parameters include:
- Wavenumber Accuracy: Verified using a certified polystyrene film traceable to national standards [20].
- Resolution: A requirement in some pharmacopeias like the European Pharmacopoeia, though methods differ between dispersive and FTIR instruments, causing historical confusion [20].
- Signal-to-Noise Ratio (S/N): Critical for detecting low-concentration analytes and ensuring spectral clarity [20] [37].
Spectral Pre-processing and Data Modeling Workflow
Raw IR spectra are contaminated with unwanted signals, making sophisticated pre-processing and data modeling indispensable for accurate interpretation [40]. The following workflow diagram illustrates the critical steps for transforming raw spectral data into a reliable, actionable result.
Pre-processing Protocols
- Exclusion (Cleaning): This first step ensures data integrity by removing spectral outliers. Quality can be assessed via the signal-to-noise ratio (SNR) or by using principal component analysis (PCA) to identify spectra that stand out significantly from the dataset in a compressed domain [40].
- Filtering: Techniques like Savitzky-Golay (SG) filtering act as a high-pass filter, emphasizing rapid changes and reducing slower baseline fluctuations. SG also facilitates numerical differentiation and smoothing via a moving-window polynomial fitting [40]. Fourier Self-Deconvolution (FSD) is another advanced technique used to enhance the clarity of spectra by sharpening overlapping peaks, making them more distinct [40].
- Baseline Correction: Measured spectra are often distorted by baselines from instrumental and scattering effects. Correction can range from simple offset subtraction to more complex methods like polynomial fitting or Multiplicative Scatter Correction (MSC) [40].
- Normalization: Applied to correct for unwanted intensity variations due to factors like sample thickness or path length, ensuring that spectral differences reflect true chemical composition [40].
Data Modeling Approaches
After pre-processing, data modeling translates spectral signals into meaningful information.
- Classical Machine Learning: Partial Least Squares (PLS) regression is the de-facto standard tool in spectroscopy for multivariate calibration, relating spectral data to reference values for quantitative analysis [41] [40].
- Deep Learning: AI-based algorithms are increasingly used to handle complex, heterogeneous spectral data, offering powerful capabilities for removing interfering contributions and performing advanced pattern recognition [40].
The Scientist's Toolkit: Essential Research Reagent Solutions
Table 2: Key Materials and Reagents for FTIR Analysis
| Item | Function & Importance | Example Use-Case |
|---|---|---|
| Polystyrene Film | A certified reference material for performance qualification (PQ); verifies wavenumber accuracy and instrument resolution [20]. | Routinely used to ensure laboratory FTIR and portable FTIR instruments are calibrated and producing accurate data before sample analysis. |
| ATR Crystals (Diamond, Germanium) | The sampling interface for Attenuated Total Reflection (ATR) measurement. Enables minimal sample preparation and non-destructive analysis [1]. | Standard for solid and liquid analysis (e.g., drug identification). A heatable diamond ATR can rapidly evaporate liquids [22]. |
| Potassium Bromide (KBr) | A transparent matrix used to dilute solid samples for the transmission measurement technique [1]. | Historical method for solid sample preparation; requires extensive preparation and is destructive, making it less ideal for field use. |
| Spectral Libraries | Digital databases of known compound spectra that serve as a reference for identifying unknown samples via spectral matching [1]. | On-board libraries in portable devices (e.g., capable of identifying 20,000 materials) enable rapid on-scene identification for forensics [2]. |
The choice between portable and laboratory FTIR spectrometers is not a simple matter of one being superior to the other. Instead, it hinges on the application's specific requirements for mobility, data integrity, and performance. Experimental data shows that modern portable FTIR instruments can achieve a level of performance comparable to benchtop systems for many identification and quantification tasks [41]. However, the ultimate reliability of any system—portable or laboratory—is secured by a steadfast commitment to foundational best practices. This includes rigorous Analytical Instrument Qualification (AIQ) with meaningful Performance Qualification (PQ) tests [20], and the application of robust, well-understood chemometric workflows for spectral pre-processing and data modeling [40]. By adhering to these protocols, researchers in drug development and forensics can confidently leverage portable FTIR technology to bring the laboratory to the field, ensuring the speed of analysis does not come at the cost of data integrity.
Developing Robust Calibration Models and Reference Libraries
The evolution of infrared (IR) spectroscopy from a confined laboratory technique to a dynamic field tool represents a significant paradigm shift in analytical science. The core of this transition lies in the development of robust calibration models and reference libraries that ensure analytical accuracy outside the controlled laboratory environment. Where traditional benchtop systems have long been the gold standard for performance and reliability, portable spectrometers now challenge this dominance by bringing the laboratory to the sample, enabling real-time, on-site analysis across diverse fields from pharmaceutical verification to forensic investigation [23] [3]. This comparison guide objectively evaluates the performance of portable versus laboratory IR spectroscopy systems for field detection research, examining how calibration robustness and library completeness directly determine practical application success. The fundamental question remains: can portable systems achieve the rigorous performance standards required for scientific and regulatory acceptance, and if so, through what methodological pathways?
Performance Comparison: Portable vs. Laboratory IR Spectroscopy
The choice between portable and laboratory IR systems involves balancing performance requirements with operational constraints. The following comparison summarizes key performance characteristics based on experimental data and manufacturer specifications.
Table 1: Performance Comparison of Portable vs. Laboratory IR Spectrometers
| Performance Characteristic | Portable IR Spectrometers | Benchtop Laboratory Systems |
|---|---|---|
| Spectral Accuracy/Resolution | Varies by model; Modern FTIR portables can achieve near-lab performance [22] [42] | Consistently high resolution and accuracy [23] |
| Limit of Detection (for Cocaine HCl in mixtures) | 25% concentration in common adulterants [4] | Not explicitly stated, but presumed superior |
| False Positive Rate | Significantly lower than color tests; minimal with proper libraries [4] | Minimal with standardized protocols [20] |
| Analysis Time | Minutes including sample preparation and data collection [43] [4] | Similar analysis time, but additional sample transport required [23] |
| Required Operator Skill | Minimal with intuitive software; ~10 minutes training reported [22] | Requires skilled technicians for operation and maintenance [23] |
| Environmental Robustness | IP65 rating (dust and water jet protection); vibration damping [22] | Requires controlled laboratory environments |
| Regulatory Compliance | Performance Qualification (PQ) possible but challenging [20] | Established PQ protocols and pharmacopeia compliance [20] |
The data reveals a nuanced performance landscape. While benchtop systems maintain advantages in raw specification and regulatory tradition, portable systems have closed the gap significantly in field-applicable scenarios. For cocaine detection, portable IR demonstrated a 25% detection limit in mixtures with common adulterants—a performance adequate for many field applications given that street-level cocaine purity often ranges from 30-60% [4]. The critical advantage of portables lies in their operational context: they provide non-destructive analysis with minimal false positives compared to color-based field tests, which have documented cases of false convictions [4].
Experimental Protocols for Calibration Development
Protocol for Robust Calibration Model Development
Developing calibration models resistant to environmental variables requires systematic methodologies. The following protocol, adapted from snow pear lignin content research, demonstrates a robust approach using portable NIR spectroscopy [44]:
Sample Selection and Preparation: Collect samples representing expected natural variation. For the snow pear study, 512 samples across four batches collected at different time periods ensured temporal diversity. Samples should be free from surface damage and representative of typical size and shape variations [44].
Reference Method Analysis: Establish accurate reference values using standardized laboratory methods. For the lignin study, this involved traditional chemical analysis to determine precise lignin content for each sample, creating the ground truth dataset [44].
Spectral Acquisition: Collect spectra using consistent positioning. Researchers acquired average NIR spectra (1033–2300 nm range) at nine different measurement positions on each fruit sample using a portable NIR spectrometer, ensuring comprehensive coverage [44].
Data Splitting: Divide data into calibration (~70%), validation (~15%), and prediction (~15%) sets using structured approaches like Kennard-Stone algorithm to ensure representative distribution.
Pre-processing and Variable Selection: Apply spectral pre-processing to reduce noise and select informative wavelengths. The successful model used Standard Normal Variate Transformation (SNV) followed by Genetic Algorithm (GA) to select 80 effective wavelengths from the full spectrum [44].
Model Building: Develop Partial Least Squares Regression (PLSR) models using the selected variables and determine optimal latent variables through cross-validation to prevent overfitting [44].
Model Validation and Updating: Test models on new batch samples and update using model enhancement techniques like Semi-supervised Free Parameter Model Enhancement (SS-FPME) when performance degrades on new data batches [44].
Protocol for Field Performance Validation
Validating spectrometer performance under field conditions requires rigorous experimental design, as demonstrated in cocaine detection studies [4]:
Sample Preparation: Create calibrated mixtures with target analyte and common adulterants. For cocaine detection, researchers prepared two-component mixtures with cocaine HCl and adulterants (lidocaine, mannitol, caffeine, artificial sweetener, baby formula) at concentrations of 0.1, 0.5, 1, 5, 10, 25, 35, and 50% by mass [4].
Instrumentation Setup: Utilize commercially available portable systems with appropriate sampling accessories. The cited study used a Smiths Detection HazMatID Elite portable IR spectrometer with diamond ATR sampling element [4].
Data Collection: Collect triplicate spectra from each sample mixture using the instrument's standard operating protocol.
Library Matching: Compare spectra against onboard spectral libraries using the instrument's search algorithm. A "hit" for the target compound is recorded as a positive identification [4].
Limit of Detection Determination: Identify the lowest concentration that consistently yields positive identification. For portable IR, this was 25% cocaine HCl with common adulterants [4].
Specificity Testing: Test pure adulterants to verify they do not produce false positives with the target library entry [4].
Comparative Analysis: Compare results against alternative methods (color tests, portable Raman) using the same sample sets to establish relative performance [4].
Implementation Workflows
The transition from laboratory calibration to field implementation follows a systematic pathway encompassing both technical and operational considerations.
This workflow highlights the iterative nature of robust calibration development, particularly the critical model updating phase required when field performance degrades due to new sample types or environmental factors.
Calibration Model Enhancement Techniques
Addressing Model Transfer Challenges
A fundamental challenge in field-portable spectroscopy is maintaining calibration performance across different instruments, environments, and sample batches. Research demonstrates that a master calibration model developed for one batch of samples often shows significantly degraded performance when applied to new batches, with correlation coefficients for prediction (Rp) decreasing dramatically and root mean square error of prediction (RMSEP) increasing [44]. This transfer problem necessitates specialized enhancement techniques.
Table 2: Calibration Model Enhancement Techniques
| Technique | Methodology | Application Context | Advantages | Limitations |
|---|---|---|---|---|
| Global Calibration Models | Combine spectral data from multiple conditions (temperatures, instruments) into a single model [45] | Continuous environmental variations (e.g., temperature) | Models external variation implicitly; Handles continuous changes | Requires extensive data collection; Model complexity |
| Robust Variable Selection | Select spectral regions insensitive to changing conditions using algorithms (SA, GA, CARS) [45] [44] | Localized spectral interference | Reduces model complexity; Excludes problematic regions | May discard chemically relevant information |
| Semi-Supervised Free Parameter Model Enhancement (SS-FPME) | Update models using new batch samples with supervised learning of parameters [44] | New sample batches with different characteristics | Improves robustness and migration ability; Sequential learning | Requires new reference values for some samples |
| Direct Standardization | Mathematical transformation of spectra to match original calibration space [45] | Instrument-to-instrument transfer | Directly addresses instrumental differences | Requires standardized samples across instruments |
Pre-processing and Data Quality Control
Effective pre-processing is essential for extracting meaningful signals from raw spectral data contaminated by various interfering factors. The IR spectral analysis pipeline typically involves multiple pre-processing stages [40]:
Spectral Cleaning: Identify and remove outlier spectra using signal-to-noise ratios or principal component analysis (PCA) to maintain data integrity.
Filtering: Apply Savitzky-Golay filtering for smoothing and derivative calculation, or use Fourier Self-Deconvolution (FSD) to resolve overlapping peaks.
Baseline Correction: Remove baseline contributions using polynomial fitting, multiplicative scatter correction (MSC), or standard normal variate (SNV) transformation.
Normalization: Scale spectra to account for path length differences or concentration variations.
The Scientist's Toolkit: Essential Research Reagents and Materials
Successful field analysis requires careful selection of materials and reference standards to ensure analytical validity.
Table 3: Essential Research Materials for Field Calibration Development
| Item/Category | Function | Application Example |
|---|---|---|
| Certified Reference Materials | Instrument verification and performance qualification [20] | Polystyrene films for wavenumber verification [20] |
| System Suitability Standards | Ongoing performance monitoring under field conditions | Controlled substances for forensic verification [4] |
| Stable Calibration Samples | Model development and transfer validation | Snow pear samples across multiple batches [44] |
| Adulterant Libraries | Specificity testing and interference checking | Common cutting agents (lidocaine, mannitol, caffeine) [4] |
| Portable FTIR with ATR Accessory | Field-deployable analysis with minimal sample prep | Agilent 4300 or Bruker Mobile-IR II [22] [42] |
| Cloud-Based Spectral Databases | Reference library access and data sharing in field | NIRLAB cloud-based software [23] |
The development of robust calibration models and comprehensive reference libraries represents the critical pathway toward reliable field detection using portable IR spectroscopy. While benchtop systems maintain advantages in controlled environments, portable instruments have achieved sufficient performance for numerous field applications when supported by appropriate calibration methodologies. The experimental data reveals that success in field deployment depends less on raw instrument specifications and more on systematic approaches to calibration transfer, model enhancement, and ongoing performance validation. As portable spectrometer technology continues to evolve—with market projections reaching $4.065 billion by 2030—the scientific community's focus must remain on developing the calibration infrastructures and reference libraries that transform capable hardware into scientifically defensible analytical tools [3]. Future advancements will likely emerge through standardized calibration transfer protocols, shared spectral databases, and intelligent model-updating algorithms that automatically adapt to new measurement conditions.
Evidence and Decision-Making: Validating Portable IR Against Lab Standards
The transition of infrared (IR) spectroscopy from controlled laboratory settings to dynamic field environments represents a significant paradigm shift in analytical science. This guide provides an objective comparison of the performance metrics—sensitivity, specificity, and accuracy—between portable and laboratory-based IR spectroscopy systems, drawing on recent real-world studies. As these portable technologies mature, understanding their operational capabilities and limitations becomes crucial for researchers, scientists, and drug development professionals who rely on precise chemical analysis outside traditional laboratory confines. The demand for field-deployable instruments has accelerated dramatically, driven by needs in pharmaceutical authentication, environmental monitoring, clinical diagnostics, and agricultural assessment, where rapid, on-site decisions are paramount [2]. This analysis systematically evaluates how portable IR spectrometers perform against the gold standard of laboratory instruments, examining the experimental protocols that generate performance data and the key factors influencing reliability in real-world applications.
Performance Metrics Comparison: Portable vs. Laboratory IR Spectroscopy
The evaluation of any analytical technique's real-world utility hinges on its diagnostic performance metrics. In the context of spectroscopy, sensitivity refers to the method's ability to correctly identify true positives (e.g., correctly detecting a substandard drug or a specific soil property), while specificity measures its ability to correctly identify true negatives. Accuracy encompasses the overall correctness of the method. The table below summarizes findings from recent, real-world studies that directly or indirectly compare portable and laboratory-based IR systems.
Table 1: Performance Metrics of IR Spectroscopy in Various Real-World Applications
| Application Domain | Technology Studied | Sensitivity | Specificity | Accuracy / AUC | Reference Method |
|---|---|---|---|---|---|
| Pharmaceutical Screening (Nigeria) | Handheld NIR Spectrometer | 11% (Overall); 37% (Analgesics) | 74% (Overall); 47% (Analgesics) | Not Specified | HPLC [46] |
| Pediatric Leukemia Detection | Laboratory FTIR (Serum Analysis) | 73-84% | Not Specified | AUC ≈ 0.80 | Bone-marrow biopsy [47] |
| Soil Property Analysis | Portable MIR (with Calibration Transfer) | Not Specified | Not Specified | Rivaled Laboratory Models | Laboratory Spectrometers [48] |
| Crop Straw Composition | Industrialized NIR vs. Laboratory NIR | Not Specified | Not Specified | Industrialized outperformed Lab for VM prediction [49] |
The data reveals a variable landscape. In a rigorous pharmaceutical study, a handheld NIR spectrometer demonstrated low sensitivity (11% overall) despite moderate specificity (74%), indicating a high risk of missing substandard and falsified (SF) medicines in the field [46]. In contrast, a clinical study using laboratory-grade FTIR for serum analysis to detect pediatric acute lymphoblastic leukemia showed more promising results, with moderate sensitivity (73-84%) and an AUC of 0.80, suggesting better diagnostic potential in a controlled biofluid analysis context [47]. Meanwhile, in agricultural applications, the performance of portable systems can match laboratory standards when enhanced with sophisticated data transfer techniques, and in some cases, industrialized NIR systems have been reported to outperform their laboratory counterparts for specific predictions, such as the volatile matter content in crop straw [48] [49].
Detailed Experimental Protocols and Methodologies
The performance metrics summarized in Table 1 are derived from specific, validated experimental protocols. Understanding these methodologies is critical for interpreting the results and assessing the technologies' applicability to new research problems.
Protocol 1: Field Detection of Substandard and Falsified Medicines
This study provides a clear example of a real-world validation protocol for a portable NIR device against a gold-standard laboratory method.
- Objective: To evaluate the performance of a handheld, AI-powered NIR spectrometer in detecting SF medicines in Nigeria against HPLC [46].
- Sample Collection: 246 drug samples (analgesics, antibiotics, antimalarials, antihypertensives) were purchased from randomly selected pharmacies across six geopolitical regions of Nigeria using mystery shoppers [46].
- Instrumentation & Analysis:
- Portable NIR: A proprietary handheld spectrometer with a NIR range of 750-1500 nm was used. The device compared the spectral signature of purchased drugs to a cloud-based AI reference library of authentic products, providing a "match" or "non-match" result in about 20 seconds [46].
- Reference Method (HPLC): The same drug samples were analyzed using High-Performance Liquid Chromatography (HPLC) at a certified laboratory (Hydrochrom Analytical Services Limited, Lagos) to determine the precise active pharmaceutical ingredient (API) content [46].
- Data Analysis: Sensitivity and specificity of the NIR device were calculated using the HPLC results as the ground truth. A sample was considered a true positive (for being SF) if it failed the HPLC test and was also flagged by the NIR device [46].
Protocol 2: Serum-Based Leukemia Detection with Laboratory FTIR
This protocol illustrates a classic laboratory-based spectroscopic application with clinical diagnostic goals.
- Objective: To assess whether FTIR spectroscopy of blood serum could distinguish between pediatric patients with acute lymphoblastic leukemia (ALL) and controls [47].
- Sample Preparation: Serum was separated from peripheral blood of 103 children (45 with ALL, 58 controls) by centrifugation. A 20 µL aliquot was deposited onto a polished Calcium Fluoride (CaF₂) window and dried in a desiccator before analysis [47].
- Instrumentation & Analysis:
- Laboratory FTIR: A Bruker Vertex 70v spectrometer equipped with a Mercury Cadmium Telluride (MCT) detector and a single-reflection diamond Attenuated Total Reflection (ATR) accessory was used [47].
- Spectral Acquisition: Spectra were acquired in the mid-infrared range (800–1800 cm⁻¹ and 2800–3500 cm⁻¹), covering major biochemical bands from proteins, lipids, and nucleic acids [47].
- Data Analysis: Spectra were preprocessed (baseline correction, derivative filtering, normalization). Machine learning models, specifically logistic regression with stratified 10-fold cross-validation, were trained to classify samples. Performance was evaluated via ROC curves and AUC calculation [47].
Workflow Comparison
The following diagram illustrates the core logical difference between the field-based and laboratory-based spectroscopy protocols described above.
The Scientist's Toolkit: Key Research Reagents and Materials
Successful implementation of IR spectroscopy, whether in the lab or the field, depends on a suite of essential reagents, accessories, and computational tools. The following table details key components referenced in the studies.
Table 2: Essential Research Reagent Solutions for IR Spectroscopy
| Item | Function / Application | Example from Research Context |
|---|---|---|
| Calcium Fluoride (CaF₂) Windows | Substrate for depositing and analyzing liquid samples; transparent in mid-IR range. | Used for depositing and drying serum samples for FTIR analysis in clinical studies [47]. |
| Diamond ATR Crystals | Enables Attenuated Total Reflection sampling; robust and chemically inert for solid/liquid analysis without preparation. | Standard accessory in laboratory FTIR spectrometers (e.g., Bruker Vertex) for solid and liquid samples [47]. |
| Polydimethylsiloxane (PDMS) | An optical coupling material that improves light transmission from sources/sensors into the skin for wearable devices. | Used in a wearable fNIRS sensor to enhance signal quality and comfort [50]. |
| Cloud-Based AI Reference Library | A digital database of spectral signatures from authentic materials used for real-time comparison and identification in the field. | Core component of handheld NIR spectrometers for detecting substandard drugs by matching spectra [46]. |
| Calibration Transfer Standards | Reference materials and algorithms used to standardize data between a primary laboratory spectrometer and portable field units. | "Spiking" technique used to make portable MIR soil analyzers perform as accurately as lab models [48]. |
| Partial Least Squares Regression (PLSR) | A core multivariate statistical modeling algorithm used to correlate spectral data with quantitative properties of interest. | Dominant algorithm for building predictive models for soil properties and crop straw composition from spectra [48] [49]. |
Critical Factors Influencing Real-World Performance
The disparity in performance metrics across different studies, particularly the low sensitivity observed in the pharmaceutical field study, can be attributed to several critical factors that differentiate real-world field applications from controlled laboratory research.
Calibration Transfer and Model Robustness: The accuracy of a portable spectrometer is contingent on the robust transfer of calibration models developed on master laboratory instruments. Techniques like "spiking", which augments calibration datasets with spectra from the portable instrument itself, have been shown to be highly effective, enabling portable mid-infrared (MIR) devices to rival laboratory accuracy for soil analysis [48]. Without such careful transfer, model performance can degrade significantly.
Environmental and Hardware Robustness: Portable devices must withstand physical challenges unknown in the lab, including shock, vibration, and temperature fluctuations. Engineering for this requires shock and vibration isolation and improved temperature resilience, which can sometimes involve trade-offs with sensitivity and performance [2].
Automation and Usability: For use by non-experts in the field, the software must automate tasks traditionally performed by scientists. This includes automatic setting optimization, data acquisition, and interpretation. As noted in forensic applications, portable devices are designed as simple "answer boxes," hiding immense complexity under the hood to provide clear, actionable results [2].
Sample Complexity and Interference: Field samples are often complex and heterogeneous. For example, analyzing gases in a room requires distinguishing trace compounds of interest from a complex background of nitrogen, oxygen, VOCs, and other interferents. This poses a significant challenge for the automation of data interpretation in portable units [2].
The comparative analysis of performance metrics reveals that portable IR spectroscopy is a rapidly advancing field with significant potential, but its real-world performance is highly context-dependent. While portable systems can, under optimal conditions with sophisticated calibration transfer, rival the accuracy of laboratory instruments [48], their diagnostic sensitivity in challenging field deployments, such as detecting counterfeit drugs, can currently be unacceptably low [46]. The choice between portable and laboratory systems is not a simple binary but a strategic decision based on the required balance between speed and absolute precision. For researchers and professionals, this underscores the necessity of:
- Validating portable methods against reference standards in their specific application context.
- Investing in robust calibration and model transfer protocols to minimize performance degradation.
- Understanding that usability and speed in the field can sometimes come at the cost of raw diagnostic power.
Future advancements are likely to focus on improving the sensitivity of portable devices, enhancing the automation of data interpretation for complex samples, and further miniaturization without compromising analytical performance [2] [46]. As these trends continue, the gap between laboratory and field performance is expected to narrow, further solidifying the role of portable IR spectroscopy in the analytical toolkit.
In field detection research, particularly for pharmaceuticals and forensic science, the choice between portable and laboratory-based Infrared (IR) spectroscopy represents a significant strategic decision. This choice balances the need for rapid, on-site intelligence against the demand for the highest possible analytical precision. Portable IR spectrometers offer the compelling advantage of instant analysis where it is needed most—at a crime scene, a border crossing, or within a manufacturing plant. In contrast, laboratory benchtop systems remain the gold standard for definitive, high-resolution analysis in controlled environments [4] [27]. This guide provides an objective comparison of these two paradigms, framing the decision within a comprehensive cost-benefit analysis that weighs initial investment, ongoing operational expenses, and the ultimate return on investment (ROI) for researchers and drug development professionals.
Market Context and Technological Segmentation
The IR spectroscopy market is experiencing steady growth, projected to reach USD 2.17 billion by 2035, with a Compound Annual Growth Rate (CAGR) of approximately 6.0% [51]. This expansion is fueled by technological advancements, particularly in portability and the integration of artificial intelligence (AI) for data analysis [9] [51]. The market is broadly segmented by product type, with portable spectroscopes identified as the category with the highest growth rate, driven by their ease of use for non-technical operators and their expanding application in field settings [52] [53].
Table 1: IR Spectroscopy Market Overview and Projections
| Metric | Value & Projection | Source |
|---|---|---|
| Market Value in 2024 | USD 1.2 - 1.25 billion | [51] [52] |
| Projected Market Value by 2029 | USD 1.6 billion | [52] |
| Projected Market Value by 2035 | USD 2.17 billion | [51] |
| Forecast CAGR (2025-2035) | 6.0% - 6.5% | [51] [52] |
| Highest Growth Product Type | Portable Spectroscopes | [52] [53] |
Direct Cost and Performance Comparison
A critical component of the cost-benefit analysis is a direct, point-by-point comparison of the financial and performance characteristics of portable and benchtop IR systems.
Investment and Operational Cost Analysis
The most apparent differentiator is the initial capital outlay. While a specific price list is dynamic, industry analysis consistently identifies that portable IR spectrometers require a large initial financial investment [4]. However, this initial cost must be evaluated against the long-term operational expenditures of alternative methods. For example, color-based field tests, a common low-cost alternative, cost between $2 and $5 per test [4]. One study estimated that a large metropolitan area with approximately 500 drug-related arrests per year could spend $30,000 annually on these disposable tests, a recurring cost that portable IR spectroscopy can eliminate [4]. Furthermore, the high cost of advanced laboratory benchtop systems can be prohibitive for smaller research institutions and emerging businesses, acting as a significant barrier to entry [52] [53].
Table 2: Cost and Operational Profile Comparison
| Factor | Portable IR Spectroscopy | Laboratory Benchtop IR |
|---|---|---|
| Initial Investment | High initial investment [4] | Very high cost; a barrier for SMEs [52] [53] |
| Operational Cost per Analysis | Low (reusable, minimal consumables) | Low to Medium (requires lab environment, power) |
| Consumables Cost | Minimal | Minimal |
| Personnel Skill Requirement | Designed for use by non-scientist personnel [4] | Requires trained technicians and operators [51] [52] |
| Maintenance Cost | Moderate (ruggedized but complex) [4] | High (complex instrumentation) [53] |
Technical Performance and Analytical Capabilities
Performance characteristics are where the fundamental trade-offs between these systems become most apparent. Portable IR spectrometers provide rapid, on-scene analysis with minimal sample preparation, making them ideal for presumptive testing [4] [27]. However, this convenience comes with technical compromises. Studies comparing handheld and benchtop FTIR systems note that portable units typically have a lower spectral resolution and a lower signal-to-noise ratio, which can limit their ability to distinguish between closely spaced absorption bands and potentially lead to less accurate results for complex samples [27]. Laboratory benchtop systems, with their superior stability and resolution, remain the undisputed choice for definitive confirmation and research requiring the highest data fidelity [27].
Table 3: Performance Characteristics for Field Detection
| Performance Characteristic | Portable IR Spectroscopy | Laboratory Benchtop IR |
|---|---|---|
| Analysis Speed | Rapid (seconds to minutes) [4] | Slower (includes sample logging and preparation) |
| Sample Preparation | Minimal to none [27] | Often required (e.g., grinding, pellet formation) |
| Environment | Field-deployable (on-site) [4] | Controlled laboratory setting |
| Spectral Resolution | Lower (e.g., 2 cm⁻¹) [27] | Higher (e.g., 0.5 cm⁻¹) [27] |
| Signal-to-Noise Ratio | Lower [27] | Higher [27] |
| Limit of Detection (LOD) | Suitable for street-level drug purity [4] | Superior, suitable for trace-level analysis |
| Key Advantage | Speed, portability, and on-site decision-making | Ultimate accuracy, resolution, and definitive results |
Experimental Data and Comparative Methodologies
Objective comparison requires data from studies that directly pit portable and benchtop systems against the same analytical challenges. The following experimental summaries provide such evidence.
Experiment 1: Detection of Bacterial Contamination in Bone Grafts
A 2023 study directly compared a handheld FTIR spectrometer (Agilent 4300 Handheld) with a benchtop FTIR system (Perkin Elmer Spectrum 100 ATR-IR) for detecting Staphylococcus epidermidis contamination in human bone grafts [27].
- Objective: To compare the efficacy of a handheld and a benchtop mid-infrared spectrometer in detecting pathogens in bone grafts.
- Methodology: The researchers analyzed 40 non-infected and 10 infected human bone samples. Spectra were collected from both instruments in the range of 4000 to 650 cm⁻¹. The benchtop system operated at a higher spectral resolution (0.5 cm⁻¹) compared to the handheld device (2 cm⁻¹). The acquired spectral data was then subjected to principal component analysis (PCA) for unsupervised classification [27].
- Results: Both spectroscopic methods yielded significant results and were able to detect a loss in bone quality due to infection. The study concluded that handheld MIR spectroscopy provides a valuable diagnostic tool when tissue is scarce and time is of the essence, validating its potential for on-site screening despite its lower resolution [27].
Experiment 2: On-Scene Analysis of Controlled Substances
A 2018 study evaluated portable IR and Raman spectrometers against traditional color-based tests for the on-scene analysis of cocaine HCl, highlighting the operational advantages of portable spectroscopy [4].
- Objective: To determine the best method for on-scene presumptive testing of cocaine HCl by comparing performance characteristics.
- Methodology: The study assessed the limit of detection, specificity (false positives/negatives), ease of use, speed, and destructive nature of color tests (NIK Test G), portable IR (Smiths Detection HazMatID Elite), and portable Raman (Smiths Detection ACE-ID). Two-component mixtures of cocaine HCl with common adulterants like lidocaine and caffeine were created and analyzed [4].
- Results: The research concluded that portable IR spectroscopy was superior to color tests, demonstrating high performance characteristics including ease of use, rapid analysis, non-destructive capability, and minimal false positives. It was also determined to be better than portable Raman for this application due to a lower limit of detection and less interference from fluorescence [4].
The Scientist's Toolkit: Essential Research Reagents and Materials
The following table details key materials and reagents used in the experimental protocols cited for the field detection of analytes like drugs or biological contaminants [4] [27].
Table 4: Key Research Reagent Solutions for Field Detection
| Item | Function in Analysis |
|---|---|
| Pure Drug Analytical Standards (e.g., Cocaine HCl) | Serves as a reference control for spectral library matching and method validation [4]. |
| Common Adulterants (e.g., Lidocaine, Caffeine, Mannitol) | Used to create representative mixture samples for testing method specificity and detecting false positives [4]. |
| Bacterial Culture Media (e.g., Mueller-Hinton Broth) | Used to cultivate and prepare pathogen samples (e.g., S. epidermidis) for contamination detection studies [27]. |
| ATR Crystal Cleaner and Solvent (e.g., Methanol, Isopropanol) | Essential for maintaining the sampling interface of portable and benchtop ATR-FTIR instruments between analyses to prevent cross-contamination [4] [27]. |
| Calibration Reference Material | A standardized material provided by the instrument manufacturer to verify the wavelength and photometric accuracy of the spectrometer [4]. |
Strategic Implementation and Return on Investment (ROI)
Calculating the ROI for an analytical instrument extends beyond simple purchase price. For portable IR spectroscopy, the ROI is driven by operational efficiencies and risk mitigation, whereas for benchtop systems, it is tied to research output and definitive quality control.
Quantifying the ROI of Portable IR Spectroscopy
The ROI for a portable IR system is realized through:
- Elimination of Recurring Consumable Costs: Replacing thousands of dollars in annual spending on color-test kits with a one-time capital investment [4].
- Accelerated Decision-Making: Enabling immediate investigative or quality control decisions on-site, which reduces delays and saves personnel time [4] [36].
- Reduced Litigation Risk: Minimizing the risk of false arrests and wrongful convictions stemming from faulty color tests, thereby avoiding substantial legal costs and reputational damage [4].
The Value Proposition of Laboratory Benchtop Systems
The investment in a benchtop system is justified by:
- Regulatory Compliance and Defensible Data: Providing the high-resolution, court-defensible data required for regulatory submissions and conclusive reporting [51] [52].
- Research Versatility: Serving as a core, versatile analytical tool for a wide range of R&D projects beyond routine field testing [9] [51].
- High-Throughput Analysis: In a laboratory setting, automated benchtop systems can process a larger number of samples more efficiently than manual portable units for certain applications [36].
The choice between portable and laboratory IR spectroscopy is not a matter of identifying a universal "best" option, but of selecting the right tool for the specific operational and analytical context. For field detection research where speed, portability, and rapid presumptive identification are paramount, portable IR spectroscopy offers a compelling ROI by streamlining operations and reducing long-term consumable costs. For applications demanding the highest possible accuracy, resolution, and definitive results, the laboratory benchtop system remains an indispensable investment.
Future trends point toward a convergence of these strengths. The integration of AI and machine learning is enhancing the data interpretation capabilities of both systems, potentially allowing portable devices to overcome some of their technical limitations [9] [51]. Furthermore, the ongoing miniaturization and cost reduction of portable devices are making this technology accessible to a broader range of users, from field researchers to smaller laboratories [51] [53]. The most sophisticated analytical workflows will likely leverage both, using portable devices for initial triage and benchtop systems for final confirmation.
The analysis of pharmaceutical and illicit drugs is a critical task for ensuring public health, safety, and regulatory compliance. Traditionally, this has relied on laboratory-based techniques like High-Performance Liquid Chromatography (HPLC), which, while highly accurate, are time-consuming, costly, and centralized. The need for rapid, on-site screening is driving the adoption of portable spectroscopic techniques, moving the laboratory directly to the sample. Among these, handheld Near-Infrared (NIR) spectroscopy has emerged as a promising non-destructive technology. This case study provides an independent evaluation of its performance, comparing it to laboratory standards and alternative field-portable instruments within the broader context of portable versus laboratory-based infrared spectroscopy for field detection research.
Performance Comparison: Handheld NIR vs. Laboratory Standards
Independent studies directly comparing handheld NIR spectrometers to gold-standard laboratory methods reveal a nuanced picture of its capabilities and limitations.
A 2025 study in Nigeria tested 246 drug samples from retail pharmacies using a proprietary AI-powered handheld NIR spectrometer and confirmed the results with HPLC [54]. The study found that 25% of the samples were substandard or falsified (SF) according to HPLC. The performance of the NIR device varied significantly by drug category, as summarized in Table 1 [54].
Table 1: Performance of Handheld NIR vs. HPLC for Drug Analysis (Nigeria Study)
| Drug Category | HPLC Failure Rate | NIR Sensitivity | NIR Specificity | Key Findings |
|---|---|---|---|---|
| All Medicines | 25% | 11% | 74% | Very low sensitivity; misses most SF medicines |
| Analgesics | Not Specified | 37% | 47% | Moderate sensitivity but low specificity |
| Antimalarials, Antibiotics, Antihypertensives | Not Specified | Very Low | High | Failed to detect most poor-quality medicines |
The study concluded that while handheld NIR devices hold great potential, their low sensitivity is a major concern, as it results in a high number of false negatives, allowing SF medicines to reach patients [54].
In contrast, a more optimistic 2022 study in Australia, using a MicroNIR spectrometer on 608 illicit drug specimens, reported high accuracy for identifying crystalline methamphetamine HCl (98.4%), cocaine HCl (97.5%), and heroin HCl (99.2%) when combined with robust chemometric models [13]. This highlights that performance is highly dependent on the specific device, the quality of the spectral library, and the chemometric models used.
Comparative Analysis: Handheld NIR vs. Other Portable Techniques
Handheld NIR is one of several vibrational spectroscopy techniques deployed in the field. Table 2 compares it against other common portable methods.
Table 2: Comparison of Portable Spectroscopic Techniques for Drug Analysis
| Technique | Principle | Key Advantages | Key Limitations & Challenges |
|---|---|---|---|
| Handheld NIR | Absorption of NIR light; measures O-H, C-H, N-H bonds | Non-destructive; minimal sample prep; fast (~20 sec); penetrates packaging [54] [55] | Low sensitivity for certain drugs; requires extensive, curated spectral libraries; performance depends heavily on chemometrics [54] |
| Portable FTIR | Absorption of mid-IR light; measures molecular vibrations | High specificity; well-established for forensics; can be lab-grade in field [2] | Can be affected by sample heterogeneity; library-dependent |
| Portable Raman | Inelastic scattering of light; measures molecular vibrations | Minimal interference from water; can analyze through transparent containers [3] | Fluorescence interference from impurities can swamp signal; not ideal for colored samples [4] |
| Color-Based Field Tests | Chemical reaction producing a color change | Very low cost; simple to use | High false positive rates; destructive; requires handling chemicals; subjective interpretation [4] |
A 2018 study specifically compared portable IR and Raman spectrometers for on-scene cocaine analysis. It concluded that portable IR was superior to Raman due to a lower limit of detection and less interference from fluorescence, which is a common issue with drugs like heroin or certain additives [4].
Experimental Protocols for Independent Evaluation
To ensure objective and reproducible results, independent evaluations of handheld NIR spectrometers should adhere to rigorous experimental protocols. The following workflow, based on methodologies from the cited studies, outlines a comprehensive validation framework.
Key Steps in the Experimental Workflow:
- Sample Collection: Acquire a statistically relevant number of drug samples from the field. The Nigeria study, for instance, purchased 246 samples from randomly selected pharmacies across different geopolitical zones to ensure representativeness [54].
- Reference Analysis: Analyze all samples using a validated laboratory method, such as HPLC or GC-MS, to establish the ground truth for identity and potency. This serves as the benchmark for all subsequent comparisons [54] [55].
- NIR Spectral Acquisition: Scan each sample using the handheld NIR spectrometer according to manufacturer guidelines. This is typically non-destructive and rapid, taking as little as 20 seconds per sample. Samples are often scanned through their primary packaging (e.g., glass vials, plastic bags) [55].
- Chemometric Modeling: Develop or utilize the device's proprietary machine learning algorithms and spectral libraries. The model is trained using the spectral data and the corresponding reference lab data to identify and quantify the drug components [13] [54].
- Performance Evaluation: Compare the NIR results against the reference lab data to calculate critical performance metrics like sensitivity, specificity, and accuracy, as shown in Table 1 [54].
The Scientist's Toolkit: Essential Research Reagents & Materials
Table 3: Key Materials for Handheld NIR Drug Analysis Research
| Item | Function in Research & Analysis |
|---|---|
| Handheld NIR Spectrometer | The core analytical device; collects spectral data from samples in the field or lab. Key specs include wavelength range (e.g., 750-1500 nm) and resolution [54] [55]. |
| Reference Drug Standards | High-purity, authenticated materials used to build and validate the instrument's spectral library, ensuring accurate identification [55]. |
| Chemometric Software | AI and machine learning algorithms that process raw spectral data, compare it to reference libraries, and provide identification/quantification results [13] [54]. |
| Laboratory Reference Method (e.g., HPLC) | Gold-standard technique used for confirmatory analysis and to establish the ground truth for evaluating the NIR spectrometer's accuracy [54]. |
| Adulterant/Bulking Agent Library | Spectral data for common cutting agents (e.g., caffeine, mannitol, lidocaine) to improve the model's ability to identify mixtures and prevent false positives [4] [55]. |
Handheld NIR spectroscopy represents a significant advancement in portable drug analysis, offering speed, non-destructive testing, and the power of AI-driven chemometrics. Independent evaluations, however, reveal that its performance is not universal. While it can achieve high accuracy for certain illicit drugs in controlled research settings [13], its sensitivity can be unacceptably low for detecting substandard and falsified pharmaceuticals in real-world conditions [54]. When compared to other portable techniques, its advantage lies in its simplicity and non-destructiveness, though it may be outperformed by portable FTIR in some forensic applications [4] [2]. For researchers and regulators, the decision to implement handheld NIR must be guided by rigorous, independent validation against laboratory standards for the specific drug types and formulations they intend to analyze. Continued improvements in spectral libraries, sensor technology, and data analysis algorithms are essential to fully realize its potential in safeguarding public health.
This guide provides an objective comparison between portable and laboratory-based infrared (IR) spectroscopy to help researchers and drug development professionals select the optimal technology for field detection projects. We present performance data, detailed experimental protocols, and a structured decision-making framework to inform your strategic selection.
The choice between portable and laboratory IR spectroscopy involves a direct trade-off between analytical performance and operational flexibility. Portable systems enable rapid, on-site analysis with minimal sample preparation, revolutionizing response times in field applications from forensic investigations to environmental monitoring [2]. Laboratory benchtop systems offer superior sensitivity, resolution, and robust quantitative capabilities, remaining the gold standard for definitive analysis [10]. The following table summarizes the core characteristics of each technology.
Table 1: Core Characteristics of Portable vs. Laboratory IR Spectroscopy
| Feature | Portable IR Spectroscopy | Laboratory Benchtop IR |
|---|---|---|
| Primary Use Case | On-site presumptive testing, field deployment [2] | Confirmatory analysis, R&D, high-precision QA/QC [10] |
| Key Advantage | Rapid, actionable results at point of need [4] [2] | Highest data quality, sensitivity, and resolution [10] |
| Typical Technologies | Portable FTIR, Handheld NIR, Portable Raman [4] [56] | FTIR, FT-NIR, Advanced Accessories (Microscopy, etc.) [1] |
| Sample Preparation | Minimal to none (e.g., ATR) [1] | Often required (e.g., KBr pellets, thin slices) [1] |
| Operational Cost | Lower initial investment than benchtop systems [23] | High initial capital and maintenance costs [10] [23] |
| Ease of Use | Designed for non-scientist operators with automated software [2] | Requires skilled technical personnel for operation and data interpretation [10] |
Performance Data: Quantitative Comparison
Objective data from controlled experiments is crucial for evidence-based selection. The following tables summarize key performance metrics from published studies.
Detection Capabilities and Limitations
Table 2: Performance Comparison of Field Detection Methods for Cocaine HCl
| Performance Characteristic | Portable IR Spectroscopy | Portable Raman Spectroscopy | Color-Based Field Tests |
|---|---|---|---|
| Limit of Detection (LOD) | 25% cocaine in mixtures [4] | Not specified, but higher than IR for some samples [4] | 10% cocaine in mixtures [4] |
| False Positives | Minimal [4] | Minimal [4] | High; numerous known interferents (e.g., lidocaine) [4] |
| Analysis Time | Seconds to minutes [4] | < 30 seconds [57] | A few minutes [4] |
| Destructive to Sample | No [4] | No [57] | Yes [4] |
Application-Specific Suitability
Table 3: Technique Selection Based on Sample and Environment
| Scenario | Recommended Technique | Rationale |
|---|---|---|
| Sealed/Transparent Containers | Portable Raman [57] | Laser can interrogate sample through glass/plastic. |
| Aqueous Solutions | Portable Raman [57] | Water has a very weak Raman signal, minimizing interference. |
| Fluorescent Samples | Portable FT-IR [57] | FT-IR is not affected by fluorescence, which can overwhelm Raman signals. |
| Highly Polar Bonds | Portable FT-IR [57] | FT-IR excels at detecting strong absorptions from polar covalent bonds. |
| White/Light-Colored Powders | Portable Raman [57] | These typically produce strong, clear Raman signals. |
| Requiring Lab-Grade Confirmation | Laboratory Benchtop IR [10] | Superior sensitivity, resolution, and stable environment for definitive analysis. |
Experimental Protocols: Methodologies for Cited Data
To ensure the reproducibility of the data presented, this section details the key experimental methodologies from the studies cited in the performance tables.
Protocol: Comparison of On-Scene Cocaine Analysis Methods
This protocol is derived from a published study comparing color tests, portable IR, and portable Raman for the analysis of cocaine HCl [4].
- Objective: To evaluate the performance characteristics (LOD, false positives, speed, ease of use) of common field methods for cocaine analysis.
- Materials:
- Samples: Pure cocaine HCl and two-component mixtures with adulterants (lidocaine, mannitol, caffeine, artificial sweetener, baby formula) at concentrations of 0.1, 0.5, 1, 5, 10, 25, 35, 50% cocaine by mass [4].
- Equipment: Narcotics Identification Kit (NIK) Test G; Smiths Detection HazMatID Elite portable FT-IR spectrometer with diamond ATR; Smiths Detection ACE-ID portable Raman spectrometer [4].
- Procedure:
- Control Analysis: Analyze pure cocaine HCl and each pure adulterant to establish control spectra and check for false positives [4].
- LOD Study: Analyze the prepared mixture series. For IR and Raman, a positive result is a library "hit" for cocaine HCl. For the color test, observe the prescribed color change after breaking sequential ampoules [4].
- Data Interpretation: Determine the LOD as the lowest concentration yielding a consistent positive result. Record analysis time and note any interferents causing false positives/negatives [4].
Protocol: IR Spectral Data Acquisition and Pre-Processing
This general protocol for obtaining high-quality IR spectra is compiled from fundamental guides and reviews on IR spectroscopy [1] [40].
- Objective: To acquire and pre-process an IR spectrum for reliable identification or quantification.
- Materials: IR spectrometer (portable or benchtop), sample, appropriate accessory (e.g., ATR crystal, transmission cell).
- Procedure:
- Background Collection: Collect a spectrum without the sample to measure the instrument and environmental background [1].
- Sample Presentation:
- Sample Scanning: Collect the sample spectrum. The number of scans is a balance between signal-to-noise and acquisition time [40].
- Spectral Pre-Processing:
- Exclusion/Cleaning: Remove spectral outliers by assessing signal-to-noise ratio or using PCA [40].
- Baseline Correction: Apply a polynomial fit or multiplicative scatter correction (MSC) to remove baseline drift caused by scattering [40].
- Smoothing: Use techniques like Savitzky-Golay filtering to reduce high-frequency noise [40].
Diagram 1: IR Analysis Workflow
Strategic Selection Framework
Use the following logic to guide your instrument selection process, based on project-specific requirements.
Diagram 2: Field Instrument Selection Logic
Framework for Field Deployment Decision-Making
The following questions and actions will solidify your final selection.
- Define the Primary Field Question: Determine if the need is for presumptive identification (where portability and speed are critical) or definitive, quantitative analysis (which requires laboratory confirmation) [4] [2]. Portable instruments are answer-focused tools for rapid decision-making [2].
- Profile the Sample and Environment: Consider the sample's physical state, container, and potential interferences. Use Diagram 2 and Table 3 to match sample properties to the most suitable technique. Account for environmental conditions (temperature, humidity, shock) and verify the portable instrument's ruggedness is sufficient [2].
- Evaluate Total Cost of Ownership (TCO): Calculate costs beyond the initial purchase. Include long-term maintenance, calibration, operator training, and data management. While portable systems have a lower upfront cost, benchtop systems offer unparalleled performance for their price in a lab setting [10] [23].
- Validate with Real Samples: Before finalizing a portable instrument, test it against a representative set of samples and adulterants to verify its library contains the relevant substances and that its performance (LOD, specificity) meets requirements [4].
The Scientist's Toolkit: Essential Research Reagent Solutions
A successful IR spectroscopy project, whether in the lab or field, relies on more than just the spectrometer. The following table details key materials and their functions.
Table 4: Essential Materials and Reagents for IR Spectroscopy
| Item | Function | Application Context |
|---|---|---|
| ATR Crystals (Diamond, ZnSe, Ge) | Enables minimal-prep sample analysis by measuring attenuated total reflection of IR light at the crystal-sample interface [1]. | Universal for solids and liquids; diamond is rugged for field use [4] [1]. |
| Potassium Bromide (KBr) | An IR-transparent salt used to dilute solid samples and create pellets for transmission analysis [1]. | Laboratory-based transmission IR spectroscopy [1]. |
| Narcotics Identification Kits (NIK) | Colorimetric tests providing a presumptive positive/negative result based on chemical reaction [4]. | Traditional, low-cost field testing for drugs of abuse; high false-positive rate [4]. |
| Spectral Libraries | Curated databases of reference spectra for automated identification of unknown substances by software algorithms [4] [57]. | Critical for both portable and lab systems; quality and breadth determine identification capability [4]. |
| Savitzky-Golay Filter | A digital signal processing technique used to smooth spectral data and calculate derivatives, enhancing signal-to-noise and resolving overlapping peaks [40]. | Common pre-processing step in data analysis software for both portable and lab systems [40]. |
Conclusion
The choice between portable and laboratory IR spectroscopy is not about finding a universal winner, but about strategic alignment with project objectives. Portable IR spectrometers offer unparalleled advantages in speed, cost-effectiveness, and on-site decision-making for screening and field applications, despite potential trade-offs in ultimate precision. Laboratory systems remain the gold standard for high-accuracy, comprehensive analysis where sample transport is feasible. The future points towards integration, with portable devices acting as powerful front-line tools supported by centralized lab confirmation. For biomedical research, emerging trends like AI-powered handheld devices, advanced chemometrics, and validated clinical applications for conditions like fibromyalgia will further blur the lines, creating a more connected and efficient analytical ecosystem. Researchers are encouraged to adopt a hybrid approach, leveraging the strengths of both technologies to accelerate discovery and ensure product quality.
References
- 1. Guide to FT-IR Spectroscopy [https://www.bruker.com/en/products-and-solutions/infrared-and-raman/ft-ir-routine-spectrometer/what-is-ft-ir-spectroscopy.html]
- 2. From Lab to Field: The Impact of Portable FTIR in Forensics [https://www.sepscience.com/from-lab-to-field-the-impact-of-portable-ftir-in-forensics-10638]
- 3. Portable and Wearable Spectrometers in Our Future [https://www.spectroscopyonline.com/view/portable-and-wearable-spectrometers-in-our-future]
- 4. A Comparison of Portable Infrared Spectrometers ... [https://www.spectroscopyonline.com/view/comparison-portable-infrared-spectrometers-portable-raman-spectrometers-and-color-based-field-tests]
- 5. Infrared Spectral Interpretation, In The Beginning I [https://www.spectroscopyonline.com/view/infrared-spectral-interpretation-in-the-beginning-i-the-meaning-of-peak-positions-heights-and-widths]
- 6. Comparison of Portable and Benchtop Near-Infrared ... [https://pmc.ncbi.nlm.nih.gov/articles/PMC10024328/]
- 7. An evaluation of resolution, accuracy, and precision in FT ... [https://pubmed.ncbi.nlm.nih.gov/38823244/]
- 8. Evaluating Low-Cost Optical Spectrometers for the Detection ... [https://pmc.ncbi.nlm.nih.gov/articles/PMC7066480/]
- 9. 2025 Review of Spectroscopic Instrumentation [https://www.spectroscopyonline.com/view/2025-review-of-spectroscopic-instrumentation]
- 10. IR Spectroscopy Equipment 2025 Trends and Forecasts ... [https://www.archivemarketresearch.com/reports/ir-spectroscopy-equipment-176638]
- 11. FTIR vs. NIR Spectroscopy: A Comparative Analysis [https://www.nirlab.com/ftir-vs-nir-spectroscopy-a-comparative-analysis/]
- 12. FTIR Applications | Thermo Fisher Scientific - US [https://www.thermofisher.com/us/en/home/industrial/spectroscopy-elemental-isotope-analysis/molecular-spectroscopy/fourier-transform-infrared-spectroscopy/applications.html]
- 13. Development and evaluation of portable NIR technology ... [https://www.sciencedirect.com/science/article/pii/S0379073824002603]
- 14. Handheld FT-IR Spectrometers: Bringing the ... [https://www.spectroscopyonline.com/view/handheld-ft-ir-spectrometers-bringing-spectrometer-sample]
- 15. Comparing the analytical performances of Micro-NIR and ... [https://www.sciencedirect.com/science/article/pii/S0039914016309754]
- 16. The Future of FT-IR Imaging [https://www.spectroscopyonline.com/view/the-future-of-ft-ir-imaging]
- 17. Dataset of Fourier transform infrared (FTIR) spectra of a ... [https://pmc.ncbi.nlm.nih.gov/articles/PMC12205674/]
- 18. Checking counterfeiting of pharmaceutical products by ... [https://www.sciencedirect.com/science/article/abs/pii/S1386142521002869]
- 19. Difference IR vs FTIR [https://www.bruker.com/en/products-and-solutions/infrared-and-raman/ft-ir-routine-spectrometer/what-is-ft-ir-spectroscopy/difference-ir-vs-ftir.html]
- 20. What Does Performance Qualification Mean for Infrared ... [https://www.spectroscopyonline.com/view/what-does-performance-qualification-mean-infrared-instruments]
- 21. 4300 Handheld FTIR Spectrometer [https://www.agilent.com/en/product/molecular-spectroscopy/ftir-spectroscopy/ftir-compact-portable-systems/4300-handheld-ftir?srsltid=AfmBOorAABOjAHpUsCQOQy_A0S3C2G557fSEmbFSa-2xEOx4BtLeRzFp]
- 22. MOBILE-IR II FT-IR Spectrometer [https://www.bruker.com/en/products-and-solutions/infrared-and-raman/ft-ir-routine-spectrometer/mobile-ir-ii-ft-ir-spectrometer.html]
- 23. Portable vs. Benchtop NIR – Which One Will Lead the ... [https://www.nirlab.com/portable-vs-benchtop-nir-which-one-will-lead-the-future-of-spectroscopy/]
- 24. Detection Technology - NCBI - NIH [https://www.ncbi.nlm.nih.gov/books/NBK202524/]
- 25. Fourier-transform infrared spectroscopy: A universal optical ... [https://www.sciencedirect.com/science/article/abs/pii/S1572100023003332]
- 26. Rapid diagnosis of COVID-19 using FT-IR ATR spectroscopy ... [https://pmc.ncbi.nlm.nih.gov/articles/PMC8505540/]
- 27. Comparison of Mid-Infrared Handheld and Benchtop ... [https://pmc.ncbi.nlm.nih.gov/articles/PMC10525239/]
- 28. A Review of the Latest Research Applications Using FT-IR ... [https://www.spectroscopyonline.com/view/a-review-of-the-latest-research-applications-using-ft-ir-spectroscopy]
- 29. AI-Assisted Detection of Biomarkers by Sensors and ... [https://pmc.ncbi.nlm.nih.gov/articles/PMC11274923/]
- 30. Infrared spectroscopy in pharmacy [https://www.sciencedirect.com/science/article/abs/pii/S092420319900017X]
- 31. A Portable Infrared Attenuated Total Reflection ... [https://pmc.ncbi.nlm.nih.gov/articles/PMC10478342/]
- 32. Infrared spectroscopy technique for quantification of ... [https://pmc.ncbi.nlm.nih.gov/articles/PMC7832193/]
- 33. Setting new benchmarks in AI-driven infrared structure ... [https://pubs.rsc.org/en/content/articlehtml/2025/dd/d5dd00131e]
- 34. Lab Vs Portable Analysis: Pros And Cons [https://www.portableas.com/news/lab-vs-portable-analysis-pros-and-cons/]
- 35. Comparing the qualitative performances of handheld NIR ... [https://www.sciencedirect.com/science/article/abs/pii/S0039914019304382]
- 36. Experimental study on online detection of near-infrared ... [https://www.sciencedirect.com/science/article/abs/pii/S1773224724011973]
- 37. The Best Infrared and FTIR Spectroscopy Systems [https://www.labx.com/resources/the-best-infrared-and-ftir-spectroscopy-systems-a-buyers-review-of-price-and-features/4826]
- 38. A portable microcontroller-enabled spectroscopy sensor ... [https://pubs.rsc.org/en/content/articlehtml/2025/ma/d4ma00925h]
- 39. Using Mid-Infrared Spectroscopy to Optimize Throughput ... [https://www.mdpi.com/2076-3298/9/12/149]
- 40. Exploring the Steps of Infrared (IR) Spectral Analysis [https://pmc.ncbi.nlm.nih.gov/articles/PMC10574384/]
- 41. Comparison of Portable and Bench-Top Spectrometers for Mid ... [https://pmc.ncbi.nlm.nih.gov/articles/PMC5948483/]
- 42. 4300 Handheld FTIR Spectrometer [https://www.agilent.com/en/product/molecular-spectroscopy/ftir-spectroscopy/ftir-compact-portable-systems/4300-handheld-ftir?srsltid=AfmBOopJ7e2SmMSQf1ENcvBh9lPcGEZb-h6lrN_T8XboJg8jJ4uIMctG]
- 43. Guide to Applications of IR Spectroscopy [https://www.bruker.com/en/products-and-solutions/infrared-and-raman/guide-to-applications-of-ir-spectroscopy.html]
- 44. Robustness of calibration model for prediction of lignin ... [https://pmc.ncbi.nlm.nih.gov/articles/PMC10009271/]
- 45. Development of robust calibration models in near infra-red ... [https://www.sciencedirect.com/science/article/abs/pii/S0003267000007182]
- 46. A comparative study between Near-Infrared (NIR) ... [https://pmc.ncbi.nlm.nih.gov/articles/PMC11936202/]
- 47. Serum Fourier-Transform Infrared Spectroscopy with Machine ... [https://pmc.ncbi.nlm.nih.gov/articles/PMC12606736/]
- 48. Portable Infrared Spectrometers Rival Lab Accuracy for ... [https://www.spectroscopyonline.com/view/portable-infrared-spectrometers-rival-lab-accuracy-for-soil-analysis-using-smart-calibration-transfer]
- 49. Comparative study of laboratory and industrialized near- ... [https://www.sciencedirect.com/science/article/abs/pii/S0026265X25020004]
- 50. Wearable fNIRS Sensor Tracks Cognitive Fatigue in Real ... [https://www.spectroscopyonline.com/view/wearable-fnirs-sensor-tracks-cognitive-fatigue-in-real-time]
- 51. IR Spectroscopy Market Size, Trends & Forecast 2025-2035 [https://www.futuremarketinsights.com/reports/ir-spectroscopy-market]
- 52. IR Spectroscopy Market Size, Share & Growth Report [https://www.marketsandmarkets.com/Market-Reports/ir-spectroscopy-market-42486905.html]
- 53. IR Spectroscopy Market Report 2025 (Global Edition) [https://www.cognitivemarketresearch.com/ir-spectroscopy-market-report]
- 54. A comparative study between Near-Infrared (NIR ... [https://journals.plos.org/plosone/article?id=10.1371/journal.pone.0319523]
- 55. Dataset of near-infrared spectral data of illicit-drugs and ... [https://pmc.ncbi.nlm.nih.gov/articles/PMC9679452/]
- 56. The Future of Portable Spectroscopy [https://www.spectroscopyonline.com/view/future-portable-spectroscopy]
- 57. Portable FT-IR and Raman Spectroscopy for Explosives ... [https://www.spectroscopyonline.com/view/portable-ft-ir-and-raman-spectroscopy-explosives-identification-1]