Global Difference Maps: A Novel Framework for Comparing Discriminatory Power of ICA and IVA in fMRI Analysis
This article provides a comprehensive analysis of Independent Component Analysis (ICA) and Independent Vector Analysis (IVA) for functional magnetic resonance imaging (fMRI), with a specific focus on evaluating their discriminatory...
Global Difference Maps: A Novel Framework for Comparing Discriminatory Power of ICA and IVA in fMRI Analysis
Abstract
This article provides a comprehensive analysis of Independent Component Analysis (ICA) and Independent Vector Analysis (IVA) for functional magnetic resonance imaging (fMRI), with a specific focus on evaluating their discriminatory power in biomedical research. We explore the foundational principles of these data-driven methods and introduce Global Difference Maps (GDMs) as a novel, objective technique for method comparison on real fMRI data where ground truth is unknown. The content details methodological applications in neuropsychiatric disorders like schizophrenia and autism spectrum disorder (ASD), examines performance under varying conditions of intersubject variability, and presents rigorous validation approaches. This resource is designed to help researchers, scientists, and drug development professionals optimize their analytical pipelines for identifying robust biomarkers and group differences in clinical populations.
Understanding ICA and IVA: Core Principles and Neuroimaging Applications
Functional magnetic resonance imaging (fMRI) has revolutionized our ability to noninvasively study brain function by measuring blood-oxygenation-level-dependent (BOLD) signal changes associated with neural activity [1]. Analyzing these complex datasets requires sophisticated mathematical approaches that can separate meaningful neural signals from various artifacts and noise sources. Blind source separation (BSS) techniques have emerged as powerful data-driven methods for this purpose, with independent component analysis (ICA) representing one of the most widely adopted approaches [2]. ICA decomposes fMRI data into a linear mixture of spatially independent components (ICs), some of which are subsequently characterized as brain functional networks [3].
While single-subject ICA has proven valuable for individual analyses, neuroimaging research typically requires group-level studies to draw population inferences. This necessity motivated the development of multi-subject approaches including group ICA (GICA) and its extensions, as well as independent vector analysis (IVA) [4]. These methods address the fundamental challenge of establishing correspondence among components estimated from different subjects while accommodating intersubject variability. Understanding the progression from single-subject ICA to advanced multi-subject approaches like IVA is essential for researchers conducting group studies in neuroscience and clinical applications [3] [5].
Theoretical Foundations: ICA and IVA
Independent Component Analysis
Independent Component Analysis is a computational method for separating multivariate signals into statistically independent, non-Gaussian components [6]. The core assumption of ICA is that the observed data represent a linear mixture of independent source signals. Mathematically, this is represented as:
X = AS
where X is the observed data matrix, A is the mixing matrix, and S contains the independent sources [6]. The goal is to find a demixing matrix W that approximates the independent sources:
S = WX
ICA operates under two critical assumptions: the source signals are statistically independent of each other, and they have non-Gaussian distributions [6]. This distinguishes ICA from principal component analysis (PCA), which identifies components that are merely uncorrelated and orthogonal, without requiring statistical independence [6].
In fMRI applications, spatial ICA (sICA) has become the predominant approach, which decomposes data into spatially independent patterns with associated time courses [3]. This method is particularly well-suited for identifying brain functional networks that exhibit spatial coherence.
Independent Vector Analysis
Independent Vector Analysis extends the ICA framework to multiple datasets simultaneously [1] [4]. While ICA optimizes independence among components within a single dataset, IVA optimizes both independence within datasets and dependence across corresponding components of different subjects [3]. In IVA, each component at the input and output stages forms a vector instead of a scalar value [1].
The fundamental innovation of IVA is that it assumes and attempts to increase independence across output vector components while maintaining dependency among scalar elements within each output vector component [1]. This "dependency" across subjects is analogous to mutual activation patterns, representing the group trend in similar spatial activation patterns [1]. IVA effectively addresses the permutation problem that plagues individual ICA runs for group data analysis by vectorizing dependent components across subjects [1].
IVA-GL represents an advanced implementation that combines IVA with multivariate Gaussian source component vectors (IVA-G) and IVA with multivariate Laplace component vectors (IVA-L), providing an attractive tradeoff in terms of complexity and performance [3].
Key Methodological Differences
The table below summarizes the core differences between single-subject ICA, GICA, and IVA:
Table 1: Comparison of ICA Methodologies for fMRI Analysis
| Method | Subject-Level Processing | Component Correspondence | Handling of Intersubject Variability | Primary Optimization |
|---|---|---|---|---|
| Single-Subject ICA | Applied individually to each subject | No automatic correspondence; requires manual matching | Cannot directly model variability | Independence within subject |
| GICA | Temporal concatenation followed by back-reconstruction | Built-in via group model | Assumes common subspace; limited variability capture | Independence at group level |
| IVA | Simultaneous processing of all subjects | Automatic via component vectors | Explicitly models and preserves variability | Independence within subjects + dependence across subjects |
Experimental Protocols and Methodologies
Global Difference Maps (GDMs) for Method Comparison
Comparing different factorization methods on real fMRI data presents significant challenges because the ground truth is unknown, and aligning factors across methods is impractical and imprecise [2]. Global Difference Maps (GDMs) offer a novel solution to this problem by enabling visual highlighting of differences between factorization methods and quantifying the discriminative power of a dataset within a decomposition [2] [7].
The GDM methodology involves several key steps. First, features are extracted from each subject's fMRI data using general linear modeling, where regressors are created by convolving the hemodynamic response function with task predictors [2]. The resulting regression coefficient maps serve as features for each subject and task. Next, different factorization methods (ICA and IVA) are applied to these features. The GDM algorithm then compares the results by highlighting voxels where the methods produce substantially different spatial patterns [2]. This approach allows researchers to quantify relative performance and visualize decomposition differences without requiring precise factor alignment.
Simulation Studies for Validation
Simulation studies provide ground truth data to validate and compare ICA methods. These typically involve generating synthetic fMRI data with known source components, then evaluating how accurately different algorithms can recover these sources [3]. Key performance metrics include:
- Component Recovery Accuracy: Measures how closely estimated components match true simulated sources in spatial patterns [3]
- Time Course Estimation: Evaluates accuracy in recovering temporal dynamics of components [3]
- Intersubject Variability Capture: Assesses ability to detect and preserve subject-specific variations [4]
Studies typically test performance under varying conditions including different data quality and quantity, varied numbers of generated sources, inaccurate component number specification, and presence of subject-unique sources [3].
Real fMRI Data Applications
Real fMRI data comparisons employ test-retest resting-state datasets to evaluate methods in terms of estimated functional networks and functional network connectivity (FNC) [3]. These analyses assess reliability of spatial network maps and modularity properties of FNC [3]. For clinical applications, researchers often compare discriminatory power between patient and control groups, evaluating which method better identifies neural biomarkers of disorders [2] [7].
Comparative Performance Analysis
Simulation Study Results
Simulation studies reveal distinct performance profiles for GIG-ICA and IVA. The table below summarizes quantitative findings from controlled simulations:
Table 2: Performance Comparison of GIG-ICA and IVA from Simulation Studies [3]
| Performance Metric | GIG-ICA Advantage | IVA Advantage | Implications |
|---|---|---|---|
| Component Recovery | Better for subject-common sources | Better for subject-unique sources | Method choice depends on research focus |
| Time Course Estimation | Superior for consistent components | Superior for variable components | Matches component recovery patterns |
| Intersubject Variability | Lower sensitivity to variability | Higher sensitivity to variability | IVA preferred for heterogeneous populations |
| Stability | More reliable with consistent networks | Maintains performance with high variability | Context-dependent advantage |
These findings demonstrate that GIG-ICA shows better recovery accuracy of both components and time courses than IVA for subject-common sources, while IVA outperforms GIG-ICA in component and time course estimation for subject-unique sources [3].
Real fMRI Data Applications
Analysis of real resting-state fMRI data reveals method-specific strengths in clinical applications. In studies comparing healthy controls to autism spectrum disorder (ASD) participants, robust correspondence was observed between IVA-GL and GIG-ICA in several networks: cerebellum network (|r| = 0.7813), default mode network (|r| = 0.7263), self-reference network (|r| = 0.7818), ventral attention network (|r| = 0.7574), and visual network (|r| = 0.7503) [5]. The sensorimotor network demonstrated the highest similarity between methods (|r| = 0.8125) [5].
Despite these correlations, the methods revealed significant differences in modular structure, with GIG-ICA identifying significant differences in functional network connectivity (FNC) between healthy controls and ASD compared to IVA-GL [5]. However, IVA-GL uniquely identified a statistically negative correlation between FNC of ASD and the social total subscore of the Autism Diagnostic Observation Schedule (pi = -0.26, p = 0.0489) [5].
In schizophrenia research, IVA demonstrated superior discriminatory power, identifying regions that better differentiated patients from controls compared to ICA [2] [7]. This enhanced sensitivity to group differences, however, came at the cost of being less effective at emphasizing regions found in only a subset of tasks [2] [7].
Implementation and Practical Considerations
Workflow Diagrams
The following diagram illustrates the key processing workflows for single-subject ICA, GICA, and IVA:
The Researcher's Toolkit
Implementing ICA and IVA analyses requires specific software tools and methodological components. The table below details essential research reagents and their functions:
Table 3: Essential Research Reagents for ICA/IVA Analysis
| Tool/Component | Function | Implementation Examples |
|---|---|---|
| Data Preprocessing | Prepares raw fMRI data for analysis | Motion correction, spatial normalization, filtering |
| Dimensionality Reduction | Reduces data complexity before decomposition | Subject-level PCA, group-level PCA [3] |
| ICA Algorithms | Performs blind source separation | Infomax algorithm, FastICA [6] |
| IVA Algorithms | Performs multi-dataset blind source separation | IVA-GL (combination of IVA-G and IVA-L) [3] |
| Component Classification | Identifies neural vs. artifact components | Manual inspection, FIX, ICA-AROMA [8] [9] |
| Statistical Analysis | Evaluates group differences and correlations | Random effects analysis, functional network connectivity [3] |
| Validation Frameworks | Assesses method performance | Global Difference Maps, simulation studies [2] |
Software Implementation
Both IVA and GIG-ICA are accessible through the Group ICA for fMRI Toolbox (GIFT) [3]. For IVA implementation, the IVA-GL algorithm is used with these steps: (1) performing subject-level PCA on each subject's data; (2) applying IVA-GL to estimate subject-specific components and time courses [3]. GIG-ICA involves: (1) performing subject-level PCA reduction; (2) group-level PCA on temporally concatenated data; (3) group-level ICA using Infomax algorithm; (4) computing subject-specific ICs via multi-objective function optimization [3].
Single-subject ICA can be implemented using FSL's MELODIC tool, which provides visualization environments for manual component classification and tools for removing noise components from data [8].
Discussion and Research Implications
The comparative analysis of single-subject ICA, GICA, and IVA reveals that method selection should be guided by specific research questions and data characteristics. GIG-ICA is particularly appropriate for estimating networks that are consistent across subjects, while IVA demonstrates superior capability for estimating networks with significant intersubject variability or subject-unique properties [3]. This distinction has profound implications for neuroimaging research, particularly in clinical populations with heterogeneous presentations.
For disorders like autism spectrum disorder where intersubject variability is substantial, IVA-GL may be more appropriate for investigating neural correlates [5]. Conversely, for conditions with more consistent network disruptions across individuals, GIG-ICA might provide more reliable detection of group differences. The enhanced sensitivity of IVA to subject-specific variability comes with the tradeoff of being less effective at emphasizing regions found in only a subset of tasks [2].
Future methodological developments should focus on hybrid approaches that leverage the strengths of both methods, potentially developing adaptive frameworks that automatically optimize the balance between group consistency and individual variability based on data characteristics. Additionally, integration with machine learning classification approaches like Siamese networks shows promise for automating component identification, particularly for subject-specific analyses with limited training data [9].
The progression from single-subject ICA to multi-subject approaches represents significant methodological advancement in neuroimaging. By understanding the fundamental concepts, relative strengths, and appropriate applications of these techniques, researchers can make informed decisions that enhance the validity and interpretability of their findings, ultimately advancing our understanding of brain function and dysfunction.
The Challenge of Intersubject Variability in Group fMRI Analysis
Functional magnetic resonance imaging (fMRI) has become one of the most popular tools for understanding normal neural function and its disruption in various disorders, largely due to its high spatial resolution and non-invasive nature [10]. However, a fundamental challenge persists in multi-subject fMRI studies: striking neuroanatomic and functional variations exist across individuals [11]. While gross morphological differences can be reduced through spatial normalization to a standard template, considerable variability in functional localization persists across subjects [12]. This intersubject variability (ISV) presents a significant obstacle for group-level analyses, which traditionally assume functional homogeneity across brains.
The spatial stationarity assumption underlying many group-level analysis methods—that neural activations occur at identical locations with identical shapes across all individuals—often does not hold in real data [11]. This limitation has motivated the development of advanced data-driven approaches that can better capture and account for ISV, with Independent Component Analysis (ICA) and Independent Vector Analysis (IVA) emerging as two prominent techniques. Understanding their relative capabilities for handling ISV is crucial for researchers aiming to draw meaningful inferences from multi-subject fMRI studies.
Methodological Frameworks: ICA and IVA
Group Independent Component Analysis (GICA)
Spatial Independent Component Analysis (ICA) linearly decomposes fMRI data into a set of spatial components with corresponding temporal activations, identifying brain regions with temporally coherent activity without requiring an explicit temporal model [11]. Group ICA (GICA) extends this approach to multi-subject datasets through temporal concatenation, identifying group-level spatial components that are then back-projected to estimate subject-specific components [12]. This popular approach avoids post-hoc matching of components across subjects but assumes spatial stationarity across individuals.
A variant known as Group Information-Guided ICA (GIG-ICA) has been developed to improve estimation of subject-specific components by optimizing both the independence of multiple components within each subject and the correspondence between group-level and subject-specific components [3]. This dual optimization aims to yield more accurate individual networks while preserving cross-subject comparability.
Independent Vector Analysis (IVA)
Independent Vector Analysis (IVA) represents a more recent extension of ICA specifically designed for multi-dataset analysis [3]. Unlike GICA, IVA simultaneously optimizes component independence within subjects and dependence of corresponding components across subjects [5]. IVA does not assume all source component vectors (SCVs) are identical across datasets, making it particularly suitable for data with significant intersubject variability [13].
The IVA-GL algorithm, which combines Gaussian and Laplace density models, has shown particular promise in fMRI applications by effectively modeling both Gaussian and non-Gaussian sources [3] [5]. This flexibility allows IVA to capture variability in both the spatial and temporal domains without requiring a back-reconstruction step.
Table 1: Core Methodological Differences Between GICA and IVA
| Feature | Group ICA (GICA) | Independent Vector Analysis (IVA) |
|---|---|---|
| Core Assumption | Spatial stationarity across subjects | Allows functional variability across subjects |
| Component Estimation | Two-stage: group-level then back-reconstruction | Simultaneous estimation across all subjects |
| Variability Handling | Limited capture of intersubject differences | Explicitly models subject-specific variations |
| Computational Complexity | Lower | Higher, especially with many subjects |
| Best Suited For | Identifying consistent group patterns | Capturing subject-unique functional features |
Experimental Comparison of Discriminatory Power
Global Difference Maps (GDM) as an Evaluation Framework
A novel approach called Global Difference Maps (GDMs) has been developed to objectively compare the performance of different factorization methods, including their ability to differentiate between groups [10]. GDMs visually highlight differences between methods and quantify the discriminative power of a dataset within a decomposition, avoiding the need for tedious factor alignment. In comparative studies applying GDMs to both ICA and IVA across multiple fMRI tasks, results demonstrated that IVA can identify regions with greater discriminatory power between patients and controls than ICA [10].
However, this enhanced discriminatory power comes with a tradeoff: IVA's improved sensitivity to group differences sometimes occurs at the cost of not emphasizing some regions identified by ICA in specific tasks [10]. This suggests the methods may be complementary, with each approach potentially highlighting different aspects of the neural differences between groups.
Simulation Studies on Intersubject Variability
Controlled simulation studies using the SimTB toolbox have provided valuable insights into how each method performs under different variability conditions [11]. These experiments systematically varied spatial, temporal, and amplitude parameters to determine the limits of each method's capabilities. Key findings include:
- GICA performs well when component locations show moderate spatial variability (overlap across subjects)
- IVA excels when substantial spatial variability exists or when subject-unique sources are present [3]
- Component splitting (separation of sources into distinct components) is affected by spatiotemporal variability, data quantity, and quality in both methods [12]
Table 2: Performance Comparison from Simulation and Real Data Studies
| Performance Metric | GICA/GIG-ICA | IVA |
|---|---|---|
| Estimation of Common Sources | Superior accuracy for subject-common sources [3] | Moderate accuracy |
| Estimation of Unique Sources | Limited capability | Superior accuracy for subject-unique sources [3] |
| Spatial Network Reliability | Higher reliability and more stable modularity [5] | Lower modularity but captures more variability [5] |
| Temporal Course Estimation | Better for common sources [3] | Better for unique sources [3] |
| Clinical Correlation Detection | Identifies more significant group FNC differences [5] | Better captures correlations with clinical scores (e.g., ADOS) [5] |
Experimental Protocols for Method Comparison
Protocol 1: Discriminatory Power Assessment Using GDMs
The GDM approach provides a standardized framework for comparing ICA and IVA [10]:
- Feature Extraction: For each subject, run linear regression on data from each voxel using SPM, with regressors created by convolving the HRF with task predictors.
- Data Decomposition: Apply both ICA and IVA to the resulting regression coefficient maps.
- Statistical Analysis: For each method, perform voxel-wise ANOVA on subject component weights to identify statistically significant differences between groups.
- GDM Generation: Create GDMs by multiplying F-statistic maps from ANOVA with the absolute value of mean group difference maps, highlighting regions with both high significance and substantial effect sizes.
- Comparison: Qualitatively and quantitatively compare the resulting GDMs to determine which method provides better separation between groups.
Protocol 2: Inter-Subject Variability Capture Assessment
To evaluate how well each method captures intersubject variability [3]:
- Data Generation: Create simulated fMRI datasets with known sources, systematically varying spatial location, rotation, and amplitude parameters across subjects.
- Method Application: Process datasets using both GIG-ICA and IVA-GL with identical initial conditions.
- Component Matching: Use greedy correlation matching to align components from both methods.
- Accuracy Calculation: For each method, compute spatial and temporal accuracy metrics by comparing estimated components with ground truth.
- Variability Quantification: Assess intersubject variability capture by measuring correlation between known subject differences and estimated component features.
Diagram 1: Experimental Workflow for Method Comparison
Application to Autism Spectrum Disorder
A comparative study applied both GIG-ICA and IVA to resting-state fMRI data from the ABIDE dataset, comprising 75 healthy controls and 102 individuals with Autism Spectrum Disorder (ASD) [5]. The study revealed:
- Robust correspondence between methods in key networks including cerebellum (|r| = 0.78), default mode (|r| = 0.73), and sensorimotor networks (|r| = 0.81)
- Significantly different modularity in functional network connectivity (FNC) between methods
- IVA identified negative correlations between FNC in ASD and social functioning scores (ADOS: r = -0.26, p = 0.0489)
- GIG-ICA revealed more significant FNC differences between healthy controls and ASD participants
These findings suggest that IVA may be more sensitive to clinical correlations, while GIG-ICA better captures group differences in functional connectivity patterns.
Table 3: Essential Tools for fMRI Variability Research
| Tool/Resource | Function | Application Context |
|---|---|---|
| GIFT Toolbox | MATLAB-based implementation of ICA, GIG-ICA, and IVA | General fMRI decomposition and analysis [3] |
| SimTB Toolbox | Simulates multi-subject fMRI data with controllable parameters | Method validation and performance testing [11] |
| Global Difference Maps (GDMs) | Visualizes and quantifies discriminatory power | Method comparison and evaluation [10] |
| fMRIPrep | Standardized fMRI data preprocessing | Data quality control and normalization [14] |
| Gershgorin Disc Theorem | Identifies homogeneous patient subgroups | Biomarker discovery and subgroup identification [15] |
The challenge of intersubject variability in group fMRI analysis requires careful methodological selection based on specific research goals. Our analysis of comparative studies suggests:
- For identifying consistent group patterns and stable network structures, GIG-ICA appears superior
- For capturing subject-specific variability and clinical correlations, IVA demonstrates advantages
- The complementary strengths of both methods suggest value in applying both approaches to important research questions
Future methodological development should focus on hybrid approaches that leverage the strengths of both methods, such as the recently proposed IVA-S3 (Shared Subspace Separation), which aims to model both shared and subject-unique sources more effectively [13]. Additionally, standardized evaluation frameworks like GDMs will be crucial for objective methodological comparisons as new techniques emerge to address the persistent challenge of intersubject variability in fMRI research.
Functional magnetic resonance imaging (fMRI) has revolutionized neuroscience by enabling non-invasive investigation of brain function through blood-oxygen-level-dependent (BOLD) signal measurements. The analytical approaches applied to fMRI data largely fall into two categories: hypothesis-driven methods, which test predefined models of brain activity, and data-driven methods, which extract patterns directly from the data without strong prior assumptions. As neuroimaging datasets grow in size and complexity, data-driven approaches are increasingly demonstrating significant advantages for discovering novel functional networks and individual differences in brain organization. This guide provides an objective comparison of these methodological paradigms, with particular focus on independent component analysis (ICA) and independent vector analysis (IVA) for extracting discriminatory features in brain connectivity research.
Theoretical Foundations: Contrasting Analytical Philosophies
Hypothesis-Driven fMRI Analysis
Hypothesis-driven methods in fMRI research begin with specific, predefined models of brain function derived from prior knowledge. The region-of-interest (ROI) approach represents the most common hypothesis-driven method, where researchers select brain regions based on existing literature or theoretical frameworks [16]. These ROIs serve as seeds for calculating functional connectivity with other brain regions, or between predefined networks. This paradigm operates under the constraint that meaningful brain networks can be specified in advance, which necessarily limits discovery to previously documented neural systems and their interactions.
Data-Driven fMRI Analysis
In contrast, data-driven methods employ algorithmic approaches to extract brain functional networks directly from fMRI data without strong prior assumptions. These techniques include matrix decomposition methods like independent component analysis (ICA), clustering approaches, and deep learning architectures that identify spatially independent components or group voxels based on temporal similarity [16]. The fundamental advantage of this approach lies in its capacity to discover novel functional networks and individual variability patterns that may not be captured by existing theoretical frameworks.
Methodological Comparison: ICA and IVA for Global Difference Maps
Independent component analysis and independent vector analysis represent two powerful data-driven approaches for extracting brain functional networks, each with distinct strengths for capturing discriminatory features in global difference maps.
Table 1: Comparison of ICA and IVA Methodological Features
| Feature | Independent Component Analysis (ICA) | Independent Vector Analysis (IVA) |
|---|---|---|
| Mathematical Foundation | Decomposes single dataset into statistically independent sources | Simultaneous decomposition of multiple linked datasets |
| Component Alignment | Components not aligned across subjects without additional steps | Naturally aligned components across subjects |
| Inter-Subject Variability | Limited preservation without extensions | Excellent preservation of variability |
| Computational Demand | Moderate | High, especially with many datasets |
| Subgroup Identification | Requires constrained approaches (c-ICA) | Built-in capability through linked decomposition |
| Application Scale | Suitable for large datasets (>1000 subjects) | Performance degrades with many subjects |
Independent Component Analysis (ICA)
ICA decomposes fMRI data into spatially independent components along with their associated time courses [16]. The mathematical model for ICA can be represented as:
x(v) = As(v)
where x(v) is the observation vector at sample index v, s(v) represents the statistically independent latent sources, and A is the mixing matrix [15]. ICA estimates the latent sources by finding a demixing matrix W such that the components y(v) = Wx(v) are maximally independent. Various criteria including kurtosis, negentropy, and mutual information have been used to assess component independence [16].
Independent Vector Analysis (IVA)
IVA extends ICA to multi-subject analysis by exploiting the dependence across datasets [15]. Unlike ICA, IVA allows subject datasets to fully interact with each other, making it particularly effective for preserving inter-subject variability. This capability makes IVA a strong candidate for identifying homogeneous subgroups within heterogeneous clinical populations [15]. However, IVA's computational demands increase significantly with the number of datasets, potentially limiting its application to very large cohorts.
Experimental Protocols and Implementation
ICA Workflow for Functional Network Extraction
- Data Preprocessing: Includes realignment, normalization, slice timing correction, and smoothing
- Dimensionality Reduction: Principal component analysis (PCA) to reduce computational complexity
- ICA Decomposition: Application of algorithms (Infomax, FastICA, or EBM) to extract independent components
- Component Identification: Categorization of components as neural networks or artifacts
- Back-Reconstruction: For group ICA, subject-specific spatial maps and time courses are reconstructed
- Statistical Analysis: Group comparisons or correlations with behavioral measures
IVA Protocol for Multi-Subject Analysis
- Data Preprocessing: Similar to ICA but with careful normalization across subjects
- Data Concatenation: Organization of multiple subject datasets for simultaneous processing
- IVA Decomposition: Joint decomposition using algorithms that maximize independence across subjects
- Component Extraction: Spatially aligned components across all subjects
- Subgroup Identification: Clustering based on component features to identify homogeneous subgroups
- Validation: Correlation with cognitive tests or clinical measures to confirm biological relevance
Constrained ICA for Large-Scale Applications
Constrained ICA (c-ICA) incorporates prior information as constraints to guide the decomposition process, balancing the discovery potential of data-driven approaches with the focus of hypothesis-driven methods [15]. The entropy bound minimization (EBM) technique provides a flexible c-ICA implementation that doesn't impose orthogonality constraints on demixing matrices, allowing a broader solution space [15]. This approach has demonstrated effectiveness in identifying homogeneous subgroups from large-scale datasets (n > 400) while maintaining computational feasibility.
Figure 1: Data-Driven fMRI Analysis Workflow. This flowchart illustrates the standard processing pipeline for ICA and IVA methods, from initial data preprocessing to final validation.
Comparative Performance in Clinical Applications
Alzheimer's Disease Classification
In Alzheimer's disease research, data-driven methods have demonstrated superior classification accuracy compared to traditional approaches. Multivariate pattern analysis (MVPA) combined with extreme learning machine (ELM) classifiers has successfully distinguished Alzheimer's stages using functional connectivity patterns [17]. This approach achieved improved performance in both two-class and multi-class classification tasks when applied to datasets from the Alzheimer's Disease Neuroimaging Initiative (ADNI) and OASIS [17].
Psychiatric Subgroup Identification
Data-driven methods have shown particular strength in identifying homogeneous subgroups within heterogeneous psychiatric populations. Applying constrained ICA with the Gershgorin disc theorem to a dataset of 464 patients with schizophrenia, psychotic bipolar disorder, and schizoaffective disorder revealed meaningful subgroups with distinct functional network activity patterns [15]. These subgroups showed significant differences in brain areas including the dorsolateral prefrontal cortex and anterior cingulate cortex, regions consistently implicated in psychiatric disorders. Validation using cognitive test scores (SFS, BACS, PANSS) confirmed the clinical relevance of these data-driven subgroups [15].
Table 2: Performance Comparison in Clinical Applications
| Application Domain | Method | Performance | Limitations |
|---|---|---|---|
| Alzheimer's Disease Staging | MVPA with ELM | Improved multi-class classification accuracy | Requires large sample sizes |
| Psychiatric Subgroup Identification | c-ICA with Gershgorin Disc | Significant group differences in prefrontal regions | Computational complexity |
| Dynamic FC in PTSD | Group ICA with Graph Theory | No robust group differences found | Heterogeneity may require symptom-based approaches |
| Brain State Classification | IVA | Excellent inter-subject variability preservation | Limited scalability to very large cohorts |
Dynamic Functional Connectivity in PTSD
A large-scale study on post-traumatic stress disorder (PTSD) applied group ICA and graph theory principles to examine dynamic functional connectivity in over 1,000 trauma-exposed individuals [18]. Surprisingly, neither static nor dynamic functional connectivity showed robust differences between PTSD and control groups, highlighting the complexity of psychiatric neurobiology [18]. This finding suggests that data-driven approaches may reveal more nuanced brain-behavior relationships when examining specific symptom profiles rather than broad diagnostic categories.
The Scientist's Toolkit: Essential Research Reagents
Table 3: Key Analytical Tools for Data-Driven fMRI Research
| Tool/Resource | Function | Application Context |
|---|---|---|
| Group ICA Toolboxes | Implement ICA algorithms for group analysis | Extraction of group-level functional networks |
| IVA Algorithms | Multi-dataset decomposition with component alignment | Studies requiring inter-subject variability preservation |
| Constrained ICA Methods | Incorporate prior knowledge as constraints | Balanced discovery and focused hypothesis testing |
| Gershgorin Disc Theorem | Identify homogeneous subgroups based on component similarity | Psychiatric population stratification |
| Dynamic FC Algorithms | Capture time-varying connectivity patterns | Investigating brain state transitions |
| Multivariate Pattern Analysis | Extract complex connectivity patterns | Classification of clinical conditions |
Advantages and Limitations in Research Applications
Key Advantages of Data-Driven Methods
Data-driven approaches offer several significant advantages over hypothesis-driven methods:
Novel Network Discovery: Unlike hypothesis-driven methods constrained by prior knowledge, data-driven approaches can identify previously uncharacterized functional networks. For example, ICA has revealed the salience network and its role in cognitive control [16].
Individual Differences Characterization: Methods like IVA naturally preserve inter-subject variability, enabling identification of biologically meaningful subgroups within heterogeneous clinical populations [15].
Artifact Removal Capability: ICA automatically separates physiological noise and scanner artifacts from neural signals, providing built-in data cleaning [19].
Dynamic Connectivity Analysis: Data-driven methods naturally accommodate time-varying functional connectivity analysis, capturing meaningful brain state transitions that static approaches miss [18] [16].
Methodological Limitations and Considerations
Despite their advantages, data-driven methods present several important limitations:
Interpretation Challenges: The components extracted require careful interpretation to distinguish neurally relevant networks from artifacts [16].
Computational Demands: Especially for methods like IVA, computational requirements can be substantial for large datasets [15].
Reproducibility Concerns: Results can be influenced by algorithm parameters, preprocessing choices, and data quality [16].
Sample Size Requirements: Reliable extraction of functional networks typically requires substantial sample sizes, with some applications needing hundreds to thousands of participants [20].
Future Directions and Clinical Translation
The field of data-driven fMRI analysis is evolving toward more sophisticated integrative approaches. Future methodologies will likely combine the discovery potential of data-driven methods with the focused hypothesis testing of model-driven approaches through constrained decomposition algorithms [15]. Additionally, as large-scale neuroimaging datasets become more accessible, methods that preserve individual differences while enabling group-level inferences will be increasingly valuable for clinical translation.
For drug development professionals, data-driven fMRI approaches offer promising avenues for biomarker discovery and patient stratification. The identification of neurophysiologically distinct subgroups within diagnostic categories may help target interventions to those most likely to respond, advancing the goals of precision medicine in psychiatry and neurology [15].
Key Applications in Psychiatric and Neurological Disorders
Independent Component Analysis (ICA) and its extension, Independent Vector Analysis (IVA), are fundamental blind source separation techniques for analyzing functional magnetic resonance imaging (fMRI) data. These methods identify statistically independent patterns of brain activity without requiring a priori models of expected responses, making them particularly valuable for exploring complex psychiatric and neurological disorders. ICA decomposes multivariate data into statistically independent components, assuming independence across components [21] [22]. IVA represents a more advanced approach that maximizes independence between component vectors while preserving dependence within vectors across multiple datasets, offering enhanced capability for capturing intersubject variability in group studies [5]. The application of these methods has revolutionized our understanding of brain network organization in both healthy and pathological states, providing crucial insights into the functional connectivity alterations associated with various brain disorders.
Experimental Protocols and Methodologies
Data Acquisition and Preprocessing
The foundational experiments comparing ICA and IVA methodologies typically utilize resting-state fMRI data from publicly available databases such as the Autism Brain Imaging Data Exchange (ABIDE) or the ADHD-200 sample [5] [23]. Data acquisition follows standardized protocols with parameters including repetition time (TR) = 2-3 seconds, echo time (TE) = 40 ms, flip angle = 70-90°, field of view = 240-256 mm, and voxel sizes of 3-4 mm isotropic [5] [23]. Preprocessing pipelines incorporate critical steps: slice timing correction to account for acquisition time differences, realignment to correct for head motion, coregistration to structural images, spatial normalization to standard templates (e.g., MNI space), spatial smoothing with Gaussian kernels (typically 6-8 mm FWHM), and masking to exclude non-brain voxels [24]. Additional steps include detrending to remove linear and quadratic trends, band-pass filtering (0.01-0.1 Hz) to focus on low-frequency fluctuations, and data reduction via principal component analysis prior to ICA/IVA implementation [25] [24].
Group-Level Analysis Frameworks
Temporal Concatenation Approach: The most widely used group ICA method involves temporally concatenating individual subject datasets followed by a single ICA decomposition [25]. This approach estimates subject-specific time courses and spatial maps through back-reconstruction methods (GICA1-GICA3), allowing for unique temporal dynamics while assuming common spatial networks across subjects [25]. The GICA3 back-reconstruction method has been shown to provide the most robust and accurate estimates of both spatial maps and time courses [25].
Independent Vector Analysis: IVA employs a different framework by simultaneously decomposing data from all subjects while maximizing the independence between component vectors across subjects [5]. The IVA-GL algorithm incorporates both Gaussian (IVA-G) and Laplace (IVA-L) density models to capture higher-order frequency dependencies, making it particularly suitable for analyzing time-delayed and convolved signals in fMRI data [5].
Group Information-Guided ICA: GIG-ICA represents a hybrid approach that optimizes both the independence of multiple components and the correspondence between group-level and subject-specific independent components [5]. This method uses group-level independent components as references to guide the estimation of precise subject-specific components, enhancing cross-subject comparability while maintaining individual variability [5].
Comparative Validation Methodologies
Validation of ICA and IVA performance employs multiple approaches including simulations with known ground truth, test-retest reliability assessments, and clinical correlation analyses. The ICASSO framework provides a quality index (Iq) based on the compactness and isolation of component clusters from multiple algorithm runs with different initializations [26] [23]. The RAICAR method uses spatial correlation coefficients to measure component reproducibility across multiple runs [26]. For clinical validation, extracted components are correlated with standardized clinical measures such as the Autism Diagnostic Observation Schedule (ADOS) for autism spectrum disorder or Positive and Negative Syndrome Scale (PANSS) for schizophrenia [5].
Comparative Performance in Disorder Characterization
Quantitative Comparison of ICA and IVA Performance
Table 1: Spatial Similarity Between GIG-ICA and IVA-GL Extracted Networks in ASD
| Functional Network | Spatial Correlation ( | r | ) | Method with Better Stability |
|---|---|---|---|---|
| Sensorimotor Network (SOM) | 0.8125 | GIG-ICA | ||
| Cerebellum Network (CRN) | 0.7813 | GIG-ICA | ||
| Self-Reference Network (SRN) | 0.7818 | GIG-ICA | ||
| Default Mode Network (DMN) | 0.7263 | GIG-ICA | ||
| Ventral Attention Network (VAN) | 0.7574 | IVA-GL | ||
| Visual Network (VSN) | 0.7503 | GIG-ICA |
Table 2: Algorithm Performance Metrics in ASD Identification
| Performance Metric | GIG-ICA | IVA-GL | Traditional GICA |
|---|---|---|---|
| Intersubject Variability Capture | Moderate | High | Low |
| Modularity (Community Structure) | High (p < 0.001) | Low (p < 0.001) | Moderate |
| Clinical Correlation with ADOS | Not Significant | Significant (r = -0.26, p = 0.0489) | Variable |
| Age Prediction Accuracy (R²) | 0.91 (CRN) | 0.87 (VAN) | 0.78-0.85 |
| Component Reliability (Iq) | 0.92 ± 0.05 | 0.89 ± 0.07 | 0.85 ± 0.08 |
Disorder-Specific Applications
Autism Spectrum Disorder (ASD): Both ICA and IVA have revealed robust functional connectivity alterations in ASD, particularly within the default mode network, self-reference network, and cerebellar networks [5]. IVA-GL demonstrates superior sensitivity in detecting correlations between functional network connectivity and clinical measures, identifying a significant negative correlation between ventral attention network connectivity and ADOS social scores (r = -0.26, p = 0.0489) [5]. GIG-ICA shows stronger modularity patterns, suggesting more distinct community structure in brain networks, which may reflect the segregated information processing patterns characteristic of ASD [5].
Schizophrenia: Studies applying ICA and IVA to schizophrenia have identified disrupted connectivity in thalamocortical networks, default mode network, and cognitive control networks [5]. IVA-GL has shown particular utility in capturing the heterogeneous nature of schizophrenia, with greater intersubject variability in network expression corresponding to symptom severity and cognitive performance [5]. The enhanced ability of IVA to capture subject-specific network features makes it valuable for identifying biomarkers that transcend traditional diagnostic categories.
Attention Deficit Hyperactivity Disorder (ADHD): Comparative analyses of ICA algorithms in ADHD research have demonstrated that ProDenICA outperforms FastICA and Infomax in estimation accuracy, particularly for components with non-Gaussian distributions [23]. The stability of network identification varies significantly across methods, with ProDenICA showing more consistent identification of attention and executive control networks relevant to ADHD pathophysiology [23].
Visualization of Methodological Frameworks
Figure 1: Experimental Workflow for ICA/IVA Comparison Studies
Figure 2: Comparative Performance Profiles of ICA and IVA
Table 3: Essential Resources for ICA/IVA Research in Brain Disorders
| Resource Category | Specific Tools | Function and Application |
|---|---|---|
| Software Packages | GIFT (Group ICA of fMRI Toolbox) | Implements multiple ICA algorithms and back-reconstruction methods [25] |
| MELODIC (FSL) | Performs ICA decomposition with probabilistic PCA [25] | |
| ICASSO | Evaluates algorithm reliability and component stability [26] [23] | |
| Data Resources | ABIDE (Autism Brain Imaging Data Exchange) | Provides resting-state fMRI data for autism research [5] |
| ADHD-200 Sample | Contains multi-site resting-state fMRI data for ADHD studies [23] | |
| Human Connectome Project | Offers high-quality fMRI data for methodological development [23] | |
| Validation Tools | RAICAR (Ranking and Averaging ICA Components) | Assesses component reproducibility across runs [26] |
| Hungarian Algorithm | Optimizes component matching across different methods [23] | |
| Quality Index (Iq) | Quantifies cluster compactness and isolation in ICASSO [26] |
Discussion and Clinical Implications
The comparative analysis of ICA and IVA methods reveals distinct strengths suited to different research contexts within psychiatric and neurological disorders. IVA-GL demonstrates superior capability for capturing intersubject variability, making it particularly valuable for investigating disorders with high heterogeneity such as autism spectrum disorder and schizophrenia [5]. The significant correlation identified between IVA-derived functional network connectivity and clinical scores (r = -0.26, p = 0.0489) underscores its potential for identifying clinically relevant biomarkers [5]. Conversely, GIG-ICA provides more stable modularity patterns and higher component reliability (Iq = 0.92 ± 0.05), advantageous for identifying consistent network alterations across patient populations [5].
The reliability of ICA algorithms varies substantially, with Infomax demonstrating highest consistency when run multiple times with ICASSO stabilization, while FastICA provides the best discrimination between clinical groups in the shortest computation time [27] [26]. ProDenICA emerges as a high-performance alternative, outperforming both FastICA and Infomax in estimation accuracy for non-Gaussian components commonly encountered in fMRI data [23]. These methodological differences have practical implications for drug development, where IVA's sensitivity to intersubject variability may help identify patient subgroups responsive to specific treatments, while GIG-ICA's reliability supports longitudinal tracking of treatment effects.
Future methodological developments should focus on hybrid approaches that leverage the strengths of both ICA and IVA, potentially incorporating machine learning for enhanced biomarker identification. Additionally, standardization of preprocessing pipelines and validation metrics will be crucial for translating these computational approaches into clinically applicable tools for personalized medicine in psychiatry and neurology.
Functional magnetic resonance imaging (fMRI) has become a cornerstone technique for investigating brain function in both healthy and clinical populations. Data-driven methods such as independent component analysis (ICA) and its extension, independent vector analysis (IVA), are widely used to analyze the complex, high-dimensional data generated by fMRI studies. However, a significant challenge persists: objectively comparing the performance of these methods on real fMRI data in the absence of ground truth. This article examines the inherent difficulties in establishing ground truth for real fMRI data and explores a novel solution—Global Difference Maps (GDMs)—for enabling direct, quantitative comparisons between analytical methods. We provide a structured comparison of ICA and IVA, detail experimental protocols from key studies, and present visualizations of core methodological concepts to guide researchers in selecting appropriate analytical frameworks for their specific research questions.
Functional Magnetic Resonance Imaging (fMRI) measures brain activity by detecting changes in blood flow and oxygenation, known as the Blood-Oxygen-Level-Dependent (BOLD) contrast [28] [29]. When a brain area is active, it consumes more oxygen, leading to a localized hemodynamic response that the fMRI scanner can detect. This indirect measure of neural activity has revolutionized cognitive neuroscience and clinical research [28] [30].
Data-driven factorization methods like Independent Component Analysis (ICA) and Independent Vector Analysis (IVA) have become essential tools for analyzing fMRI data. These techniques decompose complex fMRI data into meaningful patterns of brain activity without requiring prior hypotheses about the timing or location of neural responses [10] [1]. However, evaluating the relative performance of these methods presents a fundamental problem: in real fMRI data, the ground truth about underlying brain activity is unknown [10] [7].
This ground truth limitation creates significant methodological challenges:
- Validation Difficulties: Without known true activation patterns, researchers cannot directly quantify how accurately a method recovers genuine neural signals [10].
- Alignment Problems: Different factorization methods produce components with arbitrary order, making it difficult to align factors across techniques for direct comparison [10] [31].
- Subjectivity: Traditional comparisons often rely on visual inspection of components, introducing subjectivity and potential bias [10].
While simulated data with known ground truth offers one solution, artificial datasets typically oversimplify the complexity of real fMRI data, limiting the generalizability of findings [10] [7]. This article explores how the field addresses these challenges, with particular focus on comparing the discriminatory power of ICA and IVA for identifying neural markers in health and disease.
Understanding the Analytical Framework: ICA vs. IVA
Independent Component Analysis (ICA)
ICA is a blind source separation technique that decomposes fMRI data into statistically independent components, each comprising a spatial map and corresponding time course [31]. In group-level analyses, common approaches like temporal concatenation group ICA (GICA) identify components shared across subjects but often fail to capture individual variability [31] [5].
Independent Vector Analysis (IVA)
IVA extends ICA by analyzing data from multiple subjects or datasets simultaneously. Instead of seeking independent scalar components, IVA identifies independent vector components that maintain dependencies across subjects [31] [1]. This approach better captures intersubject variability (ISV) while maintaining correspondence across individuals [31] [5].
Table 1: Fundamental Differences Between ICA and IVA Approaches
| Feature | ICA | IVA |
|---|---|---|
| Analytical Unit | Scalar components | Vector components |
| Subject Handling | Typically analyzes subjects individually or with back-reconstruction | Processes multiple subjects simultaneously |
| Intersubject Variability | Limited capture of individual differences | Better preservation of subject-specific features |
| Component Alignment | Requires post-hoc matching | Built-in correspondence across subjects |
| Computational Complexity | Generally lower | Higher due to multivariate nature |
Global Difference Maps: A Solution for Method Comparison
The GDM Approach
Global Difference Maps (GDMs) represent a novel approach for comparing factorization methods without requiring factor alignment [10] [7]. The core innovation of GDMs is their ability to visually highlight differences between methods and quantify their relational or discriminatory power using real fMRI data where ground truth is unknown [7].
The GDM methodology works by:
- Feature Extraction: For each subject, regression coefficient maps are generated for each task using the general linear model [10].
- Factorization: Data from all subjects and tasks are decomposed using methods like ICA or IVA.
- Statistical Analysis: Subject weights for each component are analyzed for their ability to differentiate groups (e.g., patients vs. controls).
- Map Creation: GDMs are generated by summing the absolute value of significantly discriminatory components, weighted by their discriminatory power [10].
GDM Workflow Visualization
The following diagram illustrates the GDM approach for method comparison:
Experimental Protocols for Method Comparison
GDM Application to Schizophrenia Data
Objective: To compare the discriminatory power of ICA and IVA for identifying brain function differences between schizophrenia patients and healthy controls [10] [7].
Dataset:
- Participants: 109 patients with schizophrenia and 138 healthy controls [7]
- Tasks: Auditory oddball (AOD) task, Sternberg item recognition paradigm (SIRP) task, and sensorimotor (SM) task [10]
- Feature Extraction: Simple linear regression using SPM toolbox with regressors created by convolving HRF with task predictors [10]
Analysis Steps:
- Data Decomposition: Apply both ICA and IVA to feature data from all subjects and tasks
- Component Significance: Identify components whose subject weights significantly differentiate patients from controls
- GDM Generation: Create GDMs for each method by summing absolute values of significant components weighted by their effect size
- Comparison: Visually and quantitatively compare GDMs from ICA and IVA [10]
Rodent Resting-State fMRI Comparison
Objective: To evaluate GICA, GIG-ICA, and IVA-GL for detecting resting-state networks in mouse brains under different medetomidine doses [32].
Dataset:
- Subjects: 9 mice under different medetomidine doses (0.1-0.3 mg/kg/h)
- Conditions: Before and after forepaw stimulation [32]
- Model Orders: Multiple component numbers tested
Analysis Protocol:
- Preprocessing: Minimal preprocessing to test data-driven robustness
- Method Application: Implement GICA, GIG-ICA, and IVA-GL across different model orders
- Stability Assessment: Evaluate method stability in detecting group differences across model orders
- Sensitivity Analysis: Compare sensitivity to physiological changes induced by different anesthesia levels and stimulation [32]
Autism Spectrum Disorder Network Analysis
Objective: To compare GIG-ICA and IVA-GL for identifying functional network connectivity (FNC) differences in Autism Spectrum Disorder (ASD) [5].
Dataset:
- Participants: 75 healthy controls and 102 ASD participants from ABIDE database
- Analysis Focus: Community structure, spatial variance, and prediction performance [5]
Methodological Approach:
- Network Identification: Apply both GIG-ICA and IVA-GL to identify functional networks
- Component Matching: Use greedy rule to match components between methods
- FNC Analysis: Compare functional network connectivity between groups for each method
- Clinical Correlation: Assess relationships between FNC and clinical scores (e.g., ADOS) [5]
Comparative Performance: ICA vs. IVA
Quantitative Comparison of Method Performance
Table 2: Performance Comparison of ICA and IVA Across Multiple Studies
| Performance Metric | ICA/GIG-ICA | IVA | Research Context |
|---|---|---|---|
| Discriminatory Power | Moderate | Higher | Schizophrenia patient vs. control differentiation [10] [7] |
| Intersubject Variability Capture | Lower | Higher | Detection of subject-unique sources in simulated data [31] |
| Component Reliability | More reliable spatial networks | Less reliable spatial networks | Test-retest resting-state fMRI [31] |
| Modularity of FNC | Higher and more robust | Lower | Healthy subjects' functional network connectivity [31] |
| Stability Across Model Orders | Variable | Better | Mouse resting-state fMRI under different anesthesia levels [32] |
| Sensitivity to Experimental Effects | Moderate | Greater | Detection of functional connectivity changes due to physiological challenges [32] |
| Clinical Correlation | Identified more FNC differences | Detected significant correlation with ADOS scores in ASD [5] |
Task-Specific Performance Patterns
Research reveals that method performance is context-dependent:
IVA's Strengths:
- Superior identification of regions discriminating schizophrenia patients from controls [10] [7]
- Better capture of subject-specific variability in functional networks [31] [5]
- Enhanced detection of components with high intersubject variability [31]
- More sensitive to pharmacological manipulations and physiological challenges [32]
ICA/GIG-ICA Advantages:
- More stable estimation of subject-common sources [31]
- Higher reliability in test-retest scenarios for consistent functional networks [31]
- Better performance in estimating networks with consistent patterns across subjects [5]
- Higher modularity in functional network connectivity analysis [31]
Table 3: Essential Tools for fMRI Method Comparison Research
| Resource Category | Specific Tools | Function & Application |
|---|---|---|
| Software Packages | GIFT (Group ICA of fMRI Toolbox) | Implements ICA, GIG-ICA, and IVA algorithms for fMRI analysis [31] |
| SPM (Statistical Parametric Mapping) | Provides general linear model implementation for feature extraction [10] | |
| Data Resources | Publicly available datasets (ABIDE, ADHD) | Enable replication and comparison across research groups [5] |
| Comparison Metrics | Global Difference Maps (GDMs) | Enable visual and quantitative method comparison without factor alignment [10] [7] |
| Portrait Divergence (PDiv) | Measures dissimilarity between network topologies across all scales [33] | |
| Validation Approaches | Test-retest reliability analysis | Assesses method stability across repeated scans [31] [33] |
| Clinical correlation analysis | Validates methods against behavioral and clinical measures [5] |
Method Selection Guidelines
The choice between ICA and IVA should be guided by specific research goals:
Select IVA when:
- Research questions focus on intersubject variability [31] [5]
- Studying disorders with high heterogeneity (e.g., schizophrenia, ASD) [10] [5]
- Detecting subtle individual differences is prioritized over group consistency [31]
- Analyzing data with expected high subject-unique components [31]
Choose ICA/GIG-ICA when:
- Research aims to identify consistent group-level networks [31]
- Study reliability and test-retest stability are primary concerns [31]
- Analyzing disorders with more consistent neural signatures across individuals
- Working with smaller sample sizes where stability is crucial [31]
The absence of ground truth in real fMRI data presents ongoing challenges for method comparison and validation. Global Difference Maps offer a promising approach for quantitative comparison of analytical techniques without requiring component alignment. Evidence across multiple studies indicates that IVA generally provides superior discriminatory power for identifying group differences and capturing intersubject variability, while ICA-based methods (particularly GIG-ICA) offer more stable and reliable network estimates for consistent functional patterns. The optimal choice depends on specific research objectives, with IVA better suited for heterogeneous populations and individual differences, and ICA preferable for identifying robust group-level networks. Future methodological developments should continue to address the fundamental challenge of validation in the absence of ground truth, possibly through multi-method consensus approaches and improved validation against behavioral and clinical measures.
Global Difference Maps: A Novel Framework for Method Comparison
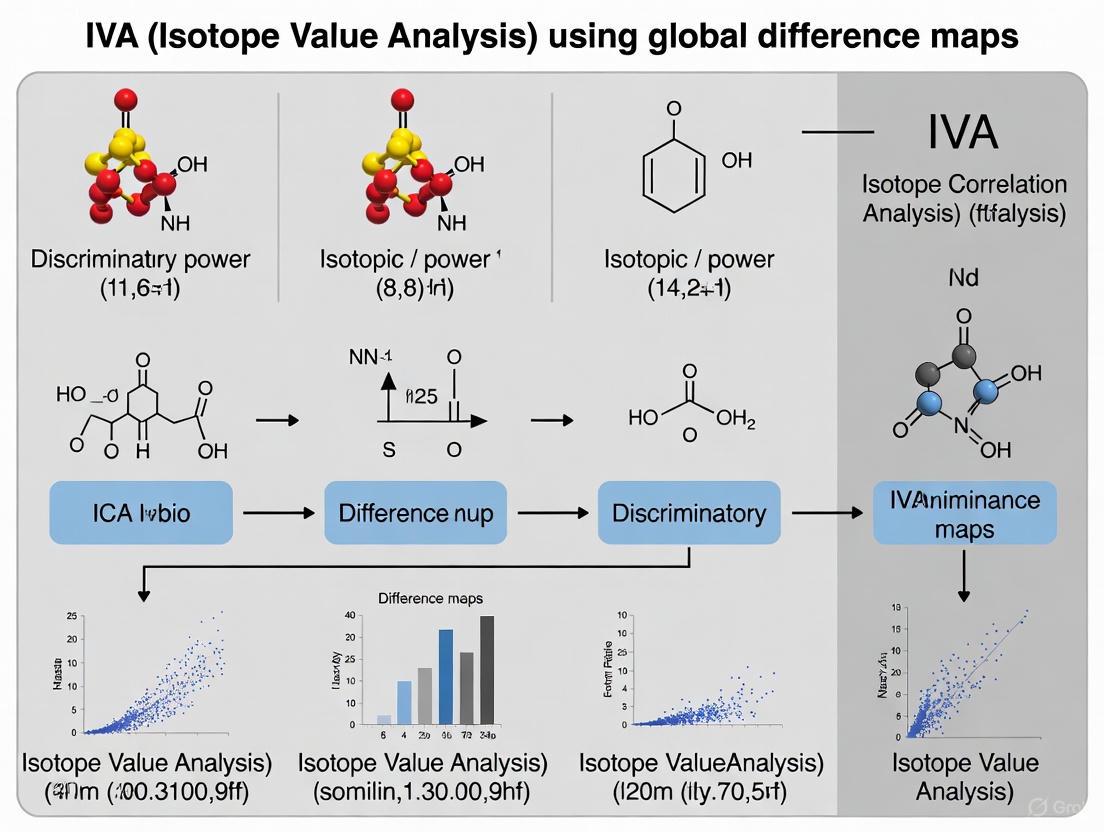
Global Difference Maps (GDMs) are a novel model comparison technique developed to visually highlight and quantify the differences in results produced by various factorization-based methods when analyzing functional magnetic resonance imaging (fMRI) data [10] [2]. The primary innovation of GDMs is their ability to facilitate objective comparison of different data-driven methods on real fMRI data, where the ground truth is unknown, without requiring a tedious and imprecise factor alignment step [7] [2].
The need for GDMs arises from the proliferation of data-driven factorization methods such as Independent Component Analysis (ICA), Independent Vector Analysis (IVA), and others, each with different modeling assumptions [10]. Traditional comparison approaches have significant limitations: simulations often lack the complexity of real fMRI data, visual comparisons of aligned factors are subjective and time-consuming, and reproducibility metrics ignore how informative extracted factors are for specific tasks [2]. GDMs overcome these limitations by providing a unified framework that quantifies the discriminative or relational power of a dataset within a decomposition, enabling direct performance comparisons between analytical methods [10].
Principles and Mathematical Foundation
Core Conceptual Framework
GDMs operate on the principle of synthesizing and visualizing the group discriminative information captured by a factorization method's complete set of components [10]. Instead of comparing individual components across methods—which requires challenging alignment procedures—GDMs create a single composite representation that summarizes all group difference information present in a decomposition [2].
The mathematical foundation of GDMs incorporates the statistical significance of latent subject weights into the final visualization [10]. This approach allows GDMs to serve a dual purpose: they provide both a visual summary of a decomposition's results and a quantitative measure of performance based on the method's ability to capture known group differences (e.g., between patients and healthy controls) [10].
Comparative Advantage Over Traditional Methods
Traditional method comparison approaches face significant challenges:
- Simulation Studies: Use artificially simple datasets that don't capture the complexity of real fMRI data [2]
- Visual Comparison: Requires manual factor alignment and is inherently subjective [10] [2]
- Reproducibility Metrics: Focus solely on stability while ignoring task-relevant information [2]
- Group Difference Analysis: Still requires solving the fundamental alignment problem [2]
GDMs overcome these limitations by providing an automated, objective framework that directly quantifies the practical utility of different factorization methods for specific research questions, particularly those involving group discrimination [7].
Computational Methodology
GDM Generation Workflow
The following diagram illustrates the computational workflow for generating Global Difference Maps:
Detailed Computational Steps
Feature Extraction
The GDM pipeline begins with feature extraction from raw fMRI data. For multi-task fMRI data where stimulus timing differs across tasks, a simple linear regression is typically run on each voxel's data using statistical parametric mapping (SPM) tools [2]. Regressors are created by convolving the hemodynamic response function (HRF) with task-specific predictors. The resulting regression coefficient maps serve as features for each subject and task, providing a lower-dimensional multivariate representation that facilitates exploration of associations across features from multiple tasks [2].
Factorization Methods
The core analysis applies factorization methods to decompose the feature data:
- Independent Component Analysis (ICA): Decomposes data into statistically independent components [10] [2]
- Independent Vector Analysis (IVA): A multivariate extension of ICA that jointly decomposes multiple datasets, optimizing both independence within subjects and dependence across corresponding components [10] [3] [2]
GDM Computation
The GDM algorithm synthesizes component information by:
- Calculating statistical significance of latent subject weights for each component
- Incorporating significance values into a composite visualization
- Generating maps where brightness corresponds to component significance [10]
This process creates a unified visualization where regions with more significant weights appear brighter, enabling immediate visual assessment of a method's ability to capture group-discriminative information [10].
Experimental Protocols and Validation
Experimental Design for GDM Validation
The validation of GDMs involved a comprehensive study comparing ICA and IVA using data from 109 patients with schizophrenia and 138 healthy controls during three distinct fMRI tasks [2]:
- Auditory Oddball (AOD) Task: Subjects listened to standard, novel, and target auditory stimuli, responding to target tones with a button press [2]
- Sternberg Item Recognition Paradigm (SIRP) Task: A visual working memory task requiring subjects to remember and recognize sets of numbers [2]
- Sensorimotor (SM) Task: A basic motor function task [2]
For each task, contrast images between conditions were generated as features. The AOD task used subject-averaged contrast images between target versus standard tones, while the SIRP task employed contrast images based on set size differences [2].
Experimental Results and Performance Comparison
The application of GDMs to compare ICA and IVA revealed distinct performance characteristics:
Table 1: Performance Comparison of ICA and IVA Using GDMs
| Performance Metric | ICA Performance | IVA Performance |
|---|---|---|
| Overall Discriminatory Power | Baseline | Superior to ICA [10] [2] |
| Task-Specific Sensitivity | Effective for regions active in subset of tasks | Less effective for regions found in only some tasks [10] |
| Component Correspondence | Lower inter-subject correspondence [3] | Higher correspondence for common sources [3] |
| Subject Variability Capture | Limited ability to capture intersubject variability [5] | Superior at capturing intersubject variability [3] [5] |
Table 2: Similarity of Networks Identified by Different Methods
| Functional Network | Similarity ( | r | value) |
|---|---|---|---|
| Sensorimotor Network (SOM) | 0.8125 [5] | ||
| Cerebellum Network (CRN) | 0.7813 [5] | ||
| Self-Reference Network (SRN) | 0.7818 [5] | ||
| Ventral Attention Network (VAN) | 0.7574 [5] | ||
| Visual Network (VSN) | 0.7503 [5] | ||
| Default Mode Network (DMN) | 0.7263 [5] |
The relationship between methodological approaches and their performance characteristics can be visualized as follows:
The Scientist's Toolkit: Essential Research Reagents and Materials
Table 3: Essential Research Materials for GDM Implementation
| Tool/Resource | Function | Implementation Notes |
|---|---|---|
| fMRI Data | Primary input data for analysis | Requires appropriate ethical approvals; example: 109 schizophrenia patients, 138 healthy controls [2] |
| Statistical Parametric Mapping (SPM) | Feature extraction via linear regression | Creates regressors by convolving HRF with task predictors [2] |
| Group ICA of fMRI Toolbox (GIFT) | Implementation of ICA, IVA, and GIG-ICA algorithms | Available at http://mialab.mrn.org/software/gift/ [3] |
| Global Difference Map Algorithm | Core GDM generation and visualization | Custom implementation as described in original research [10] [2] |
| Auditory Oddball Task | fMRI paradigm for target detection | Uses standard, novel, and target tones with button press response [2] |
| Sternberg Item Recognition Paradigm | fMRI working memory task | Involves learning and recalling number sets of varying sizes [2] |
| Sensorimotor Task | Basic motor function assessment | Serves as control task for fundamental neural functions [2] |
Global Difference Maps represent a significant methodological advancement for comparing factorization methods in neuroimaging research. By providing an objective, quantitative framework that eliminates the need for manual factor alignment, GDMs enable rigorous comparison of analytical techniques on real fMRI data where ground truth is unknown. The application of GDMs to compare ICA and IVA has demonstrated that IVA generally offers superior discriminatory power for identifying group differences, particularly for capturing intersubject variability, though it may be less effective than ICA for emphasizing regions active in only a subset of tasks [10] [2] [5].
The GDM framework establishes a foundation for more systematic evaluation of analytical methods in neuroimaging, moving beyond artificial simulations and subjective visual comparisons toward standardized, quantitative performance assessment. This approach has particular significance for clinical applications, where accurately identifying neural biomarkers of psychiatric disorders depends heavily on selecting appropriate analytical methods with demonstrated discriminatory power for the research question at hand.
Step-by-Step Implementation of GDMs for ICA and IVA Comparison
Global Difference Maps (GDMs) represent a novel model comparison technique designed to visually highlight differences between factorization methods for functional magnetic resonance imaging (fMRI) data and quantify their relational or discriminatory power [10]. The fundamental challenge in comparing data-driven methods like Independent Component Analysis (ICA) and Independent Vector Analysis (IVA) on real fMRI data stems from the absence of ground truth and the practical difficulty of aligning factors across different methods [10] [2]. GDMs effectively address this challenge by providing a visualization framework that summarizes the significance of latent subject weights, where brighter regions in the map correspond to more significant discriminative power between groups [10].
The development of GDMs is particularly valuable for neuropsychiatric research, where identifying biomarkers that differentiate patient populations from healthy controls is essential. Traditional comparison methods rely on simulated data or visual alignment of factors, which are often simplistic compared to real fMRI data or inherently subjective [10] [2]. GDMs overcome these limitations by enabling objective performance quantification of different factorization methods based on their ability to differentiate between groups, such as patients with schizophrenia and healthy controls [10].
Theoretical Background: ICA vs. IVA
Independent Component Analysis (ICA)
ICA is a blind source separation technique that decomposes observed data into a linear mixture of statistically independent components [3]. In fMRI analysis, spatial ICA (sICA) has become a popular approach for identifying spatially independent brain networks without requiring a predefined model [5]. The core assumption is that the spatial patterns of brain activity are statistically independent, allowing the separation of neural signals from noise and artifacts [3]. However, a significant limitation of ICA in group studies is the permutation ambiguity, where the order of components varies unpredictably across subjects, complicating group-level inference [1].
Independent Vector Analysis (IVA)
IVA extends ICA to multiple datasets by exploiting dependencies across subjects [1]. Unlike ICA, which processes datasets individually, IVA models both the independence within components and the dependence across corresponding components from different subjects [3]. This is achieved through source component vectors (SCVs), which group related sources across datasets [13]. IVA preserves intersubject variability while establishing natural correspondence across subjects, eliminating the need for post-hoc component alignment [5] [3]. For disorders with significant heterogeneity, such as schizophrenia or autism spectrum disorder (ASD), IVA's ability to capture subject-unique sources provides superior discriminatory power [5] [3].
Table 1: Fundamental Differences Between ICA and IVA
| Feature | ICA | IVA |
|---|---|---|
| Dataset Handling | Processes single datasets independently | Jointly analyzes multiple datasets |
| Component Structure | Scalar components | Vector components (SCVs) |
| Cross-Subject Correspondence | Requires post-hoc alignment | Built-in through dependence modeling |
| Assumption | Spatial independence within subject | Independence across SCVs, dependence within SCVs |
| Computational Complexity | Lower | Higher |
GDM Methodology: Step-by-Step Implementation
Feature Extraction and Preprocessing
The initial step in implementing GDMs involves feature extraction from raw fMRI data. For multi-task fMRI data with different stimulus timing, a linear regression approach is recommended using the Statistical Parametric Mapping toolbox (SPM) [10] [2]:
- Regressor Creation: Convolve the hemodynamic response function (HRF) with task-specific predictors for each experimental condition
- Regression Analysis: Run a separate linear regression for each voxel and subject using the created regressors
- Feature Formation: Use the resulting regression coefficient maps as features for subsequent decomposition [10] [2]
This feature extraction approach provides a lower-dimensional representation while preserving the multivariate nature of the data, facilitating the exploration of associations across features from multiple tasks [2].
Data Decomposition with ICA and IVA
After feature extraction, decompose the data using both ICA and IVA methods:
ICA Implementation:
- Apply subject-level PCA to reduce dimensionality for each dataset
- Perform ICA decomposition using algorithms such as FastICA or Infomax
- Estimate independent components representing spatial maps and their associated time courses [3]
IVA Implementation:
- Perform subject-level PCA on each subject's data
- Apply IVA-GL algorithm (combining Gaussian and Laplace models) to estimate subject-specific components and time courses [3]
- The IVA model jointly processes all subjects' data, maximizing independence across SCVs while preserving dependence within them [1]
Global Difference Maps Computation
The core GDM computation involves the following steps:
Statistical Analysis: For each component from ICA and IVA decompositions, perform voxel-wise statistical tests (e.g., t-tests) to compare patient and control groups
Weight Significance Mapping: Create maps where voxel intensity corresponds to the statistical significance of between-group differences [10]
Result Integration: Combine these significance maps across components to form comprehensive GDMs that highlight regions where each method best discriminates between groups [10]
The resulting GDMs enable direct visual comparison of the discriminatory power of ICA versus IVA, with brighter regions indicating greater discrimination capability [10].
Diagram Title: GDM Implementation Workflow
Experimental Protocols and Validation
Dataset Specifications
The validation of GDMs for ICA and IVA comparison requires carefully curated datasets:
Sample Characteristics:
- Patient Cohort: 109 patients with schizophrenia [10] [2]
- Control Group: 138 healthy controls [10] [2]
- Total Subjects: 247 participants from the Mind Research Network Clinical Imaging Consortium Collection [2]
fMRI Tasks:
- Auditory Oddball (AOD) Task: Subjects listen to standard, novel, and target tones, responding to target tones with button presses [2]
- Sternberg Item Recognition Paradigm (SIRP): Working memory task involving encoding and retrieval of digit sequences [2]
- Sensorimotor (SM) Task: Basic motor and sensory processing task [10]
Performance Metrics and Quantitative Results
The discriminatory power of ICA and IVA can be quantified using multiple performance metrics:
Table 2: Comparative Performance of ICA vs. IVA Based on Empirical Studies
| Performance Metric | ICA | IVA | Research Context |
|---|---|---|---|
| Discriminatory Power | Moderate | Higher | Schizophrenia patients vs. controls [10] |
| Intersubject Variability | Lower capture | Superior capture | Component estimation accuracy [3] |
| Computational Efficiency | Higher | Lower | Processing time and resources [15] |
| Subject-Unique Sources | Less effective | Better estimation | Handling heterogeneous populations [3] |
| Modularity Structure | More stable | Less stable | Functional network connectivity [3] |
Empirical results demonstrate that IVA identifies regions with greater discriminatory power between schizophrenia patients and controls compared to ICA [10]. However, this enhanced discrimination comes at the cost of reduced emphasis on regions found in only a subset of tasks [10]. For disorders with substantial heterogeneity, such as autism spectrum disorder, IVA shows greater sensitivity in estimating networks with higher intersubject variability [5].
Application to Autism Spectrum Disorder
Comparative studies using GIG-ICA and IVA-GL on ASD populations reveal method-specific strengths:
- IVA-GL: Demonstrates lower modularity but greater sensitivity to intersubject variability, making it suitable for disorders with heterogeneous presentation [5]
- GIG-ICA: Identifies functional networks with distinct modularity patterns and more significant differences in functional network connectivity between ASD and control groups [5]
- Predictive Performance: Both methods show similar age prediction capabilities within specific networks (IVA-VAN: R²=0.87; GIG-ICA-CRN: R²=0.91) [5]
The Scientist's Toolkit: Essential Research Reagents
Table 3: Essential Tools for GDM Implementation
| Tool/Resource | Function | Implementation Example |
|---|---|---|
| SPM Toolbox | Statistical Parametric Mapping for feature extraction | Linear regression with HRF-convolved regressors [10] |
| GIFT Toolbox | Group ICA of fMRI Toolbox | ICA and IVA decompositions [3] |
| ICA Algorithms | Data decomposition | FastICA, Infomax, EBM [10] [15] |
| IVA Algorithms | Multi-dataset decomposition | IVA-GL (Gaussian+Laplace) [3] |
| Visualization Tools | Result interpretation | Global Difference Maps generation [10] |
Comparative Analysis Framework
Diagram Title: ICA vs IVA Selection Framework
The implementation of Global Difference Maps provides a robust methodological framework for comparing the discriminatory power of ICA and IVA in fMRI analysis. Through systematic application of the step-by-step protocol outlined in this guide, researchers can objectively determine the optimal factorization method for their specific research context.
The comparative evidence consistently demonstrates that IVA offers superior performance for discriminating between clinical populations and healthy controls, particularly for disorders with significant heterogeneity such as schizophrenia and autism spectrum disorder [10] [5]. However, this enhanced discriminatory power comes with trade-offs in computational efficiency and potential loss of information about regions active only in subset of tasks [10].
Selection between ICA and IVA should be guided by research priorities: when studying disorders with substantial intersubject variability or when maximum discriminatory power is essential, IVA is preferable despite its computational demands. For studies prioritizing computational efficiency or focused on consistent group-level patterns, ICA remains a valuable alternative. The GDM framework enables this decision-making process through quantitative, visual comparison of methodological performance.
Functional magnetic resonance imaging (fMRI) has become one of the most popular means of understanding normal neural function and how it is disrupted by disorders such as schizophrenia due to its high spatial resolution and non-invasive nature [10] [2]. Data-driven factorization methods like independent component analysis (ICA) and independent vector analysis (IVA) are powerful approaches for analyzing fMRI data, as they decompose observed data into a set of factors without requiring strong a priori hypotheses [10]. These methods facilitate the identification of intrinsic functional networks that may be disrupted in psychiatric disorders.
However, comparing the performance of different factor models on real fMRI data presents significant challenges because the ground truth is unknown, and each method typically produces multiple factors that are difficult to align across techniques [10] [2]. To address this limitation, global difference maps (GDMs) have been developed as a novel model comparison technique that can visually highlight differences between factorization methods and quantify the discriminative power of a dataset within a decomposition [10] [2]. This case study employs GDMs to objectively compare the performance of ICA and IVA in discriminating between schizophrenia patients and healthy controls using multi-task fMRI data.
Experimental Protocols and Methodologies
Participant Characteristics and Data Acquisition
The study utilized datasets from the Mind Research Network Clinical Imaging Consortium Collection, comprising 247 subjects: 109 patients with schizophrenia and 138 healthy controls [2]. All participants provided informed consent, and the study was approved by the respective institutional review boards. fMRI data were collected during three distinct tasks designed to engage different cognitive domains:
- Auditory Oddball (AOD) Task: Participants listened to three types of auditory stimuli (standard, novel, and target tones) in pseudo-random order, with target tones requiring a right thumb button press [2].
- Sternberg Item Recognition Paradigm (SIRP) Task: This visual working memory task required participants to memorize and recall sets of 1, 3, or 5 randomly chosen numbers [2].
- Sensorimotor (SM) Task: A task involving basic sensory and motor functions.
Feature Extraction and Preprocessing
For each subject, a simple linear regression was run on the data from each voxel using the Statistical Parametric Mapping toolbox (SPM5). Regressors were created by convolving the hemodynamic response function (HRF) in SPM with the desired predictors for each task [2]. The resulting regression coefficient maps served as features for each subject and task, providing a lower-dimensional though still multivariate representation of the data that facilitated exploration of associations across features from multiple tasks [2].
Global Difference Maps (GDMs) Methodology
The GDM approach was developed to compare factorization methods without requiring tedious factor alignment. The methodology involves:
- Factorization Application: Apply each factorization method (ICA and IVA) to the feature data to obtain spatial maps and their corresponding subject weights.
- Statistical Analysis: Perform a two-sample t-test on the subject weights for each component to determine their ability to discriminate between patients and controls.
- GDM Construction: Create a global difference map for each method by summing the absolute values of all spatial maps, weighted by the significance (p-values) of their corresponding subject weights [10].
- Visual Comparison: The resulting GDMs visually highlight brain regions where each method identifies significant group differences, with brighter regions indicating greater discriminatory power [10].
ICA and IVA Implementation
- ICA: Was applied individually to each task's data, following standard group ICA approaches for fMRI analysis [10].
- IVA: As a multiset extension of ICA, IVA was applied jointly to the data from all three tasks, leveraging the dependency across datasets to improve source separation [10] [5].
Table 1: Key Characteristics of ICA and IVA Methods
| Feature | ICA | IVA |
|---|---|---|
| Dataset Handling | Individual analysis of single datasets | Joint analysis of multiple datasets |
| Component Linkage | Components independent within dataset | Components linked across datasets |
| Intersubject Variability | Limited capture of variability | Better preservation of subject-specific variability |
| Implementation | Standard group ICA | Multiset extension of ICA |
Comparative Performance Results
Discriminatory Power Between Schizophrenia Patients and Controls
The application of GDMs to compare ICA and IVA revealed distinct patterns of discriminatory power between the two methods:
- IVA demonstrated a superior ability to determine brain regions that were more discriminatory between patients and controls across multiple tasks [10] [2]. The GDM for IVA showed brighter regions, indicating higher significance in the latent subject weights for distinguishing between groups [10].
- ICA was found to be more effective at emphasizing regions that were discriminatory in only a subset of the tasks, suggesting better sensitivity to task-specific differences [10] [7].
- The improved performance of IVA comes from its ability to preserve subject variability among network spatial maps, bringing additional power to analyses of group differences in clinical populations [34].
Identified Brain Networks and Regions
Both methods identified several key networks relevant to schizophrenia, including:
- Basal ganglia
- Superior temporal gyrus
- Visual cortex
- Sensorimotor network [34]
IVA was particularly effective at identifying these clinically relevant networks and demonstrated better differentiation between schizophrenia patients and controls based exclusively on properties of the network spatial maps [34].
Quantitative Comparison of Performance
Table 2: Quantitative Comparison of ICA vs. IVA in Schizophrenia Discrimination
| Performance Metric | ICA | IVA | Implications | ||
|---|---|---|---|---|---|
| Overall Discriminatory Power | Moderate | Higher | IVA better at identifying group differences | ||
| Task-Specific Sensitivity | Higher | Lower | ICA better for effects present in subset of tasks | ||
| Intersubject Variability Capture | Limited | Enhanced | IVA preserves more subject-specific information | ||
| Spatial Map Correspondence | N/A | Robust across methods | Similar networks identified ( | r | = 0.75-0.81) [5] |
Visualization of the GDM Methodology
The following diagram illustrates the workflow for creating and comparing Global Difference Maps:
GDM Methodology Workflow: This diagram illustrates the process for creating and comparing Global Difference Maps for ICA and IVA.
The Scientist's Toolkit: Essential Research Reagents
Table 3: Essential Materials and Tools for fMRI Factorization Studies
| Research Tool | Function/Purpose | Example Implementation |
|---|---|---|
| Statistical Parametric Mapping (SPM) | Preprocessing and statistical analysis of neuroimaging data | Feature extraction via linear regression with HRF convolution [2] |
| Group ICA Toolbox | Implementation of ICA for fMRI data | Individual analysis of each fMRI task [10] |
| IVA Algorithms | Joint analysis of multiple datasets | IVA-GL with Gaussian/Laplace density models [5] |
| Global Difference Maps (GDMs) | Method comparison without factor alignment | Visualizing and quantifying discriminatory power [10] |
| fMRI Data Resources | Access to patient and control datasets | Mind Research Network Clinical Imaging Consortium Collection [2] |
This case study demonstrates that both ICA and IVA offer distinct advantages for discriminating between schizophrenia patients and healthy controls using fMRI data. The key findings indicate:
- IVA provides greater overall discriminatory power for identifying differences between schizophrenia patients and healthy controls, making it particularly suitable for clinical applications where group separation is the primary objective [10] [34].
- ICA offers superior sensitivity for task-specific effects that may be present in only a subset of experimental conditions, potentially making it more appropriate for studies investigating specific cognitive domains [10].
- The GDM methodology provides an effective approach for comparing factorization methods without requiring tedious factor alignment, offering both visual and quantitative means of assessing methodological performance [10] [2].
These findings align with broader research on factorization methods, which has shown that IVA generally demonstrates lower modularity but greater sensitivity in estimating networks with higher intersubject variability [5]. This characteristic makes IVA particularly suitable for investigating disorders like schizophrenia with substantial heterogeneity across patients.
For researchers and drug development professionals, these results suggest that method selection should align with specific research goals: IVA for maximal group discrimination and ICA for detailed investigation of task-specific effects. The complementary strengths of both methods could also motivate a hybrid analytical approach that leverages both techniques for comprehensive biomarker discovery in schizophrenia and other psychiatric disorders.
The identification of distinct functional networks in Autism Spectrum Disorder (ASD) is crucial for understanding its neurobiological underpinnings and developing objective biomarkers. Data-driven factorization methods like Independent Component Analysis (ICA) and Independent Vector Analysis (IVA) have become fundamental tools for extracting functional networks from resting-state functional magnetic resonance imaging (rs-fMRI) data without requiring a priori hypotheses [10] [5]. These methods help uncover the complex patterns of brain connectivity that characterize ASD.
This case study objectively compares the performance of ICA and IVA in identifying ASD-specific functional networks, framed within broader research on their discriminatory power using Global Difference Maps (GDMs) [10] [7]. We provide a detailed comparison of their experimental protocols, quantitative outcomes, and applicability for research and drug development.
Methodological Principles of ICA and IVA
Independent Component Analysis (ICA)
ICA is a blind source separation technique that decomposes multi-voxel fMRI data into a set of spatially independent components (ICs), each representing a functional network [5] [35]. Its core assumption is that the observed fMRI signal is a linear mixture of statistically independent sources.
- Key Assumptions: ICA requires that the underlying source signals (components) are statistically independent and have non-Gaussian distributions [35].
- Common Variants: In neuroimaging, spatial ICA (sICA) is frequently used, prioritizing spatial independence of components [5]. Group ICA (GICA) is a common approach for multi-subject analysis, but it has limitations in capturing intersubject variability (ISV) [5].
Independent Vector Analysis (IVA)
IVA is a multivariate extension of ICA designed for the joint analysis of multiple datasets (e.g., multiple subjects or tasks). Instead of seeking independent components, IVA finds independent vectors [10] [5].
- Core Principle: IVA maximizes independence across components while preserving the dependence within a subject's components across different datasets [5]. This makes it particularly suited for capturing intersubject variability.
- IVA-GL: An advanced variant uses Gaussian and Laplace density models to separate time-delayed and convolved signals, showing improved performance in capturing subject-specific variability in fMRI data [5].
Experimental Protocol for Method Comparison
Data Acquisition and Preprocessing
The comparative analysis relies on standardized, publicly available datasets to ensure reproducibility.
- Data Source: Data is typically sourced from the Autism Brain Imaging Data Exchange (ABIDE), a large-scale public repository aggregating fMRI data from individuals with ASD and typically developing controls (TC) [5] [36] [37]. For instance, one study used 75 healthy controls and 102 ASD participants from ABIDE [5] [38].
- Preprocessing Steps: Standard rs-fMRI preprocessing pipelines are applied, including motion correction, spatial smoothing, and band-pass filtering (e.g., 0.01-0.08 Hz) to isolate low-frequency fluctuations relevant to functional connectivity [36].
- Feature Extraction: For task-based data, individual subject-level analysis using a general linear model (GLM) can be performed first. The resulting regression coefficient maps are then used as features for subsequent group-level decomposition with ICA or IVA [10].
Analytical Workflow
The following diagram illustrates the core computational workflow for comparing ICA and IVA using Global Difference Maps.
Global Difference Maps (GDMs) for Quantifying Discriminatory Power
GDMs offer a novel approach to visually highlight and quantify the differences between factorization methods like ICA and IVA, focusing on their ability to differentiate clinical groups [10] [7].
- Principle: A GDM is generated by first identifying components that show a significant statistical difference between groups (e.g., ASD vs. controls). The corresponding spatial maps for these components are then summed, creating a composite map where the brightness of a region corresponds to its significance in discriminating the groups [10].
- Advantage: This technique avoids the tedious and imprecise process of manually aligning components from different methods, providing an objective, visual summary of a method's discriminatory power [10].
Performance Comparison in ASD Research
Quantitative Comparison of Functional Network Estimation
The table below summarizes key performance metrics from a direct comparison of GIG-ICA (a variant of ICA) and IVA-GL applied to an ASD dataset.
Table 1: Quantitative Comparison of GIG-ICA and IVA-GL in ASD Network Analysis
| Performance Metric | GIG-ICA Findings | IVA-GL Findings | Interpretation & Implications |
|---|---|---|---|
| Network Similarity | High similarity with IVA-GL in sensorimotor network (|r| = 0.8125) and other major networks (e.g., DMN, visual) [5] [38] | Robust correspondence with GIG-ICA in the same networks [5] [38] | Both methods reliably identify core functional networks, confirming the validity of extracted components. |
| Intersubject Variability (ISV) | Identified functional networks with distinct modularity patterns (HC: p<0.001; ASD: p<0.001) [5] [38] | Demonstrated lower modularity, suggesting greater sensitivity to higher ISV [5] [38] | IVA-GL is better suited for disorders with high heterogeneity, like ASD. |
| Group Discrimination | Identified more significant differences in functional network connectivity (FNC) between HC and ASD [5] [38] | Found a significant negative correlation between FNC in ASD and ADOS social scores (r = -0.26, p=0.0489) [5] [38] | GIG-ICA may be more powerful for finding gross group differences, while IVA can better link connectivity to clinical measures. |
| Predictive Performance | Cerebellar network (CRN) predicted age (R²=0.91, RMSE=3.05) [5] [38] | Ventral attention network (VAN) predicted age (R²=0.87, RMSE=3.21) [5] [38] | Both methods show strong and similar predictive utility for developmental traits. |
Discriminatory Power and Clinical Relevance
The application of GDMs to compare ICA and IVA has yielded critical insights, albeit initially in schizophrenia research, with direct relevance to ASD.
- IVA's Enhanced Discriminatory Power: In a direct comparison using GDMs, IVA identified brain regions with greater statistical power for discriminating between patients with schizophrenia and healthy controls compared to ICA [10] [7]. This suggests IVA's potential for pinpointing ASD-specific biomarkers with higher sensitivity.
- Trade-off with Specificity: The same study noted that IVA's improved global discriminatory power came at the cost of being less effective than ICA at emphasizing regions uniquely active in only a subset of experimental tasks [10]. This implies that ICA might be more suitable for analyzing condition-specific network alterations.
The Scientist's Toolkit
Table 2: Essential Research Reagents and Computational Tools for ICA/IVA Analysis in ASD
| Tool / Resource | Function / Purpose | Example Use Case in Protocol |
|---|---|---|
| ABIDE Database | A public repository of fMRI data from individuals with ASD and controls [5] [36]. | Provides standardized, pre-collected datasets for method development and validation. |
| Group ICA (GIG-ICA) Toolbox | Software implementation for extracting subject-specific components guided by a group-level template [5]. | Enables estimation of functional networks with improved correspondence across subjects. |
| IVA-GL Software | Implementation of the IVA algorithm using Gaussian and Laplace density models [5]. | Joint analysis of multiple subjects to capture intersubject variability in functional networks. |
| Global Difference Maps (GDMs) | A method to visualize and quantify the discriminatory power of different decomposition methods [10] [7]. | Objectively compare the ability of ICA and IVA to highlight brain regions that differentiate ASD from controls. |
| Amplitude of Low-Frequency Fluctuations (ALFF) | A voxel-based metric of resting-state brain spontaneous activity derived from fMRI [36]. | Can be used as an input feature for classification models or to complement connectivity analyses. |
Integrated Analysis Workflow
The following diagram synthesizes the experimental and analytical steps from data preparation to final insight, highlighting where ICA and IVA diverge and how their results are integrated.
This case study demonstrates that both ICA and IVA are powerful for identifying functional networks in ASD, but with distinct strengths and trade-offs. IVA, particularly IVA-GL, shows a clear advantage in capturing intersubject variability, a critical feature given the heterogeneity of ASD. It also demonstrates a strong ability to link neural connectivity to clinical scores [5] [38]. The use of Global Difference Maps provides an objective framework for establishing that IVA can offer greater discriminatory power for identifying group differences, as evidenced in related neuropsychiatric disorders [10] [7].
For researchers and drug development professionals, the choice of method should align with the study's goal: GIG-ICA is excellent for identifying stable, group-consistent networks with distinct modularity, while IVA-GL is more appropriate for investigating disorders with high variability and for connecting brain function to individual differences in clinical symptoms. A multimodal approach, potentially combining both methods, may offer the most comprehensive strategy for deriving biomarkers for ASD.
In the study of brain function and neuropsychiatric disorders, data-driven methods like Independent Component Analysis (ICA) are indispensable for identifying patterns from complex neuroimaging data. When analyzing multiple subjects, group-level extensions of ICA are required, primarily Group ICA (GICA) and Independent Vector Analysis (IVA). A critical challenge in neuroimaging is quantifying which method better discriminates between clinical populations, such as patients with schizophrenia and healthy controls. This comparison guide evaluates the discriminatory power of GICA and IVA, focusing on a novel evaluation framework called Global Difference Maps (GDM). This methodology provides a direct, quantifiable, and visual means to compare the performance of different analytical techniques on real functional Magnetic Resonance Imaging (fMRI) data, where the ground truth is unknown [7] [2]. The central thesis is that while both methods have merits, IVA demonstrates a superior capacity to identify spatially discriminatory regions in multi-subject fMRI analyses, especially in the presence of significant intersubject variability [39] [31].
Understanding the Methods: ICA, GICA, and IVA
Core Concepts
- Independent Component Analysis (ICA): A blind source separation technique that decomposes a single subject's fMRI data into a linear mixture of spatially independent components (ICs), each representing a potential brain network or artifact [5] [40].
- Group ICA (GICA): A common approach for multi-subject analysis. Typically, data from all subjects are temporally concatenated, and group-level ICA is performed. Subject-specific components are then back-reconstructed [39] [31]. A key limitation is its assumption of spatial stationarity, which can impair its ability to fully capture intersubject variability [39].
- Independent Vector Analysis (IVA): A multivariate extension of ICA that jointly analyzes multiple datasets (e.g., multiple subjects). IVA does not concatenate data but instead keeps subject data separate in a third dimension. It maximizes both the independence of components within each subject and the dependence of corresponding components across subjects, naturally preserving component order and better capturing subject-specific variability [40] [39].
Visualizing the Analytical Workflow
The following diagram illustrates the core structural difference between the GICA and IVA approaches in modeling subject data and components, which underpins their differing capabilities.
Global Difference Maps: A Framework for Comparison
The GDM Methodology
Global Difference Maps (GDMs) were developed to objectively compare the results of different factorization methods, such as ICA and IVA, on real fMRI data where the ground truth is unknown [7]. The core protocol involves:
- Feature Extraction: For each subject and task, a first-level general linear model (GLM) is run. The resulting regression coefficient maps (e.g., contrasts between task conditions) are used as features for subsequent decomposition [2].
- Data Decomposition: The feature datasets from all subjects are decomposed using the methods to be compared (e.g., ICA and IVA).
- Statistical Analysis: For each method, two-sample t-tests are performed on the subject-specific components or loading parameters to identify voxels that are statistically different between two groups (e.g., patients vs. controls).
- Map Creation and Comparison: The GDM is generated by aggregating the statistically significant differences, creating a global map that visually highlights the spatial extent and magnitude of group differences captured by each method. The discriminatory power can then be quantified, for instance, by counting the number of voxels or the volume of brain regions that survive a statistical threshold [7] [2].
Comparative Performance: ICA vs. IVA
Key Findings from Schizophrenia Research
Applying the GDM framework to fMRI data from 109 patients with schizophrenia and 138 healthy controls during three different tasks revealed a key performance trade-off.
Table 1: GDM Comparison of ICA and IVA in Schizophrenia fMRI Analysis
| Method | Ability to Identify Group-Discriminatory Regions | Ability to Emphasize Task-Specific Regions | Key Strength |
|---|---|---|---|
| ICA | Lower | Higher | More effective at identifying regions active in only a subset of tasks [7] [2]. |
| IVA | Higher | Lower | Superior at determining regions that are more discriminatory between patients and controls [7] [2]. |
Broader Evidence from Simulation and Other Disorders
Evidence from simulated data and studies of other disorders reinforces and contextualizes the findings from GDM research.
Table 2: Broader Comparative Analysis of GICA and IVA
| Aspect | GICA / GIG-ICA | IVA |
|---|---|---|
| Handling Intersubject Variability | Performance degrades with high spatial variability; assumes spatial stationarity [39]. | Robust performance even with high spatial variability; better preserves subject-specific features [39]. |
| Accuracy for Common Sources | Better recovery accuracy for components and timecourses of subject-common sources [31]. | Lower accuracy for common sources compared to GIG-ICA [31]. |
| Accuracy for Unique Sources | Lower accuracy for subject-unique sources [31]. | Superior component and timecourse estimation for subject-unique sources [31]. |
| Performance in Autism (ASD) | Identifies functional networks with distinct modularity patterns; more robust functional network connectivity (FNC) [5]. | Lower modularity, suggesting greater sensitivity to higher intersubject variability in ASD; better for disorders with greater variability [5]. |
Experimental Protocols for Method Comparison
To ensure reproducible comparisons between ICA and IVA, researchers typically follow structured experimental protocols. Below is a detailed methodology based on the cited studies.
Protocol 1: Simulation-Based Performance Evaluation
This protocol uses simulated data with a known ground truth to rigorously test the limits of each algorithm [39].
- Data Generation: Use a toolbox like SimTB (Simulated fMRI Data Toolbox) to generate synthetic fMRI datasets. The data are created under the spatio-temporal assumption of ICA/IVA.
- Introduction of Variability: Systematically introduce different types and degrees of intersubject variability into the simulated spatial maps (SMs). This includes:
- Amplitude Variability: Changing the peak amplitude of components.
- Spatial Variability: Applying translations, rotations, or size scaling to the spatial maps.
- Source Variability: Varying the presence of specific sources across subjects (subject-unique sources).
- Decomposition: Apply GICA (or GIG-ICA) and IVA (specifically IVA-GL) to the simulated dataset.
- Accuracy Assessment: Calculate the cross-correlation between the ground truth components (both SMs and time courses) and the estimated components from each method. A holistic analysis of all components is crucial.
- Parameter Testing: Repeat the experiment under different conditions, such as varying noise levels, overestimating the number of components, and changing the number of subjects.
Protocol 2: Real fMRI Data Analysis with GDM
This protocol is applied to real task-based or resting-state fMRI data to evaluate discriminatory power in a clinical population [7] [2].
- Dataset: Acquire fMRI data from two groups (e.g., patients and healthy controls). Publicly available datasets, such as those from the Mind Research Network, can be used.
- Preprocessing and Feature Extraction:
- Preprocess the data (slice-timing correction, motion realignment, normalization, smoothing).
- For task-based data, run a first-level GLM for each subject. Use the resulting contrast maps (e.g., target vs. standard stimuli in an auditory oddball task) as features.
- Group Decomposition: Decompose the feature maps from all subjects using both ICA (or GICA/GIG-ICA) and IVA.
- Group Difference Analysis:
- For each method, perform two-sample t-tests on the subject-specific spatial maps (or their loading parameters) to identify voxels with significant group differences.
- Correct for multiple comparisons (e.g., using False Discovery Rate).
- Generation of GDMs and Quantification:
- Create Global Difference Maps for each method by aggregating the statistically significant voxels.
- Quantify discriminatory power by measuring the number of significant voxels or the spatial extent of discriminatory clusters identified by each method.
The Scientist's Toolkit: Essential Research Reagents
Table 3: Key Software Tools and Datasets for GICA/IVA Comparison
| Research Reagent | Type | Function / Application |
|---|---|---|
| GIFT (Group ICA of fMRI Toolbox) | Software Toolbox | A MATLAB toolbox that implements GICA, GIG-ICA, and IVA-GL, allowing for direct comparison within a unified environment [39] [31]. |
| SimTB (Simulated fMRI Data Toolbox) | Software Toolbox | A tool for generating simulated fMRI datasets with known ground truth, enabling controlled evaluation of algorithm performance [39]. |
| SPM (Statistical Paramameter Mapping) | Software Toolbox | Used for standard fMRI preprocessing and first-level GLM analysis to create feature maps for decomposition [2]. |
| ABIDE (Autism Brain Imaging Data Exchange) | Dataset | A publicly available repository of resting-state fMRI data from individuals with Autism Spectrum Disorder (ASD) and healthy controls, used for comparative method validation [5]. |
| Mind Research Network Clinical Imaging Consortium Collection | Dataset | A publicly available dataset including fMRI data from patients with schizophrenia and healthy controls, used in the original GDM study [2]. |
Optimizing ICA and IVA Performance: Addressing Practical Challenges
In the analysis of complex neuroimaging data, component order selection—determining the number of underlying sources to extract—represents a fundamental challenge with significant implications for result interpretation. This process balances two competing objectives: capturing sufficient signal diversity while avoiding overfitting to noise. In functional magnetic resonance imaging (fMRI), techniques like Independent Component Analysis (ICA) and Independent Vector Analysis (IVA) rely on accurate component order selection to identify biologically plausible brain networks. ICA operates as a univariate method, decomposing a single dataset into statistically independent components [40]. In contrast, IVA represents a multivariate extension that jointly processes multiple datasets, maintaining dependence of corresponding components across datasets while maximizing independence within them [3] [40].
The critical importance of component order selection stems from its direct impact on discriminatory power and result validity. Underestimating component count may obscure meaningful neural signals, while overestimating creates fragmented components that complicate neurophysiological interpretation. Within the context of comparing ICA and IVA, their different mathematical frameworks mean that optimal order selection operates under distinct principles for each method. IVA's use of source component vectors (SCVs) introduces additional dimensionality considerations, as it models both within-dataset independence and between-dataset dependence [13]. This comparative guide examines the experimental evidence for component order selection in both methodologies, providing researchers with a framework for optimizing this crucial analytical parameter.
Theoretical Foundations: ICA vs. IVA
Independent Component Analysis (ICA)
ICA is a blind source separation technique that decomposes multivariate data into statistically independent components based on higher-order statistics [24]. The fundamental model for ICA is expressed as: x = As where x represents the observed data, s contains the independent sources, and A is the mixing matrix [41]. In fMRI applications, spatial ICA (sICA) has become predominant, decomposing data into spatially independent patterns with associated time courses [3]. A key limitation of standard ICA is the permutation ambiguity inherent in its solutions, where the order of extracted components is arbitrary, creating challenges for cross-subject comparisons in group studies [24] [3].
For component order selection, ICA requires pre-specification of the number of components to extract, typically implemented through dimensionality reduction via Principal Component Analysis (PCA) as an initial step [24]. The determination of this dimensionality significantly influences results, with underestimation risking signal loss and overestimation leading to component splitting. In practice, various information-theoretic criteria exist for estimating optimal dimensionality, though consistency across these methods remains challenging [3].
Independent Vector Analysis (IVA)
IVA extends ICA concepts to multiple datasets simultaneously, introducing a coupled separation framework. Unlike ICA, IVA employs multivariate component vectors that link corresponding sources across datasets, formally defined as: sₙ = [sₙ¹, sₙ², ..., sₙᴷ]ᵀ where K represents the number of datasets and n indexes components [40]. This structure enables IVA to maximize independence across source component vectors (SCVs) while preserving statistical dependence within them [13].
IVA's component order selection must account for both the number of sources per dataset and their dependency structure across datasets. The IVA-GL algorithm, which combines Gaussian and Laplace multivariate source priors, has demonstrated particular effectiveness for fMRI data [3] [5]. IVA naturally addresses the permutation problem that plagues multi-dataset ICA applications, as corresponding components are inherently aligned during the estimation process [40]. This property makes IVA particularly suitable for analyzing data with inherent group structure, such as multi-subject fMRI studies where capturing intersubject variability is scientifically valuable.
Performance Comparison: Experimental Data
Simulation Studies on Accuracy and Sensitivity
Controlled simulation studies provide critical insights into how component order selection influences separation accuracy under known ground truth conditions. Researchers have evaluated ICA and IVA performance across varying data quality levels, component counts, and intersubject variability patterns [3].
Table 1: Simulation Performance Metrics for Component Order Selection
| Method | Optimal Condition | Subject-Common Sources Recovery | Subject-Unique Sources Recovery | Sensitivity to Over-Parameterization | ||
|---|---|---|---|---|---|---|
| GIG-ICA | High data quality, consistent networks | High accuracy ( | r | > 0.95) [3] | Moderate accuracy | Low sensitivity |
| IVA-GL | High intersubject variability | Moderate accuracy | High accuracy ( | r | > 0.92) [3] | High sensitivity |
| Traditional GICA | Low subject variability | Moderate accuracy | Poor accuracy | Moderate sensitivity |
Simulation evidence demonstrates that GIG-ICA achieves superior recovery of components consistent across subjects, with correlation coefficients exceeding 0.95 for subject-common sources under optimal dimensionality selection [3]. This makes it particularly suitable for identifying core brain networks shared across populations. In contrast, IVA excels at capturing subject-unique components, maintaining accuracy above 0.92 even when substantial intersubject variability exists [3]. This performance pattern holds significant implications for component order selection—IVA requires sufficient dimensionality to accommodate both shared and unique sources, while GIG-ICA can operate effectively with fewer components when studying conserved functional architecture.
Real fMRI Data Applications
Real-world fMRI analyses validate simulation findings while revealing additional practical considerations for component order selection. In test-retest reliability assessments using resting-state fMRI data, GIG-ICA demonstrated higher spatial reliability (|r| = 0.75-0.81 across major networks) compared to IVA [5]. The consistently high correspondence across core neurocognitive networks including the default mode network (|r| = 0.7263) and sensorimotor network (|r| = 0.8125) confirms GIG-ICA's robustness for studying conserved functional architecture [5].
Table 2: fMRI Network Reliability and Discriminatory Power
| Brain Network | Spatial Similarity ( | r | ) | GIG-ICA FNC Modularity | IVA-GL FNC Modularity | Preferred Method for Disorder Discrimination |
|---|---|---|---|---|---|---|
| Default Mode Network (DMN) | 0.7263 | High | Lower | GIG-ICA (schizophrenia) | ||
| Sensorimotor Network (SOM) | 0.8125 | High | Lower | GIG-ICA (bipolar disorder) | ||
| Cerebellum Network (CRN) | 0.7813 | High | Lower | IVA-GL (autism spectrum disorder) | ||
| Visual Network (VSN) | 0.7503 | High | Lower | Method-dependent |
IVA demonstrates particular utility in clinical populations characterized by high heterogeneity. In autism spectrum disorder (ASD) research, IVA identified significant negative correlations (r = -0.26, p = 0.0489) between functional network connectivity and social impairment scores on the Autism Diagnostic Observation Schedule [5]. This enhanced sensitivity to clinically meaningful variation highlights IVA's value when studying disorders with substantial intersubject variability. Component order selection in such applications must accommodate diverse phenotypic manifestations, potentially requiring higher dimensionality to capture clinically relevant subpopulations.
Experimental Protocols and Methodologies
Standardized Analysis Workflows
Reproducible component analysis requires standardized preprocessing and dimensionality estimation procedures. The following workflow represents a consensus approach derived from multiple comparative studies [3] [5]:
- Data Preprocessing: Apply standard fMRI preprocessing (slice timing correction, realignment, normalization, smoothing) to all datasets.
- Dimensionality Reduction: Perform subject-level PCA to reduce computational complexity while retaining >95% variance.
- Component Number Estimation: Calculate optimal dimensionality using information-theoretic criteria (e.g., MDL) or reliability-based methods.
- Group Analysis: For GIG-ICA, perform group-level PCA followed by ICA decomposition; for IVA, apply joint decomposition across subjects.
- Back-Reconstruction: Estimate subject-specific components (GIG-ICA) or leverage native subject-wise components (IVA).
- Component Identification: Match extracted components to canonical networks using spatial correlation.
- Statistical Analysis: Compare groups using network spatial maps, time courses, or functional network connectivity.
Component Analysis Workflow: Standardized pipeline for ICA and IVA methodologies.
Component Order Selection Protocols
Determining optimal component count employs distinct approaches for ICA and IVA:
GIG-ICA Component Order Selection:
- Perform subject-level PCA retaining N₁ components per subject
- Conduct group-level PCA on temporally concatenated data
- Estimate final component count (N) using modified Laplace approximation
- Validate stability through split-half reliability tests
- Remove artifact components prior to final analysis [3]
IVA-GL Component Order Selection:
- Set initial dimensionality matching estimated intrinsic dimensionality
- Apply PCA to each subject's data, retaining N components
- Execute IVA-GL to estimate subject-specific components and time courses
- Evaluate shared subspace using correlation metrics across subjects
- Adjust dimensionality based on inter-subject dependency structure [3] [13]
The critical distinction lies in IVA's need to model both within- and between-subject source characteristics. While GIG-ICA assumes consistent spatial patterns across subjects, IVA explicitly accommodates variability, requiring dimensionality sufficient to capture both shared and unique features.
The Scientist's Toolkit: Essential Research Reagents
Table 3: Key Analytical Tools for Component Order Selection
| Tool/Software | Function | Implementation in Component Analysis |
|---|---|---|
| Group ICA of fMRI Toolbox (GIFT) | Algorithm implementation | Provides GIG-ICA, IVA-GL, and traditional ICA implementations [3] |
| Information-Theoretic Criteria (AIC, MDL) | Dimensionality estimation | Estimates intrinsic data dimensionality pre-decomposition [3] |
| Split-Half Reliability Analysis | Stability validation | Assesses component stability across subsamples [5] |
| Spatial Correlation Templates | Component identification | Matches extracted components to reference networks [5] |
| Multivariate Gaussian/Laplace Priors | Source distribution modeling | IVA source models capturing dependency structure [40] |
Component order selection fundamentally shapes the analytical sensitivity and biological interpretability of both ICA and IVA methods. Experimental evidence supports a context-dependent approach to method selection and dimensionality determination. GIG-ICA is recommended for studies prioritizing identification of conserved functional networks across homogeneous populations, offering superior reliability and clearer modular structure in functional network connectivity [5]. IVA-GL is preferable for investigations of disorders with substantial heterogeneity or studies specifically examining intersubject variability, providing enhanced sensitivity to unique subject-specific features [3] [5].
The optimal component count balances signal preservation against overfitting, with practical guidance suggesting that higher dimensionality benefits IVA applications due to its capacity to model both shared and unique sources. For clinical applications, particularly in neurologically heterogeneous populations like autism spectrum disorder, IVA's ability to capture clinically meaningful variation often justifies its additional computational complexity. Conversely, for basic neuroscience identifying core functional architecture, GIG-ICA's stability and reliability offer distinct advantages. Future methodological developments should focus on automated dimensionality selection optimized for each method's theoretical framework and intended application context.
Functional magnetic resonance imaging (fMRI) has become one of the most popular means of understanding normal neural function and how it is disrupted by disorders such as schizophrenia, due to its high spatial resolution and non-invasive nature [10] [2]. In the analysis of multi-subject fMRI studies, researchers face a fundamental challenge: how to effectively balance the identification of group-common networks with the preservation of subject-unique sources of variability. This challenge is particularly pronounced in psychiatric disorders where intersubject variability (ISV) may carry crucial clinical information.
Two prominent data-driven methods have emerged to address this challenge: Independent Component Analysis (ICA) and Independent Vector Analysis (IVA). While both are factorization-based approaches that separate observed fMRI data into underlying sources, they differ fundamentally in how they handle multi-subject data. ICA, particularly through group ICA (GICA) implementations, assumes common spatial networks across subjects, thereby emphasizing group-common features. In contrast, IVA is specifically designed to model and preserve subject-specific variations while still identifying commonalities across subjects [10] [5] [15]. Understanding their relative strengths and limitations is essential for selecting the appropriate analytical framework for probing brain network abnormalities in neuropsychiatric disorders.
Methodological Foundations: ICA vs. IVA
Independent Component Analysis (ICA) Framework
ICA is a blind source separation technique that decomposes observed fMRI data into a set of statistically independent components, each representing a spatial map and associated time course [5]. The basic noiseless ICA model can be expressed as:
x(v) = As(v)
Where x(v) is the observation vector at sample index v, s(v) represents the statistically independent latent sources, and A is an unknown invertible mixing matrix [15]. ICA estimates the latent sources by finding a demixing matrix W such that the components y(v) = Wx(v) are maximally independent.
For group-level analysis, Group ICA (GICA) implementations typically involve a two-step approach: (1) individual subject data decomposition, and (2) combination into a group-level analysis [5]. This approach facilitates the identification of common networks across subjects but inherently limits the capture of intersubject variability due to its assumption of common spatial maps at the group level [15].
Independent Vector Analysis (IVA) Framework
IVA extends ICA to multiple datasets by exploiting the statistical dependence across subjects [10] [15]. Unlike GICA, IVA simultaneously calculates and optimizes independent components for each subject without a back-reconstruction phase [5]. The IVA model can be represented as:
x^{(k)}(v) = A^{(k)}s^{(k)}(v) for k = 1,...,K
Where K represents the number of subjects, and the components across subjects are linked through their dependence structure [15]. IVA maximizes both the independence between related components within a subject and the dependency between corresponding components across different subjects [5].
Advanced implementations of IVA include IVA-GL, which incorporates both Gaussian (IVA-G) and Laplace (IVA-L) density models to separate time-delayed and convolved signals based on higher-order frequency dependencies [5]. This multivariate approach allows IVA to more effectively capture intersubject variability while still identifying common patterns across subjects.
Global Difference Maps: A Novel Comparison Framework
The GDM Methodology
Global Difference Maps (GDMs) represent a novel model comparison technique designed to visually highlight differences between factorization methods and quantify the discriminative power of a dataset within a decomposition [10] [2]. The GDM approach addresses a fundamental limitation in comparing different factorization techniques on real fMRI data: the absence of ground truth and the impracticality of aligning factors across methods [10].
The GDM framework operates through several key stages. First, feature extraction is performed where regression coefficient maps are generated for each subject and task using the statistical parametric mapping toolbox (SPM) [2]. These maps serve as features for subsequent analysis. Next, factorization is applied using either ICA or IVA to decompose the data into components. For each resulting component, statistical analysis is conducted on the subject weights to identify those that significantly differentiate clinical groups (e.g., patients vs. controls). Finally, the GDM is constructed by summing the absolute values of all components, weighted by the significance of their corresponding subject weights in differentiating the groups [10].
This methodology generates a comprehensive visualization where brighter regions correspond to areas with more significant discriminatory power, enabling direct comparison of how effectively different factorization methods identify biologically relevant brain regions.
Experimental Application of GDMs
In the foundational GDM study, researchers applied this technique to compare ICA and IVA using fMRI data from 109 patients with schizophrenia and 138 healthy controls across three tasks: an auditory oddball (AOD) task, a Sternberg item recognition paradigm (SIRP) task, and a sensorimotor (SM) task [2]. The analysis revealed distinct performance characteristics for each method.
IVA demonstrated superior capability in determining regions that were more discriminatory between patients and controls, suggesting enhanced sensitivity to neuropathological differences [10] [2]. However, this improved discriminatory power came at the cost of reduced effectiveness in emphasizing regions found in only a subset of the tasks [10] [2]. ICA, while less sensitive to group differences, showed more consistent performance across multiple tasks and better stability in modularity structure [5].
Table 1: Key Characteristics of GDM Experimental Implementation
| Aspect | Specification |
|---|---|
| Subjects | 109 schizophrenia patients, 138 healthy controls |
| Tasks | Auditory oddball (AOD), Sternberg item recognition (SIRP), Sensorimotor (SM) |
| Feature Extraction | Linear regression with SPM, HRF convolution |
| Comparison Metrics | Discriminatory power, regional emphasis, task consistency |
Comparative Performance Analysis
Discriminatory Power and Intersubject Variability
Multiple studies have systematically compared the performance of ICA and IVA in capturing clinically relevant neural patterns. The application of GDMs to schizophrenia data revealed that IVA identified regions with significantly greater discriminatory power between patients and controls compared to ICA [10] [2]. This enhanced sensitivity to group differences suggests IVA's potential for identifying robust biomarkers in heterogeneous psychiatric populations.
In autism spectrum disorder (ASD) research, a comparative analysis of Group Information-Guided ICA (GIG-ICA) and IVA-GL demonstrated robust correspondence between methods in several key networks, including the cerebellum network (|r| = 0.7813), default mode network (|r| = 0.7263), and sensorimotor network (|r| = 0.8125) [5]. However, IVA-GL demonstrated lower modularity, suggesting greater sensitivity in estimating networks with higher intersubject variability [5]. This characteristic makes IVA particularly suitable for disorders with substantial heterogeneity, such as ASD and schizophrenia.
Table 2: Quantitative Comparison of ICA and IVA Performance Metrics
| Performance Metric | ICA/GIG-ICA | IVA/IVA-GL |
|---|---|---|
| Intersubject Variability Capture | Limited | Superior [5] [15] |
| Group Discrimination Power | Moderate | Higher [10] [2] |
| Computational Efficiency | Higher | Lower, especially with large datasets [15] |
| Network Similarity | Stable modularity structure [5] | Lower modularity, higher variability [5] |
| Task Consistency | Better emphasis on regions in task subsets [10] | Reduced effectiveness for subset regions [10] |
Clinical and Cognitive Correlations
The clinical relevance of factorization methods extends beyond technical performance to their ability to correlate with behavioral and cognitive measures. In ASD research, IVA-GL identified a statistically significant negative correlation between functional network connectivity (FNC) and the social total subscore of the Autism Diagnostic Observation Schedule (ADOS: r = -0.26, p = 0.0489) [5]. This finding demonstrates IVA's capacity to capture clinically meaningful relationships between brain network organization and symptom severity.
Both ICA and IVA have demonstrated similar predictive performances for age within specific networks, as indicated by GIG-ICA applied to the cerebellum network (R² = 0.91, RMSE = 3.05) and IVA applied to the ventral attention network (R² = 0.87, RMSE = 3.21) [5]. This suggests that while each method may emphasize different networks, both can yield robust predictions of developmental trajectories.
Experimental Protocols and Implementation
Standardized Experimental Workflow
The following diagram illustrates the key stages in a typical comparative analysis of ICA and IVA using Global Difference Maps:
The experimental workflow begins with fMRI Data Acquisition using appropriate task paradigms (e.g., auditory oddball, Sternberg item recognition) or resting-state protocols [2]. Preprocessing typically includes motion correction, slice timing correction, normalization to standard space, and spatial smoothing [15]. Feature Extraction involves generating regression coefficient maps for each subject using general linear models in SPM, with regressors created by convolving the hemodynamic response function with task predictors [2].
The core of the analysis involves parallel Decomposition using both ICA and IVA methods. For ICA, this typically involves group ICA approaches, while IVA implementations may use IVA-GL to capture both Gaussian and Laplacian distributions in the data [5]. Component Analysis includes matching components across methods using approaches like the greedy rule to enable direct comparison [5]. Statistical Testing evaluates subject weights for their ability to differentiate clinical groups, followed by GDM Generation through weighted summation of significant components [10]. The final stages involve comprehensive Method Comparison and Clinical Correlation with behavioral or cognitive measures [5] [15].
Research Reagent Solutions
Table 3: Essential Research Tools for ICA/IVA fMRI Analysis
| Tool/Solution | Function | Application Context |
|---|---|---|
| Statistical Parametric Mapping (SPM) | Preprocessing, statistical analysis | Feature extraction, general linear modeling [2] |
| Group ICA Toolbox | Group independent component analysis | ICA decomposition of multi-subject fMRI data [5] |
| IVA-GL Algorithms | Independent vector analysis | Multi-subject decomposition preserving variability [5] |
| Greedy Matching Algorithm | Component alignment | Matching components across methods for comparison [5] |
| Gershgorin Disc Theorem | Subgroup identification | Identifying homogeneous patient subgroups [15] |
The comparative analysis of ICA and IVA reveals distinct advantages for each method depending on research objectives. IVA demonstrates superior capability for capturing intersubject variability and identifying robust group differences, making it particularly suitable for disorders with substantial heterogeneity such as schizophrenia and autism spectrum disorder [10] [5]. The development of Global Difference Maps provides an objective framework for evaluating method performance, addressing the long-standing challenge of comparing factorization techniques without ground truth [10].
For researchers studying disorders where intersubject variability may reflect clinically meaningful subtypes, IVA offers enhanced sensitivity to patient-control differences and better correlation with symptom severity [5]. Conversely, when analyzing stable functional networks across large cohorts or when computational efficiency is paramount, ICA approaches provide more consistent results with lower computational demands [15]. The ongoing development of constrained ICA methods and hybrid approaches represents a promising direction for balancing the strengths of both methodologies in probing the complex landscape of brain network abnormalities in neuropsychiatric disorders.
In the field of blind source separation (BSS) and multivariate data analysis, researchers and clinicians frequently face critical decisions regarding algorithm selection for processing complex neuroimaging and biomedical data. Two prominent techniques—Independent Component Analysis (ICA) and its multivariate extension Independent Vector Analysis (IVA)—offer distinct approaches to extracting meaningful signals from multi-subject and multi-task datasets. The fundamental distinction lies in their processing frameworks: ICA operates as a univariate method analyzing single datasets independently, while IVA functions as a multivariate tool that jointly processes multiple datasets to exploit statistical dependencies across them [40].
Understanding how data characteristics—particularly quality and quantity—influence algorithm performance is paramount for optimizing analytical workflows in drug development and clinical neuroscience research. This article provides a structured comparison of ICA and IVA, focusing on their discriminatory power assessed through Global Difference Maps (GDMs), with explicit examination of how data volume and quality modulate their effectiveness.
Theoretical Foundations: ICA vs. IVA
Independent Component Analysis (ICA)
ICA is an unsupervised learning method that decomposes a multivariate signal into statistically independent non-Gaussian components. The core principle relies on maximizing the statistical independence of estimated components, typically measured through higher-order statistics or information-theoretic criteria [40]. In mathematical terms, for an observed signal ( \mathbf{x}(v) = [x1(v), \dots, xN(v)]^\top ), ICA seeks a demixing matrix ( \mathbf{W} ) such that the estimated sources ( \mathbf{y}(v) = \mathbf{W} \mathbf{x}(v) ) are maximally independent [15]. A significant limitation of standard ICA emerges when handling multiple datasets: it must decompose each dataset independently without leveraging inherent statistical dependencies across datasets [40].
Independent Vector Analysis (IVA)
IVA extends ICA to multiple datasets by introducing the concept of source component vectors (SCVs). Each SCV, ( \mathbf{y}m = [ym^{[1]}, \dots, y_m^{[K]}]^\top ), groups together dependent components across datasets while maintaining statistical independence between different SCVs [40] [42]. IVA's cost function incorporates mutual information across datasets:
[ \mathcal{I}{\text{IVA}} = \sum{m=1}^M H[\mathbf{y}m] - \sum{k=1}^K \log |\det(\mathbf{W}^{[k]})| - C_1 ]
where ( H[\mathbf{y}_m] ) represents the entropy of the m-th SCV [42]. This formulation enables IVA to resolve the permutation ambiguity problem that plagues frequency-domain ICA applications and provides enhanced capability for capturing intersubject variability in neuroimaging studies [40] [5].
Global Difference Maps (GDMs) for Algorithm Comparison
Global Difference Maps constitute a novel methodological framework for comparing results from different fMRI analysis techniques on real data where ground truth is unknown. GDMs enable visual highlighting of differences between decompositions and provide quantitative assessment of relative discriminatory power [7] [2]. The method is particularly valuable because it avoids the impractical and imprecise factor alignment required by alternative comparison approaches, instead quantifying performance based on the ability to differentiate between clinical groups (e.g., patients with schizophrenia versus healthy controls) [2].
Figure 1: Experimental workflow for comparing ICA and IVA using Global Difference Maps. Both algorithms process input data independently, with GDMs providing a standardized framework for quantifying differential performance.
Experimental Comparison: Methodologies and Protocols
Experimental Design for Discriminatory Power Assessment
Dataset Characteristics and Preparation
- Subject Population: 109 patients with schizophrenia and 138 healthy controls (total N=247) [2]
- fMRI Tasks: Auditory oddball (AOD), Sternberg item recognition paradigm (SIRP), and sensorimotor (SM) tasks [2]
- Feature Extraction: Regression coefficient maps generated for each subject and task using statistical parametric mapping (SPM) with hemodynamic response function (HRF) convolution [2]
Analytical Implementation
- ICA Application: Standard spatial ICA implemented per dataset
- IVA Implementation: IVA with multivariate Gaussian distribution model (IVA-G) for SCVs
- GDM Generation: Voxel-wise difference maps highlighting regions where algorithms produced divergent discriminatory patterns [2]
- Performance Quantification: Statistical assessment of each method's ability to differentiate schizophrenia patients from healthy controls
Comparative Performance Results
Table 1: Comparative Performance of ICA and IVA in Schizophrenia fMRI Study
| Performance Metric | ICA | IVA | Experimental Basis |
|---|---|---|---|
| Overall Discriminatory Power | Moderate | Higher | IVA identified regions with stronger group differentiation [7] [2] |
| Task-Generalized Regions | Effective | Less Effective | IVA underperformed in emphasizing regions active in only task subsets [2] |
| Intersubject Variability (ISV) | Limited | Enhanced | IVA better captures individual differences in multiple studies [5] [15] |
| Computational Demand | Lower | Higher | IVA's multivariate analysis increases computational complexity [15] |
| Stability of Modularity | Higher | Lower | GIG-ICA showed more stable modular structure than IVA-GL [5] |
Table 2: Similarity Coefficients Between IVA-GL and GIG-ICA in Autism Spectrum Disorder Study
| Functional Network | Similarity Coefficient (|r|) |
|---|---|
| Sensorimotor Network (SOM) | 0.8125 |
| Self-Reference Network (SRN) | 0.7818 |
| Cerebellum Network (CRN) | 0.7813 |
| Default Mode Network (DMN) | 0.7263 |
| Ventral Attention Network (VAN) | 0.7574 |
| Visual Network (VSN) | 0.7503 |
Data obtained from comparative analysis of 75 healthy controls and 102 ASD participants [5].
Impact of Data Quality and Quantity on Algorithm Performance
Data Volume Considerations
Large-Sample Performance ICA and IVA exhibit differential scalability with increasing data volumes. While both methods can technically process large datasets, IVA's computational complexity increases more substantially with additional subjects, creating practical limitations for large-scale studies [15]. Research indicates that IVA's performance "degrades as the number of datasets increases," prompting development of alternative approaches like constrained ICA for very large cohorts [15].
Small-Sample Performance In studies with limited subjects, IVA demonstrates superior capability to extract meaningful patterns from multi-subject data, effectively leveraging statistical dependencies across subjects even with moderate sample sizes [42]. The schizophrenia study (N=247) and autism research (N=177) both demonstrated IVA's enhanced discriminatory power with practically attainable sample sizes [2] [5].
Data Quality Dimensions
Temporal Resolution and Signal-to-Noise Ratio IVA demonstrates enhanced robustness in lower signal-to-noise ratio conditions by leveraging statistical dependencies across multiple datasets [40]. This advantage is particularly pronounced in fMRI paradigms with complex temporal dynamics, where IVA can effectively distinguish stimulus-related signals from spontaneous fluctuations [2].
Intersubject Variability A critical data quality consideration involves the degree of functional homogeneity across subjects. IVA excels with heterogeneous populations where brain responses exhibit substantial intersubject variability, as it effectively captures individual differences while identifying common patterns [5] [15]. Conversely, for highly homogeneous populations with consistent functional topographies, ICA-based approaches may provide sufficient characterization with lower computational demands [24].
Data Dimensionality High-dimensional data (e.g., dense spatial sampling in fMRI) presents challenges related to the "curse of dimensionality." IVA's multivariate approach provides natural advantages for high-dimensional data by exploiting correlations across dimensions, whereas ICA may require additional dimensionality reduction steps that potentially sacrifice meaningful signal [40].
Figure 2: Data characteristic influences on algorithm selection. Specific data attributes systematically favor either ICA or IVA approaches based on their inherent methodological strengths.
The Scientist's Toolkit: Essential Research Reagents and Materials
Table 3: Essential Research Tools for ICA/IVA Neuroimaging Studies
| Tool/Category | Specific Examples | Function/Purpose |
|---|---|---|
| Data Acquisition | fMRI Scanners (3T/7T), EEG Systems, BCI Recording Equipment | Capture neural activity signals with appropriate temporal/spatial resolution [2] [42] |
| Preprocessing Tools | Statistical Parametric Mapping (SPM), FSL, AFNI | Implement essential preprocessing: slice timing, realignment, normalization, smoothing [2] [24] |
| Algorithm Implementation | Group ICA for fMRI Toolbox (GIFT), IVA-G/L, GIG-ICA, c-EBM | Execute core decomposition algorithms with appropriate parameter optimization [5] [15] |
| Validation Metrics | Global Difference Maps (GDMs), Similarity Coefficients, Modularity Statistics | Quantify algorithm performance and discriminatory power [7] [2] [5] |
| Clinical Assessment | PANSS, BACS, SFS, ADOS | Provide behavioral/cognitive correlates for neuroimaging findings [5] [15] |
The comparative analysis of ICA and IVA using Global Difference Maps reveals a nuanced relationship between algorithm performance and data characteristics. IVA generally demonstrates superior discriminatory power for differentiating clinical populations, particularly in contexts with moderate sample sizes, heterogeneous subject populations, and lower signal-to-noise ratios [7] [2] [5]. However, ICA maintains advantages for analyzing task-specific regional activations and when computational efficiency is prioritized [2].
The critical consideration for researchers and drug development professionals is that algorithm selection should be guided by specific data attributes and research objectives rather than seeking a universally superior approach. IVA's enhanced capability to capture intersubject variability makes it particularly valuable for identifying biologically meaningful subgroups within heterogeneous clinical populations—a crucial capability for advancing personalized medicine approaches in neuropsychiatry [5] [15]. As neuroimaging datasets continue growing in both size and complexity, understanding these algorithmic tradeoffs will become increasingly essential for optimizing analytical strategies in clinical neuroscience research and therapeutic development.
Comparative Performance Under Different Variability Conditions
Functional magnetic resonance imaging (fMRI) has become a pivotal tool for understanding neural function and its disruption in psychiatric disorders [10]. Data-driven factorization methods, such as Independent Component Analysis (ICA) and its multi-set extension Independent Vector Analysis (IVA), are widely used to decompose complex fMRI data into interpretable functional networks [10] [3]. The performance of these methods is critically dependent on the level of intersubject variability (ISV) present in the data, which refers to the degree of difference in brain functional networks across individuals [3] [5]. This guide provides an objective comparison of the discriminatory power of ICA and IVA under different variability conditions, a subject thoroughly investigated using a novel model comparison technique known as Global Difference Maps (GDMs) [10] [7] [2]. Understanding the performance characteristics of each method is essential for researchers, scientists, and drug development professionals to select the optimal analytical tool for identifying robust biomarkers and furthering precision medicine in neuroscience.
Experimental Protocols for Method Comparison
The comparative findings summarized in this guide are synthesized from multiple studies that employed rigorous experimental designs. The core methodology for a primary comparison is detailed below.
Global Difference Maps (GDMs) for Real fMRI Data Comparison
A key challenge in comparing factorization methods on real fMRI data is the absence of ground truth and the impracticality of aligning factors across techniques [10]. To address this, a novel method, Global Difference Maps (GDMs), was developed to visually highlight differences between methods and quantify their relational or discriminative power without a tedious factor alignment step [10] [7] [2].
- Objective: To visually and quantitatively compare the performance of different factorization methods (e.g., ICA vs. IVA) on real fMRI data based on their ability to find features that differentiate between groups (e.g., patients vs. controls) [10] [2].
- Dataset: The methodology was applied to fMRI data from 109 patients with schizophrenia and 138 healthy controls performing three tasks: an auditory oddball (AOD) task, a Sternberg item recognition paradigm (SIRP) task, and a sensorimotor (SM) task [10] [2].
- Feature Extraction: For each subject and task, a simple linear regression was performed on the data from each voxel. The regressors were created by convolving the hemodynamic response function (HRF) with the desired predictors for each task. The resulting regression coefficient maps were used as features for each subject and task [2].
- Analysis and Comparison: Data were decomposed using ICA (individual analysis) and IVA (joint analysis). The GDM technique was then applied to summarize and compare the results, with brighter regions in the GDM indicating greater significance in differentiating between the patient and control groups [10] [2].
Simulation-Based Performance Evaluation
Other comparative studies have relied on simulations to evaluate performance in controlled conditions where the ground truth is known [3].
- Objective: To evaluate the accuracy of IVA and Group Information-Guided ICA (GIG-ICA) in estimating subject-specific components and time courses under various challenges [3].
- Simulated Conditions: Evaluations were conducted under different data quality and quantity, varied numbers of generated sources, the use of an inaccurate number of components in computation, and the presence of spatially subject-unique sources [3].
- Performance Metrics: The accuracy of component and time course recovery was measured against known, simulated sources [3].
Performance Results Under Varying Conditions
The performance of ICA and IVA is not uniform; it varies significantly based on the underlying data structure, particularly the degree of intersubject variability.
The table below synthesizes key performance findings from multiple studies.
Table 1: Comparative Performance of ICA/GIG-ICA and IVA under Different Conditions
| Performance Metric | ICA / GIG-ICA Performance | IVA Performance | Key References |
|---|---|---|---|
| Subject-Common/Shared Sources | Better recovery accuracy of components and time courses [3]. | Less effective than GIG-ICA [3]. | [3] |
| Subject-Unique Sources / High Variability | Less effective than IVA [3]. | Superior performance in component and time course estimation; excels at capturing intersubject variability [3] [5]. | [3] [5] |
| Group Discriminatory Power | Effectively identifies discriminatory regions [10]. | Can determine regions that are more discriminatory between patients and controls [10] [7] [2]. | [10] [7] [2] |
| Computational Considerations | More computationally efficient for large-scale datasets [15]. | Higher computational complexity; performance can degrade with a large number of datasets [13] [15]. | [13] [15] |
| Network Modularity & Reliability | Yields more stable modularity in Functional Network Connectivity (FNC) and more reliable spatial networks [3] [5]. | Results in lower modularity, indicating greater sensitivity to individual differences [5]. | [3] [5] |
Key Experimental Findings
Discriminatory Power in Schizophrenia Study: An application of GDMs to multi-task fMRI data revealed that IVA could identify brain regions with higher discriminatory power for distinguishing between schizophrenia patients and healthy controls. However, this enhanced power for joint analysis came at the cost of IVA being less effective than ICA at emphasizing regions found in only a subset of the tasks [10] [2].
Simulated Performance with Subject-Unique Sources: In simulation studies, IVA outperformed GIG-ICA in estimating both the spatial components and the associated time courses for sources that were unique to individual subjects. Conversely, GIG-ICA demonstrated higher accuracy for sources that were common across all subjects [3].
Real-Data Analysis in Autism Spectrum Disorder (ASD): A study using data from the ABIDE database found that while both methods showed robust correspondence in identifying major functional networks, IVA-GL demonstrated lower modularity in its functional network connectivity. This suggests IVA is more sensitive to estimating networks with higher intersubject variability, making it suitable for disorders with great heterogeneity. Furthermore, only IVA-GL identified a significant negative correlation between FNC in ASD and a clinical score (ADOS), highlighting its potential for uncovering clinically relevant variabilities [5].
The Scientist's Toolkit: Essential Research Reagents and Materials
The following table details key software tools and data resources essential for conducting comparative analyses of ICA and IVA.
Table 2: Key Research Reagents and Solutions for fMRI Decomposition Analysis
| Item Name | Function / Application | Relevance to ICA/IVA Comparison |
|---|---|---|
| Statistical Parametric Mapping (SPM) | A software package for the analysis of brain imaging data sequences; used for pre-processing and statistical modeling [2]. | Used in the GDM protocol for initial feature extraction via linear regression to create regression coefficient maps [2]. |
| Group ICA of fMRI Toolbox (GIFT) | A MATLAB toolbox that implements multiple ICA and IVA algorithms for the analysis of fMRI data [3]. | The platform where both IVA-GL and GIG-ICA algorithms are implemented and can be directly compared [3]. |
| Mind Research Network Clinical Imaging Consortium Collection | A publicly available database of neuroimaging data from patients and healthy controls [2]. | Sourced the data (109 schizophrenia patients, 138 controls) for the primary GDM comparison study [2]. |
| Autism Brain Imaging Data Exchange (ABIDE) | A public repository of resting-state fMRI data from individuals with Autism Spectrum Disorder and controls [5]. | Used in a comparative study to evaluate GIG-ICA and IVA in the context of ASD [5]. |
| IVA by Shared Subspace Separation (IVA-S3) | A scalable extension of IVA designed to improve performance and reduce computational cost by separating shared and non-shared subspaces [13]. | Addresses a key limitation of IVA (computational cost with many datasets) and demonstrates continued methodological evolution [13]. |
Workflow and Relationship Visualization
The following diagram illustrates the logical workflow for comparing ICA and IVA using Global Difference Maps, as well as the decision-making process for method selection based on data variability.
The comparative analysis of ICA and IVA reveals that neither method is universally superior; their performance is intrinsically tied to the degree of intersubject variability in the data. ICA, and its advanced variant GIG-ICA, demonstrates superior performance in estimating stable, subject-common functional networks, making it appropriate for identifying consistent group-level biomarkers and achieving more reliable modular functional network connectivity [3] [5]. In contrast, IVA excels in conditions of high intersubject variability, more accurately capturing subject-unique sources and demonstrating higher discriminatory power in distinguishing clinical groups like schizophrenia patients from controls [10] [3]. The choice between these methods should therefore be a deliberate one, guided by the specific research question and the expected neurobiological heterogeneity of the population under study. For researchers aiming to personalize medicine for neuropsychiatric disorders, leveraging IVA's sensitivity to individual differences may provide crucial insights, whereas those seeking to define core pathophysiological networks might prioritize the stability offered by GIG-ICA.
In the analysis of functional magnetic resonance imaging (fMRI) data, Independent Component Analysis (ICA) and its multi-dataset extension, Independent Vector Analysis (IVA), are two prominent data-driven methods for identifying brain functional networks. While both aim to separate mixed signals into meaningful sources, their underlying models lead to a fundamental trade-off: discriminatory power for identifying group differences versus comprehensive network coverage and estimation stability. This guide provides an objective comparison of their performance, focusing on this critical trade-off, which is essential for researchers and drug development professionals to consider when selecting an analytical method for neuroimaging studies. The comparative framework is centered on findings from research utilizing Global Difference Maps (GDMs), a novel technique designed to objectively quantify and visualize the discriminatory power of different factorization methods on real fMRI data where the ground truth is unknown [10] [7].
Independent Component Analysis (ICA)
ICA is an unsupervised linear dimensionality reduction technique that decomposes a single subject's fMRI data into a set of spatially independent components (ICs), some of which represent brain functional networks [43] [5]. For group-level analysis, a common approach is Temporal Concatenation Group ICA (TC-GICA), which involves concatenating all subjects' time series and performing a single ICA decomposition to derive group-level components. Subject-specific components are then back-reconstructed [3] [44]. A key characteristic of GICA is its assumption of spatial homogeneity, enforcing a common group-level spatial map for all subjects. This promotes stability and correspondence across subjects but can suppress inter-subject variability [15] [5].
Independent Vector Analysis (IVA)
IVA is a multivariate extension of ICA that generalizes the decomposition to multiple datasets (subjects) simultaneously [1]. Instead of producing independent scalar components, IVA generates independent vector components, where each vector contains a set of linked source signals from all subjects [3] [1]. The IVA model optimizes two key objectives: maximizing the independence between different vector components (inter-component independence) while preserving the dependence among the elements within each vector (intra-component dependence) [5] [1]. This allows IVA to model inter-subject variability (ISV) more effectively than GICA, as it does not assume perfect spatial correspondence across subjects [3] [44].
Experimental Protocols for Comparison
The Global Difference Maps (GDM) Framework
A key methodology for comparing ICA and IVA involves the use of Global Difference Maps (GDMs) [10] [7].
- Objective: To visually highlight and quantify the differences between factorization methods based on their ability to find features that differentiate groups (e.g., patients vs. controls) or relate to external measures.
- Procedure: After decomposition, subject-specific component weights (or spatial maps) are used in a statistical test (e.g., t-test) to identify voxels that significantly differ between groups. The resulting statistical map is then combined with the component's spatial map to create a GDM, where the brightness of a region corresponds to the significance of its latent weights in differentiating the groups [10].
- Outcome: GDMs provide a visual summary of a method's discriminatory power, eliminating the need for a tedious and subjective manual alignment of factors from different decompositions [10].
Simulation and Real-Data Validation Protocols
Comparative studies typically employ a hybrid approach to validate findings.
- Simulated Data Experiments: Researchers generate synthetic fMRI data with known ground truth, including both subject-common sources (networks consistent across subjects) and subject-unique sources (networks with high inter-subject variability). The accuracy of each method in recovering the true components and time courses is then measured under various conditions (e.g., different data quality, model order, noise levels) [3].
- Real fMRI Data Analysis: Methods are applied to real datasets, often from public repositories like ABIDE (for autism) or datasets involving patients with schizophrenia and healthy controls [10] [5]. Performance is evaluated based on:
- Discriminatory Power: The ability to identify components that show statistically significant group differences [10].
- Network Reliability/Stability: The reproducibility of estimated networks and functional network connectivity (FNC) in test-retest datasets [3].
- Correlation with Behavior: The ability of derived FNC patterns to correlate with clinical or cognitive scores (e.g., ADOS scores in autism) [5].
The following diagram illustrates a typical experimental workflow for such a comparative study.
Performance Comparison: Quantitative Data
The table below summarizes key performance metrics for ICA and IVA derived from multiple comparative studies.
Table 1: Comparative Performance of ICA and IVA across Key Metrics
| Performance Metric | ICA (GIG-ICA) | IVA (IVA-GL) | Supporting Evidence |
|---|---|---|---|
| Discriminatory Power | Moderate | Higher | IVA determined regions that were more discriminatory between patients and controls [10]. |
| Handling Subject-Common Sources | Better recovery accuracy for components and time courses [3]. | Lower accuracy for subject-common sources [3]. | GIG-ICA showed better recovery accuracy for components and time courses for subject-common sources [3]. |
| Handling Subject-Unique Sources | Lower accuracy for subject-unique sources [3]. | Better recovery accuracy for components and time courses [3]. | IVA outperformed GIG-ICA in component and time course estimation for the subject-unique sources [3]. |
| Network Reliability/Stability | More reliable spatial networks and more robust FNC modularity [3] [5]. | Lower modularity and less stable FNC structure in healthy controls [3] [5]. | GIG-ICA resulted in more reliable spatial functional networks and yielded higher and more robust modularity [3]. |
| Computational Cost | Lower computational complexity, suitable for large-scale datasets (hundreds of subjects) [15]. | Computationally expensive; performance can degrade as the number of datasets increases [15]. | IVA is computationally expensive, and its performance degrades as the number of datasets increases [15]. |
The Stability-Sensitivity Trade-off: A Conceptual Synthesis
The data in Table 1 points to a core trade-off. The following diagram conceptualizes this relationship and the inherent strengths of each method.
IVA's Strength in Discriminatory Power: IVA's superior ability to identify features that differentiate groups (e.g., patients with schizophrenia from healthy controls) stems from its sensitivity to inter-subject variability [10]. By not enforcing a rigid common spatial map, IVA can better capture idiosyncratic patterns or disease-related alterations that are not consistent across all subjects. This makes it particularly powerful for finding biomarkers in heterogeneous populations [5]. However, this sensitivity can come at the cost of stability, as seen in its lower modularity scores in test-retest analyses [3].
ICA's Strength in Network Stability: Methods like GIG-ICA, which optimize for correspondence with a group-level template, excel at estimating networks that are highly consistent across subjects, such as the default mode or sensory networks [3] [5]. This results in more reliable and stable functional network connectivity (FNC) patterns, which is crucial for defining robust neurophysiological biomarkers. The trade-off is that this focus on commonality may smooth over or miss clinically relevant individual differences, potentially reducing its discriminatory power in some contexts [10].
The Scientist's Toolkit: Essential Research Reagents
The following table lists key software tools and methodological components essential for conducting comparative studies of ICA and IVA.
Table 2: Key Research Reagents and Software for ICA/IVA Analysis
| Item Name | Type | Function in Research |
|---|---|---|
| GIFT (Group ICA of fMRI Toolbox) | Software Toolbox | A widely used MATLAB toolbox that implements various ICA algorithms (including GIG-ICA and IVA-GL), providing a standardized platform for decomposition and back-reconstruction [3] [5]. |
| Global Difference Maps (GDMs) | Analytical Method | A novel model comparison technique to visually highlight and quantify the discriminatory power of different factorization methods without the need for factor alignment [10] [7]. |
| fALFF (Fractional Amplitude of Low-Frequency Fluctuations) | fMRI Metric | Used to summarize the variability in fMRI data, enabling the arrangement of data into a tensor (subjects × voxels × time windows) for dynamic analysis with methods like PARAFAC2 [45]. |
| Constrained ICA (c-ICA) / c-EBM | Algorithm | A variant of ICA that incorporates prior information (constraints) to guide the decomposition, improving alignment across subjects and enabling analysis of large-scale datasets with lower computational cost than IVA [15]. |
| Simulated fMRI Datasets | Data | Artificially generated data with known ground truth sources, used to validate and benchmark the accuracy of ICA and IVA algorithms under controlled conditions [3] [1]. |
The choice between ICA and IVA is not a matter of one method being universally superior, but rather a strategic decision based on the research goals. If the primary objective is to identify robust, common brain networks with high reliability and stability for defining general neurophysiological phenomena, ICA (particularly GIG-ICA) is the more appropriate choice. Conversely, if the goal is to maximize the discovery of features that differentiate groups, especially in heterogeneous clinical populations where individual variability is a key factor, IVA offers superior discriminatory power, despite its higher computational cost and lower network stability. Researchers must therefore carefully weigh the trade-off between network coverage/stability and discriminatory power when selecting an analytical framework for their fMRI studies.
Benchmarking ICA and IVA: Validation Metrics and Real-World Performance
Independent Component Analysis (ICA) and its multivariate extension, Independent Vector Analysis (IVA), are fundamental data-driven methods for analyzing functional magnetic resonance imaging (fMRI) data. These techniques decompose complex brain signals into underlying components or networks without requiring a priori models of brain activation [2]. Their widespread application in studying neural function and its disruption in psychiatric disorders such as schizophrenia has motivated critical evaluation of their relative performance, particularly regarding their spatial accuracy (precision in locating brain networks) and temporal fidelity (accuracy in estimating component time courses) [3] [46].
Validation of these methods presents significant challenges. While real fMRI data offers ecological validity, the absence of ground truth complicates objective assessment [2]. Consequently, simulation-based validation has emerged as an essential approach for quantifying performance under controlled conditions where true components are known [3] [46]. This guide synthesizes evidence from multiple simulation studies to objectively compare the discriminatory power, spatial accuracy, and temporal fidelity of ICA and IVA methodologies, providing researchers with evidence-based guidance for method selection.
Fundamental Methodological Differences
Understanding the architectural distinctions between ICA and IVA is prerequisite to interpreting their performance differences.
Independent Component Analysis (ICA): Traditional ICA, including group ICA (GICA) frameworks, decomposes a single dataset into statistically independent components. In fMRI applications, spatial ICA (sICA) identifies spatially independent patterns with associated time courses [3]. For multi-subject analyses, temporal concatenation GICA estimates group-level components first, then back-reconstructs subject-specific components using algorithms like PCA or regression [3]. A key limitation is that GICA "removes spatial correlations of overlapping SMs and introduce artificial correlations in their TCs" [46].
Independent Vector Analysis (IVA): IVA generalizes ICA to multiple datasets simultaneously. Instead of seeking independent components, IVA seeks independent component vectors [3] [46]. IVA models both the independence of components within subjects and the dependence of corresponding components across subjects [3] [46]. This unique approach enables IVA to better preserve inter-subject variability, making it particularly suitable for studies expecting subject-specific differences in brain networks [31] [46].
Table 1: Fundamental Methodological Differences Between ICA and IVA
| Feature | ICA/GICA | IVA |
|---|---|---|
| Data Structure | Single dataset or temporally concatenated group data | Multiple datasets analyzed simultaneously |
| Primary Objective | Maximize statistical independence within dataset | Maximize independence within subjects and dependence across subjects for corresponding components |
| Component Output | Independent components | Independent component vectors |
| Subject Variability Handling | Assumes relative spatial consistency; may produce composite estimates under high variability [46] | Explicitly models and preserves subject-specific variability [46] |
| Typical Algorithms | Infomax, FastICA [2] | IVA-G, IVA-L, IVA-GL [3] |
Experimental Protocols for Simulation-Based Validation
Simulation studies follow rigorous protocols to create realistic fMRI data with known ground truth, enabling precise quantification of estimation accuracy.
Data Generation and Experimental Conditions
Simulated datasets are designed to mimic key characteristics of real fMRI data while maintaining control over critical parameters:
Spatial Maps (SMs) Generation: Researchers generate realistic spatial components representing brain networks. These often include subject-common sources (consistent across subjects) and subject-unique sources (present only in specific subjects) [3] [46]. The degree of spatial variability between subjects can be systematically controlled.
Time Course (TC) Creation: Synthetic time courses are generated with properties resembling hemodynamic responses, often incorporating task-related responses or resting-state dynamics [3].
Data Quality Manipulation: Studies investigate performance across different signal-to-noise ratios (SNR) to evaluate robustness to noise [3].
Component Number Effects: Simulations test scenarios where the number of components is accurately estimated, underestimated, and overestimated to assess method stability [3] [46].
Sample Size Considerations: Data quantity is varied to examine how methods perform with different numbers of subjects or time points [3].
Performance Metrics and Evaluation
Quantitative metrics are essential for objective comparison:
Spatial Accuracy: Typically measured using cross-correlation coefficients between estimated and true spatial maps [3]. Higher correlations indicate better spatial localization.
Temporal Fidelity: Evaluated via cross-correlation between estimated and true time courses [3]. This assesses how well temporal dynamics are captured.
Discriminatory Power: In studies incorporating clinical groups or conditions, methods can be evaluated by their ability to identify components that significantly differentiate between groups (e.g., patients vs. controls) [2]. Global Difference Maps (GDMs) provide one approach for visualizing and quantifying these differences [2].
Reliability: For test-retest data, intra-class correlation coefficients (ICC) can measure consistency of network estimates across sessions [3].
Figure 1: Simulation Validation Workflow. This diagram illustrates the standardized protocol for simulation-based validation of ICA and IVA methods, from ground truth definition to statistical comparison of results.
Comparative Performance Analysis
Spatial Accuracy Under Varied Conditions
Spatial accuracy varies significantly between methods depending on the nature of the underlying sources and data quality.
Table 2: Spatial Accuracy Comparison Under Different Conditions
| Experimental Condition | ICA/GICA Performance | IVA Performance | Performance Implications |
|---|---|---|---|
| Low Subject Variability | Good recovery of common components [46] | Good recovery of common components [46] | Both methods perform adequately when components are consistent across subjects |
| High Subject Variability | Produces composite spatial maps that blend features from multiple true components [46] | Maintains accurate estimation of subject-specific spatial maps [46] | IVA significantly outperforms ICA in studies with expected inter-subject differences |
| Subject-Unique Sources | Struggles to accurately estimate sources unique to individual subjects [46] | Effectively captures subject-unique spatial sources [46] | IVA preferred for identifying individual-specific network patterns |
| Inaccurate Model Order | Introduces artifacts in spatial maps when component number is overestimated [46] | Robust to overestimation of component numbers [46] | IVA offers greater stability in real applications where true component number is unknown |
Temporal Fidelity and Component Correspondence
Temporal accuracy is crucial for understanding brain network dynamics and their relationship to tasks or stimuli.
Time Course Estimation: Under conditions of high spatial variability or subject-unique sources, GICA produces significant errors in time course estimates, while IVA maintains accurate temporal estimation [46]. This advantage makes IVA particularly valuable for studies focusing on the temporal dynamics of brain networks.
Component Correspondence: IVA naturally establishes correspondence of components across subjects as part of its optimization framework [3]. In contrast, GICA requires additional steps to align components after estimation, which can introduce subjectivity and imprecision [2].
Artificial Correlations: Both GICA and IVA remove spatial correlations of overlapping spatial maps, but GICA introduces artificial correlations in time courses of estimated components, particularly when model assumptions are violated [46].
Direct Comparison: GIG-ICA vs. IVA
Group Information Guided ICA (GIG-ICA) represents an advanced GICA variant that explicitly optimizes both independence of subject-specific components and their correspondence to group-level components [3]. Simulation studies directly comparing GIG-ICA and IVA reveal:
For Subject-Common Sources: GIG-ICA demonstrates better recovery accuracy for both components and time courses than IVA when sources are consistent across subjects [3] [31].
For Subject-Unique Sources: IVA outperforms GIG-ICA in component and time course estimation for sources with significant inter-subject variability or unique to individual subjects [3] [31].
Test-Retest Reliability: Applied to real resting-state fMRI data, GIG-ICA produces more reliable spatial networks and yields higher modularity in functional network connectivity (FNC) across sessions [3].
Advanced Fusion Frameworks: DS-ICA
The Disjoint Subspaces using ICA (DS-ICA) framework has been developed to leverage the complementary strengths of different approaches [47]. This method:
Identifies and separates common subspaces (components shared across datasets) from distinct subspaces (components unique to individual datasets) as a first step [47].
Applies appropriate analysis techniques to each subspace separately: joint analysis to common subspaces and separate analyses to distinct subspaces [47].
Demonstrates higher classification accuracy in differentiating patients with schizophrenia from healthy controls compared to jICA and MCCA-jICA [47].
Estimates more components discriminative between groups with meaningful activation differences in motor, sensory, default mode, visual, and frontal parietal regions [47].
Figure 2: DS-ICA Fusion Framework. This hybrid approach first identifies common and distinct subspaces across datasets using IVA-G, then applies appropriate analysis methods to each subspace separately.
Table 3: Essential Research Tools for ICA/IVA Comparison Studies
| Tool/Resource | Function | Application Notes |
|---|---|---|
| Group ICA of fMRI Toolbox (GIFT) | MATLAB-based software package implementing ICA, GIG-ICA, and IVA algorithms [3] | Primary platform for method implementation and comparison; provides multiple algorithms in unified environment |
| Statistical Parametric Mapping (SPM) | Preprocessing and first-level analysis of fMRI data [2] | Used for initial feature extraction through regression coefficient maps |
| Simulation Data Generators | Create controlled fMRI datasets with known ground truth components [3] [46] | Essential for validation studies; allow systematic parameter manipulation |
| Global Difference Maps (GDMs) | Visualization technique to highlight differences between method results [2] | Enables qualitative and quantitative comparison of spatial estimates |
| Cross-Correlation Metrics | Quantify similarity between estimated and true components [3] | Standardized approach for spatial and temporal accuracy measurement |
| Intra-Class Correlation (ICC) | Measure test-retest reliability of network estimates [3] | Important for establishing methodological consistency across sessions |
Simulation-based validation provides critical insights into the performance characteristics of ICA and IVA for fMRI analysis:
- IVA demonstrates superior performance in scenarios with significant inter-subject variability, accurately capturing both common and subject-unique spatial maps while maintaining temporal fidelity [46].
- GIG-ICA excels when analyzing consistent functional networks across subjects, providing more reliable estimates and higher connectivity modularity in test-retest evaluations [3].
- The DS-ICA framework offers a promising hybrid approach, systematically addressing both common and distinct components across datasets and demonstrating enhanced discriminatory power in clinical applications [47].
Method selection should be guided by the specific research context: IVA for studies expecting substantial subject variability or seeking subject-unique features, GIG-ICA for investigations focusing on consistent group-level networks, and emerging frameworks like DS-ICA for comprehensive analyses requiring both common and distinct components.
Reproducibility and Reliability in Test-Retest Studies
Independent Component Analysis (ICA) and its extension, Independent Vector Analysis (IVA), are foundational data-driven methods in functional magnetic resonance imaging (fMRI) research for identifying brain networks and their interactions [31]. Evaluating the performance of such analytical techniques poses a significant challenge in real-data applications where ground truth is unknown. This guide objectively compares the discriminatory power and test-retest reliability of ICA and IVA, focusing on evidence from studies utilizing a novel comparison technique known as Global Difference Maps (GDMs) [7] [10] [2]. Understanding the reproducibility of results from these algorithms is critical for researchers and drug development professionals who rely on them to identify robust biomarkers in neuroimaging data.
Fundamental Concepts: ICA, IVA, and Reliability
Independent Component Analysis (ICA) and Independent Vector Analysis (IVA)
Independent Component Analysis (ICA) is a blind source separation technique that decomposes multivariate data into underlying components that are statistically independent from one another. In spatial ICA (sICA) of fMRI data, the algorithm finds spatially independent patterns whose time courses are distinct [31]. A key challenge in group studies is establishing correspondence of components across individual subjects.
Independent Vector Analysis (IVA) is a multivariate extension of ICA designed for the joint analysis of multiple datasets [48] [31]. While ICA treats each dataset in isolation, IVA introduces a dependency structure across datasets. IVA optimizes two objectives simultaneously: the independence among components within each subject, and the dependence among corresponding components across different subjects [31]. This makes IVA particularly suited for capturing subject-specific variability while maintaining component correspondence.
Reproducibility and Reliability in Neuroimaging
In neuroimaging, reliability assesses the consistency of a measurement tool or analytical method. Test-retest reliability specifically quantifies the consistency of results across repeated measurements of the same subjects under similar conditions [49].
Key metrics for assessing reliability include:
- Intra-class Correlation Coefficient (ICC): A relative reliability index quantifying the proportion of total variance accounted for by between-subject differences. Values range from 0 to 1, with higher values indicating better reliability [49] [50].
- Standard Error of Measurement (SEM): An absolute reliability index representing the precision of measurements, expressed in the original units of measurement [50].
- Smallest Real Difference (SRD): The smallest change that must be observed to be considered a real difference beyond measurement error [50].
For fMRI analysis methods, high reliability indicates greater potential for detecting true biological effects in clinical studies and drug trials.
Comparative Experimental Framework: Global Difference Maps (GDMs)
The GDM Methodology
The Global Difference Maps (GDMs) technique provides a framework for comparing factorization methods like ICA and IVA on real fMRI data without requiring factor alignment [7] [10] [2]. The methodology involves:
Feature Extraction: For each subject and task, regression coefficient maps are generated by convolving task designs with a hemodynamic response function. These maps serve as multivariate features representing task-related brain activation [2].
Data Decomposition: The features are decomposed using ICA and IVA separately to obtain subject-specific components and their associated weights.
Statistical Analysis: For each method, subject weights are analyzed using a statistical framework (e.g., regression) to identify components that differentiate between groups (e.g., patients vs. controls).
GDM Construction: The GDMs are created by aggregating the discriminatory power of all components, visually highlighting brain regions where each method finds significant group differences [10] [2].
Experimental Protocol for Method Comparison
A typical experimental protocol for comparing ICA and IVA using GDMs includes:
Participants: The study typically involves a substantial sample size. For example, one application used data from 109 patients with schizophrenia and 138 healthy controls [7] [2].
fMRI Tasks: Multiple cognitive tasks are often employed, such as:
- Auditory Oddball (AOD) Task: Measures attention and novelty processing [2].
- Sternberg Item Recognition Paradigm (SIRP): Assesses working memory [2].
- Sensorimotor (SM) Task: Evaluates basic motor and sensory function [2].
Analysis Pipeline:
- Preprocessing of fMRI data (motion correction, normalization, etc.)
- Feature extraction for each task
- Separate decomposition using ICA and IVA
- Group comparison analysis on subject weights
- GDM creation and comparison
- Assessment of test-retest reliability using ICC metrics
Table 1: Key Research Reagent Solutions for fMRI Analysis
| Research Reagent | Function in Analysis |
|---|---|
| Group ICA Toolbox (GIFT) | Software implementation of ICA, IVA, and GIG-ICA algorithms [31] |
| Statistical Parametric Mapping (SPM) | Software for preprocessing, statistical analysis, and feature extraction [2] |
| Global Difference Maps (GDMs) | Novel visualization technique for comparing discriminatory power [7] |
| Intra-class Correlation Coefficient (ICC) | Statistical metric for quantifying test-retest reliability [49] [50] |
| fMRI Data Features | Regression coefficient maps representing task-related brain activation [2] |
Figure 1: Experimental workflow for comparing ICA and IVA using Global Difference Maps
Performance Comparison: Discriminatory Power and Reliability
Discriminatory Power for Group Comparisons
Studies applying GDMs to fMRI data from schizophrenia patients and healthy controls have revealed important differences in how ICA and IVA perform:
IVA demonstrates superior capability in identifying brain regions with strong discriminatory power between patients and controls. When applied to multi-task fMRI data, IVA consistently highlighted regions that more effectively differentiated the two groups [7] [10] [2]. This suggests IVA may be more sensitive to disease-related neural alterations that are consistent across tasks.
ICA, in contrast, appears more effective at emphasizing regions activated in only a subset of tasks [7] [2]. While IVA's joint analysis leverages cross-task dependencies, ICA's separate analysis of each task preserves unique task-specific features that may be biologically relevant.
Reliability and Reproducibility in Test-Retest Studies
Test-retest reliability measures the consistency of results when the same analytical method is applied to repeated scans of the same subjects:
GIG-ICA (Group Information Guided ICA), a variant of GICA, has demonstrated high test-retest reliability in functional network estimation. In studies using healthy subjects' test-retest resting-state fMRI data, GIG-ICA produced more reliable spatial functional networks and yielded higher, more robust modularity in functional network connectivity (FNC) compared to IVA [48] [31].
IVA shows strength in capturing subject-unique sources with great inter-subject variability [48] [31]. This makes IVA particularly valuable for studies focusing on individual differences rather than group consistency.
Table 2: Quantitative Comparison of ICA and IVA Performance
| Performance Metric | ICA/GIG-ICA | IVA |
|---|---|---|
| Discriminatory Power | Effective for task-specific regions [7] | Superior for consistent group differences [7] [10] |
| Test-Rest Reliability | High reliability for common networks [48] [31] | Better for subject-unique sources [48] |
| Subject Variability | Optimized for consistent networks [31] | Captures inter-subject variability [48] [31] |
| Component Correspondence | Established through back-reconstruction [31] | Built into the model [31] |
| Analysis Approach | Separate analysis per task/dataset [2] | Joint analysis across datasets [31] |
Implications for Research and Clinical Applications
Method Selection Guidance
The choice between ICA and IVA should be guided by research objectives and the nature of expected effects:
For studies seeking biomarkers that consistently differentiate clinical groups across multiple tasks or conditions, IVA is preferable due to its enhanced discriminatory power for common differences [7] [10] [2].
When researching condition-specific effects or when biological phenomena of interest may manifest differently across tasks, ICA may reveal important patterns that IVA's joint analysis might suppress [7].
In longitudinal studies or clinical trials where measurement reliability is paramount, GIG-ICA provides more reproducible network estimates across sessions [48] [31].
For studies of individual differences or when subject-unique features are of interest, IVA better captures inter-subject variability [48] [31].
Application in Drug Development
In pharmaceutical research, the reliability and discriminatory power of neuroimaging endpoints are critical for:
Target Engagement Biomarkers: IVA's superior discriminatory power may provide more sensitive measures of drug effects on specific brain networks.
Patient Stratification: IVA's ability to capture subject-specific features could help identify patient subtypes responsive to particular treatments.
Clinical Trial Endpoints: GIG-ICA's high test-retest reliability makes it suitable for longitudinal studies measuring treatment effects over time.
Figure 2: Decision framework for selecting between ICA and IVA
The comparison between ICA and IVA reveals a trade-off between discriminatory power and reliability that must be carefully considered in research design and clinical applications. IVA demonstrates superior performance in identifying consistent group differences across multiple tasks, making it particularly valuable for biomarker discovery in heterogeneous clinical populations like schizophrenia. Meanwhile, ICA and its variant GIG-ICA offer advantages in reliability for common networks and preserving task-specific information.
The Global Difference Maps methodology provides an objective framework for comparing these techniques without cumbersome factor alignment, enabling researchers to select the most appropriate method for their specific research context. As neuroimaging continues to play an expanding role in understanding disease mechanisms and treatment effects, rigorous comparison of analytical methods remains fundamental to generating reproducible and clinically meaningful findings.
Functional magnetic resonance imaging (fMRI) has become a cornerstone technique for understanding brain function in both health and disease. Data-driven methods like independent component analysis (ICA) are widely used to identify brain functional networks from fMRI data without requiring prior hypotheses about regional activation. However, standard ICA and group ICA (GICA) approaches face challenges in capturing intersubject variability (ISV), which is crucial for understanding individual differences in brain organization and their disruption in neurological and psychiatric disorders. To address this limitation, two advanced methods have been developed: independent vector analysis (IVA) and group information-guided ICA (GIG-ICA) [3] [48].
This guide provides a comparative analysis of IVA and GIG-ICA, focusing on their effectiveness in capturing intersubject variability. We summarize performance metrics from simulation and real-data studies, detail experimental methodologies, and provide practical recommendations for researchers seeking to implement these approaches in neuroimaging studies, particularly within the context of comparing ICA and IVA discriminatory power using global difference maps research.
Independent Vector Analysis (IVA)
IVA is a multivariate extension of ICA that jointly decomposes data from multiple subjects or datasets. Unlike ICA, which processes datasets individually and results in component order permutation problems, IVA treats each source as a vector of components across subjects [1]. The IVA algorithm optimizes two key objectives: independence between different source vectors and dependence among components within the same source vector across subjects [3] [5]. This unique approach allows IVA to model both shared spatial patterns and subject-specific variations simultaneously.
For fMRI analyses, the IVA-GL algorithm—a combination of IVA with multivariate Gaussian (IVA-G) and Laplace (IVA-L) source component vectors—has become popular due to its attractive tradeoff between complexity and performance [3]. The typical implementation involves: (1) performing subject-level principal component analysis (PCA) on each subject's data, and (2) applying IVA-GL to estimate subject-specific components and time courses [3].
Group Information-Guided ICA (GIG-ICA)
GIG-ICA is a sophisticated variant of GICA that improves the estimation of subject-specific independent components (ICs) by incorporating group-level information as a guide during the optimization process [3] [51]. The method operates through a multi-objective function that simultaneously optimizes the independence of components within each subject and the correspondence between individual subject components and group-level ICs [3].
The GIG-ICA workflow typically involves: (1) subject-level PCA reduction, (2) group-level PCA and ICA on temporally concatenated data, (3) identification and removal of artifact-related group-level ICs, (4) estimation of subject-specific ICs guided by the remaining group-level ICs using a multi-objective optimization, and (5) computation of subject-specific time courses [3]. This approach ensures that resulting subject-specific networks maintain physiological meaning while being comparable across subjects.
Performance Comparison: Quantitative Findings
Simulation Studies
Simulation studies under controlled conditions provide critical insights into the fundamental strengths of IVA and GIG-ICA for different analysis scenarios.
Table 1: Performance Comparison Based on Simulation Studies
| Scenario | IVA Performance | GIG-ICA Performance | Key Findings |
|---|---|---|---|
| Subject-Common Sources | Moderate recovery accuracy | Better recovery accuracy for both components and time courses [3] [48] | GIG-ICA excels for networks consistent across subjects |
| Subject-Unique Sources | Outperforms GIG-ICA in component and time course estimation [3] [48] | Lower recovery accuracy | IVA superior for networks with high intersubject variability |
| Data Quality & Quantity | Robust across variations | Robust across variations | Both methods show resilience to data variations [3] |
| Inaccurate Component Number | Maintains reasonable performance | Maintains reasonable performance | Both methods tolerate modest misspecification [3] |
Real fMRI Data Applications
Studies using real fMRI data have validated and extended the findings from simulation work, demonstrating how each method performs in practical research scenarios.
Table 2: Performance Comparison Based on Real fMRI Data
| Metric | IVA Performance | GIG-ICA Performance | Study Context |
|---|---|---|---|
| Spatial Network Reliability | Moderate reliability | More reliable spatial functional networks [3] [48] | Test-retest resting-state fMRI [3] [48] |
| FNC Modularity | Lower modularity | Higher, more robust modularity of functional network connectivity (FNC) [3] [48] | Test-retest resting-state fMRI [3] [48] |
| Sensitivity to Group Differences | Identifies different discriminatory regions | Greater sensitivity to group differences; better classification accuracy [51] | Schizophrenia patients vs. healthy controls [51] |
| Intersubject Variability Capture | Lower modularity, suggesting greater sensitivity to ISV [5] | Higher modularity, indicating more consistent networks [5] | Autism Spectrum Disorder (ASD) study [5] |
| Clinical Correlation Detection | Identified significant negative correlation with ADOS social scores in ASD [5] | Different pattern of group differences | ABIDE dataset analysis [5] |
Experimental Protocols and Methodologies
Global Difference Maps (GDMs) for Method Comparison
Global Difference Maps (GDMs) provide a novel approach to compare factorization methods like ICA and IVA on real fMRI data where ground truth is unknown [7] [2]. The GDM methodology involves:
- Feature Extraction: For each subject and task, a linear regression is run on voxel-wise data using SPM. Regressors are created by convolving the hemodynamic response function with task predictors. The resulting regression coefficient maps serve as features [2].
- Factorization: Apply ICA and IVA separately to the features to obtain spatial components and their corresponding time courses [2].
- Difference Calculation: GDMs visually highlight differences between factorization methods and quantify the discriminative power of each decomposition. The maps overcome the challenge of aligning factors across different methods [7] [2].
- Application: In a study comparing schizophrenia patients and healthy controls across three tasks, GDMs revealed that IVA identified regions with higher discriminatory power between groups, though it was less effective than ICA at emphasizing regions found in only a subset of tasks [2].
Typical Analysis Workflow
A standard comparative analysis of IVA and GIG-ICA follows a systematic workflow that can be implemented using publicly available toolboxes like the Group ICA for fMRI Toolbox (GIFT).
Research Reagent Solutions
Table 3: Essential Tools and Resources for IVA and GIG-ICA Research
| Resource Category | Specific Tool/Resource | Function/Purpose |
|---|---|---|
| Software Toolbox | Group ICA of fMRI Toolbox (GIFT) | Provides implementations of both IVA-GL and GIG-ICA for fMRI analysis [3] |
| Test-Retest Dataset | Healthy control resting-state fMRI | Enables assessment of spatial network and FNC reliability [3] [48] |
| Clinical Validation Dataset | ABIDE (Autism Brain Imaging Data Exchange) | Publicly available dataset for comparing method performance in clinical populations [5] [52] |
| Clinical Validation Dataset | Schizophrenia datasets (e.g., from MRN) | Allows evaluation of sensitivity to group differences and classification performance [51] [2] |
| Validation Framework | Global Difference Maps (GDMs) | Enables visual comparison and quantification of discriminatory power between methods [7] [2] |
| Performance Metrics | Component recovery accuracy, FNC modularity, classification accuracy | Quantitative measures for comparing method performance [3] [51] |
Discussion and Research Recommendations
Method Selection Guidelines
The comparative evidence suggests that the choice between IVA and GIG-ICA should be guided by specific research goals and the nature of the biological question:
Use GIG-ICA when studying brain networks that are consistent across subjects, when the research priority is reliable identification of common functional networks, or when seeking maximum sensitivity to group differences between clinical populations and controls. GIG-ICA is particularly suitable for identifying biomarkers with high classification accuracy, as demonstrated in schizophrenia studies [51].
Choose IVA when investigating conditions with substantial intersubject variability, when the research aims to capture subject-unique features of functional organization, or when studying developmental or clinical populations where individual differences are theoretically important. IVA's strength in detecting clinical correlations, as shown in the ASD study with ADOS scores, makes it valuable for linking brain connectivity to behavioral measures [5].
Implementation Considerations
Future Directions
The comparison between IVA and GIG-ICA continues to evolve with several promising research directions:
Hybrid approaches that leverage the strengths of both methods for different aspects of analysis present an exciting frontier. For instance, using GIG-ICA to identify consistent core networks and IVA to capture variable aspects of functional organization within the same study.
Application to dynamic functional connectivity represents another promising direction, as both methods could potentially be extended to capture time-varying properties of brain networks [3].
Standardized benchmarking using large, publicly available datasets like ABIDE [52] will help establish more comprehensive guidelines for method selection across different research contexts and clinical populations.
Integration with other data modalities using multivariate data fusion approaches could benefit from the unique features of both IVA and GIG-ICA for capturing both consistent and variable patterns across different imaging modalities.
IVA and GIG-ICA represent significant advancements in the analysis of intersubject variability in functional neuroimaging data. While GIG-ICA excels at identifying consistent functional networks across subjects with high reliability and sensitivity to group differences, IVA demonstrates superior performance in capturing subject-unique features and networks with high intersubject variability. The choice between these methods should be guided by the specific research question, with GIG-ICA preferable for studies of conserved functional architecture and IVA more suitable for investigations where individual differences are theoretically central. The continued development and comparison of these methods will enhance our ability to extract meaningful biological insights from complex neuroimaging data.
Linking Algorithm Performance to Clinical and Behavioral Measures
The quest to identify robust biomarkers for neurological and psychiatric disorders heavily relies on data-driven methods to analyze functional magnetic resonance imaging (fMRI) data. Among these methods, Independent Component Analysis (ICA) and its multi-dataset extension, Independent Vector Analysis (IVA), are widely used for blind source separation to identify brain functional networks. A critical challenge in neuroimaging is linking the outputs of these algorithms to meaningful clinical and behavioral measures, a process that depends fundamentally on the discriminatory power of the methods—their ability to extract features that reliably differentiate between populations (e.g., healthy controls vs. patients) or correlate with external scores.
This guide objectively compares the discriminatory performance of ICA and IVA, with a specific focus on research utilizing Global Difference Maps (GDMs) [10]. GDMs offer a novel approach for visualizing and quantifying the spatial patterns of group differences captured by factorization algorithms, thereby providing a direct link to clinical measures. We synthesize evidence from simulation studies, test-retest reliability experiments, and clinical applications to provide a clear comparison for researchers and drug development professionals.
Methodological Foundations
Core Algorithms and Their Evolution
Independent Component Analysis (ICA) is an unsupervised linear dimensionality reduction technique that aims to decompose data into a set of statistically independent components (ICs) [43]. In the context of fMRI, spatial ICA (sICA) is commonly used to identify spatially independent brain networks from the mixed BOLD signal [31] [5]. A significant limitation of standard ICA in group studies is the correspondence problem—the arbitrary order of components across subjects makes group-level analysis challenging.
To address this, Group ICA (GICA) was developed, typically using a temporal concatenation approach to estimate group-level components, which are then back-reconstructed to the subject level [31] [3]. However, traditional back-reconstruction methods may sacrifice the accuracy of subject-specific components.
Independent Vector Analysis (IVA) is an extension of ICA that jointly decomposes multiple datasets (e.g., from multiple subjects) [53]. IVA optimizes two objectives simultaneously: the independence among components within each subject and the dependence across subjects for corresponding components [31] [3]. IVA models components from all subjects as component vectors and exploits their dependence to achieve source separation, making it particularly suited for capturing intersubject variability (ISV) [5].
Group Information-Guided ICA (GIG-ICA) is another advanced variant that improves upon GICA by using a multi-objective optimization framework. It estimates subject-specific ICs under the guidance of group-level ICs, simultaneously optimizing the independence of components within a subject and their correspondence with the group-level IC [31] [3] [5].
The Global Difference Map (GDM) is a model comparison technique that visually highlights and quantifies the differences between factorization methods based on their ability to uncover features that discriminate between groups or relate to external variables [10]. GDMs summarize the significance of latent subject weights across the brain, providing a comprehensive view of a method's discriminatory power without the need for a tedious component alignment step.
Essential Research Toolkit
Table 1: Key Research Reagents and Computational Tools
| Item Name | Function/Description | Relevance to ICA/IVA Studies |
|---|---|---|
| GIFT Toolbox\n(Group ICA of fMRI Toolbox) | A MATLAB toolbox for ICA and IVA analysis of neuroimaging data. | Provides implementations of GICA, GIG-ICA, and IVA-GL, enabling direct comparison of algorithms [31] [3]. |
| Statistical Parametric Mapping (SPM) | Statistical software for analyzing brain imaging data sequences. | Used for pre-processing fMRI data (e.g., realignment, normalization) and first-level general linear model (GLM) analysis to create regression coefficient maps for feature extraction [10]. |
| fALFF\n(Fractional Amplitude of Low-Frequency Fluctuations) | A metric to summarize the low-frequency power of spontaneous brain activity in resting-state fMRI. | Used to create a subjects by voxels by time windows tensor for analyzing evolving networks with methods like PARAFAC2 [45]. |
| SimTB\n(Simulation Toolbox for fMRI Data) | A toolbox for simulating fMRI data under a model of spatiotemporal separability. | Allows for the generation of synthetic fMRI data with known ground truth, enabling controlled evaluation of algorithm performance [53]. |
| ABIDE Dataset\n(Autism Brain Imaging Data Exchange) | A publicly available repository of brain imaging data from individuals with Autism Spectrum Disorder (ASD) and healthy controls. | Provides real clinical data for testing the discriminatory power of algorithms in identifying biomarkers for neurodevelopmental disorders [5]. |
Standard Experimental Workflow
The following diagram illustrates a generalized protocol for a comparative study of ICA and IVA, leading to the assessment of discriminatory power against clinical measures.
Figure 1: General workflow for comparing ICA and IVA discriminatory power.
Direct Performance Comparison
Quantitative Results from Simulation and Real Data Studies
Table 2: Comparative Performance of GIG-ICA and IVA
| Performance Metric | GIG-ICA Findings | IVA Findings | Supporting Evidence |
|---|---|---|---|
| Recovery of Subject-Common Sources | Superior. Better accuracy for components and time courses that are consistent across subjects [31]. | Lower accuracy for subject-common sources compared to GIG-ICA [31]. | Simulation studies [31] [3]. |
| Recovery of Subject-Unique Sources | Lower accuracy for components with high intersubject variability [31]. | Superior. Outperforms GIG-ICA in estimating components and time courses with high inter-subject variability [31]. | Simulation studies [31] [3]. |
| Spatial Network Reliability | Higher. Produces more reliable spatial functional networks in test-retest analyses [31]. | Lower test-retest reliability for spatial networks compared to GIG-ICA [31]. | Test-retest resting-state fMRI data [31]. |
| Functional Network Connectivity (FNC) Modularity | Higher and more robust. Yields FNC with a more stable and pronounced community structure [31] [5]. | Lower modularity, suggesting a less rigid community structure, potentially due to capturing more variability [5]. | Test-retest and clinical (e.g., ABIDE) datasets [31] [5]. |
| Correlation with Clinical Scores | Identifies significant group differences in FNC between patients and controls [5]. | Direct correlation identified. Found a statistically negative correlation between FNC in ASD and ADOS social scores (r = -0.26, p = 0.0489) [5]. | Analysis of ABIDE dataset (ASD vs. controls) [5]. |
| Age Prediction Performance | GIG-ICA in the Cerebellar Network (CRN) showed high prediction (R² = 0.91, RMSE = 3.05) [5]. | IVA in the Ventral Attention Network (VAN) showed high prediction (R² = 0.87, RMSE = 3.21) [5]. | Analysis of ABIDE dataset [5]. |
Illustrative Experimental Protocol: GDM Analysis of Multi-Task fMRI
Objective: To compare the discriminatory power of ICA and IVA in identifying brain regions that differentiate patients with schizophrenia from healthy controls across three fMRI tasks using Global Difference Maps [10].
- Feature Extraction: For each subject and each task (e.g., AOD, SIRP, SM), a linear regression is run on the voxel-wise time series using SPM. The regressors are the hemodynamic response function (HRF) convolved with task predictors. The resulting regression coefficient maps are used as features for decomposition [10].
- Data Decomposition:
- Apply ICA individually to the feature data from each task.
- Apply IVA jointly to the feature data from all three tasks, leveraging the dependence across tasks.
- Generation of Global Difference Maps (GDMs):
- For each component from ICA and IVA, perform a statistical test (e.g., t-test) on the subject weights between the patient and control groups.
- Create the GDM by aggregating the significance levels (e.g., -log(p-value)) of these tests across all components, projecting them back onto the brain voxels. Brighter regions in the GDM indicate higher discriminatory power [10].
- Outcome: The study [10] demonstrated that IVA could determine regions that were more discriminatory between patients and controls than ICA. However, this enhanced power came at the cost of not emphasizing some regions identified by ICA in a subset of the tasks.
Integrated Discussion and Research Outlook
The evidence consistently shows a trade-off between the discriminatory performance of GIG-ICA and IVA, which is rooted in their underlying modeling assumptions. GIG-ICA, by strongly enforcing correspondence with a group-level template, excels at identifying stable, subject-common networks. This leads to higher reliability and more robust modular FNC, making it suitable for studying disorders where a consistent group-level network aberration is hypothesized [31] [5].
In contrast, IVA's strength lies in its flexibility to capture intersubject variability (ISV). This makes it particularly powerful for disorders characterized by high heterogeneity, such as schizophrenia and autism spectrum disorder (ASD) [45] [5]. IVA's ability to model subject-unique features allows it to uncover subtler, more variable relationships with clinical measures, as evidenced by its direct correlation with ADOS social scores in ASD, a link not as readily found with GIG-ICA [5].
The choice between ICA/GIG-ICA and IVA should therefore be guided by the research question and the nature of the disorder. For validating a known network-based biomarker, GIG-ICA may be more appropriate. For exploring novel biomarkers in a highly heterogeneous patient population, IVA holds a distinct advantage. Future directions point towards the use of even more flexible models, such as PARAFAC2 tensor factorization, which can explicitly capture the temporal evolution of spatial networks, and the development of algorithms that can better balance the need for group consistency and the accommodation of individual differences [45].
Functional Network Connectivity (FNC) has become a cornerstone of modern neuroscience, providing a window into the brain's dynamic organization and its disruption in psychiatric and neurological disorders. FNC is operationally defined as the temporal dependency among independent components derived from functional magnetic resonance imaging (fMRI) data, capturing the complex, time-varying relationships between distributed brain networks [54]. The analysis of FNC patterns enables researchers to move beyond simple discrimination between patient and control groups, toward a deeper understanding of the neural mechanisms underlying brain disorders.
Data-driven factorization methods, particularly Independent Component Analysis (ICA) and its multiset extension Independent Vector Analysis (IVA), have emerged as powerful tools for FNC assessment. While both methods aim to extract meaningful neural signatures from complex fMRI data, they differ fundamentally in their approach to capturing intersubject variability (ISV) and their efficacy in revealing disorder-related connectivity alterations. This comparison guide objectively evaluates the performance characteristics of ICA versus IVA in assessing FNC patterns, with a specific focus on their discriminatory power as quantified through Global Difference Maps (GDMs).
Methodological Foundations: ICA vs. IVA for FNC
Independent Component Analysis (ICA) in FNC Research
ICA is a blind source separation technique that decomposes fMRI data into statistically independent components, each representing a spatially distinct brain network with its associated time course. In functional connectivity studies, spatial ICA (sICA) has become particularly prevalent for identifying resting-state networks (RSNs) such as the default mode network (DMN), salience network, and executive control networks [5]. The core principle of ICA is the assumption of statistical independence between source signals, which effectively captures spatially coherent patterns of neural activity.
Traditional group ICA (GICA) implementations often utilize a two-step approach: (1) data reduction through principal component analysis, and (2) application of the ICA algorithm to identify group-level components [5]. While effective for identifying common networks across subjects, standard GICA has limitations in capturing intersubject variability, potentially obscuring important individual differences in functional network organization.
Independent Vector Analysis (IVA) for Enhanced FNC Capture
IVA represents a multivariate extension of ICA that jointly decomposes multiple datasets, preserving source components across subjects while allowing for necessary variability. Unlike ICA, which assumes statistical independence between components, IVA maximizes the independence between component vectors while maintaining dependence within vectors across datasets [5]. This approach enables IVA to better capture intersubject variability while maintaining correspondence of components across subjects.
The IVA-GL framework, which incorporates both Gaussian (IVA-G) and Laplace (IVA-L) density models based on higher-order frequency dependencies, has demonstrated particular effectiveness for FNC analysis. This advancement allows IVA-GL to separate time-delayed and convolved signals more effectively than standard ICA approaches [5].
Comparative Performance Analysis via Global Difference Maps
Global Difference Maps (GDMs) provide a novel methodological framework for comparing factorization techniques on real fMRI data where ground truth is unknown [7] [2]. GDMs visually highlight differences between methods and quantify the discriminative power of each decomposition for differentiating between clinical populations and healthy controls.
Discriminatory Power in Schizophrenia Research
Application of GDMs to compare ICA and IVA on multi-task fMRI data from 109 patients with schizophrenia and 138 healthy controls revealed significant differences in discriminatory performance [2]. The analysis demonstrated that IVA identified brain regions with greater discriminatory power between patients and controls compared to ICA. However, this enhanced sensitivity came at the cost of reduced effectiveness in emphasizing regions found in only a subset of tasks, where ICA maintained an advantage.
Table 1: Method Comparison Using Global Difference Maps in Schizophrenia
| Performance Metric | ICA | IVA |
|---|---|---|
| Overall Discriminatory Power | Moderate | Higher |
| Task-Specific Regional Emphasis | Stronger | Weaker |
| Intersubject Variability Capture | Limited | Enhanced |
| Component Alignment Across Subjects | Requires back-reconstruction | Simultaneous estimation |
FNC Analysis in Autism Spectrum Disorder
Comparative analysis of group information-guided ICA (GIG-ICA) and IVA-GL in Autism Spectrum Disorder (ASD) revealed robust correspondence between methods in several key networks [5]. The similarity between components extracted by both methods was highest in the sensorimotor network (|r| = 0.8125), with strong correlations also observed in cerebellum (|r| = 0.7813), default mode (|r| = 0.7263), and visual networks (|r| = 0.7503).
Despite these similarities, the methods demonstrated distinct characteristics in FNC analysis. IVA-GL showed lower modularity, suggesting greater sensitivity for estimating networks with higher intersubject variability. Conversely, GIG-ICA identified functional networks with more distinct modularity patterns and revealed more significant differences in FNC between healthy controls and ASD participants [5].
Table 2: Network Similarity and Performance in ASD Analysis
| Functional Network | Similarity ( | r | ) | IVA-GL Performance | GIG-ICA Performance |
|---|---|---|---|---|---|
| Sensorimotor (SOM) | 0.8125 | High ISV capture | Stable modularity | ||
| Cerebellum (CRN) | 0.7813 | Effective for age prediction | - | ||
| Default Mode (DMN) | 0.7263 | - | Significant FNC differences | ||
| Ventral Attention (VAN) | 0.7574 | Effective for age prediction | - | ||
| Visual (VSN) | 0.7503 | - | - |
Experimental Protocols and Workflows
GDM Implementation for Method Comparison
The GDM approach enables quantitative comparison of factorization methods through a structured pipeline [2]. The implementation involves feature extraction through general linear model regression, application of factorization methods (ICA and IVA) to obtain spatial maps and time courses, and computation of difference maps that highlight discriminatory regions.
Key steps in the GDM protocol include:
- Feature Extraction: For task-based fMRI, regression coefficients from GLM analysis are used as features
- Factorization: Application of ICA and IVA to derive spatial components and time courses
- Group Difference Calculation: Statistical comparison of component features between patient and control groups
- Difference Map Generation: Visualization of regions with maximal between-group discrimination for each method
Dynamic FNC Analysis Protocol
Dynamic FNC (dFNC) analysis captures time-varying connectivity patterns through a sliding window approach [55] [56]. The standard protocol includes:
- Data Preprocessing: Head motion correction, nuisance signal regression, spatial normalization, and smoothing
- ICA Decomposition: Group ICA using algorithms such as Infomax with ICASSO reliability enhancement
- Component Selection: Identification of meaningful neural components through template matching and visual inspection
- dFNC Computation: Sliding window correlation analysis between component time courses
- Clustering: k-means or similar approaches to identify recurrent connectivity states
- Temporal Metric Calculation: Analysis of dwell times, transition probabilities, and fractional occupancies
Figure 1: Experimental workflow for FNC analysis and method comparison
The Scientist's Toolkit: Essential Research Reagents
Table 3: Essential Tools for FNC Research
| Tool/Category | Specific Examples | Function in FNC Research |
|---|---|---|
| Decomposition Algorithms | Infomax ICA, IVA-GL, GIG-ICA | Blind source separation of fMRI data into functional networks |
| Analysis Toolboxes | GIFT, FSL, SPM, Graph Theoretical Network Analysis Toolbox | Implementation of preprocessing, ICA, and connectivity analysis pipelines |
| Statistical Frameworks | Global Difference Maps (GDMs), Support Vector Machines (SVM) | Method comparison and classification based on FNC features |
| Dynamic Analysis Methods | Sliding window correlation, k-means clustering, hidden Markov models | Capture of time-varying connectivity patterns and brain states |
| Validation Metrics | Mean square residue (MSR), participation coefficient (PC) | Evaluation of bicluster quality and network modularity |
Applications Across Disorders and Cognitive Domains
FNC Alterations in Neurological and Psychiatric Disorders
Research utilizing ICA and IVA has revealed characteristic FNC alterations across multiple disorders. In Alzheimer's disease, dFNC analysis has identified distinct connectivity states, with patients showing significantly longer dwell times in states characterized by specific patterns of intra- and inter-network dysfunction [55]. These temporal metrics demonstrated negative correlations with cognitive scores, providing potential biomarkers of disease severity.
In asthma patients, combined static and dynamic FNC analysis revealed increased within-network connectivity in visual and sensorimotor regions, alongside disrupted connectivity in default mode and frontoparietal networks [56]. These alterations showed associations with cognitive and emotional symptoms, highlighting the utility of FNC for understanding neuropsychiatric comorbidities in medical conditions.
Cognitive Performance Prediction
The combination of structural and functional connectivity has shown particular promise for explaining cognitive performance across domains [57]. Principal component regression analysis revealed that executive function was best explained by combined models of functional and structural connectivity, while language performance was equally well explained by combined models and functional connectivity alone. These findings suggest domain-specific advantages for different connectivity modalities in cognitive neuroscience research.
Figure 2: Method selection guidelines based on analytical priorities
The comparative assessment of ICA and IVA for FNC analysis reveals a nuanced landscape where method selection should be guided by specific research objectives. IVA demonstrates superior capability for capturing intersubject variability and providing enhanced discriminatory power for disorders with heterogeneous presentations, such as schizophrenia and autism spectrum disorder. Conversely, ICA maintains advantages for identifying consistent network patterns across subjects and emphasizing task-specific regional differences.
Global Difference Maps have emerged as a valuable framework for objectively quantifying these methodological tradeoffs, enabling researchers to select optimal analytical approaches based on empirical performance characteristics rather than theoretical considerations alone. As FNC research continues to evolve, the integration of multimodal connectivity data and the development of increasingly sophisticated dynamic analysis approaches will further enhance our understanding of brain network organization and its disruption in clinical populations.
Conclusion
The comparative analysis of ICA and IVA reveals a nuanced landscape where each method offers distinct advantages for fMRI analysis. IVA consistently demonstrates superior capability in capturing intersubject variability and identifying highly discriminatory regions for group comparisons, particularly in disorders like schizophrenia and ASD. However, this enhanced discriminatory power may come at the cost of reduced sensitivity to task-specific networks that ICA can identify. Global Difference Maps emerge as a crucial methodological advancement, enabling objective comparison of factorization methods on real fMRI data without requiring ground truth. For future biomedical research, selection between ICA and IVA should be guided by specific research questions—IVA for disorders with high intersubject variability and biomarker discovery, and ICA for studying consistent functional networks across populations. Further development of these analytical frameworks promises to enhance our understanding of neurological disorders and accelerate the development of targeted interventions through improved biomarker identification.
References
- 1. Independent vector analysis (IVA): Multivariate approach ... [https://www.sciencedirect.com/science/article/abs/pii/S1053811907010622]
- 2. A Method to Compare the Discriminatory Power of Data- ... [https://pmc.ncbi.nlm.nih.gov/articles/PMC6258321/]
- 3. Comparison of IVA and GIG-ICA in Brain Functional Network ... [https://pmc.ncbi.nlm.nih.gov/articles/PMC5437155/]
- 4. A graph-theoretical analysis of GICA vs. IVA [https://www.sciencedirect.com/science/article/abs/pii/S0165027015001028]
- 5. Comparative analysis of group information-guided ... [https://www.frontiersin.org/journals/neuroscience/articles/10.3389/fnins.2023.1252732/full]
- 6. Independent Component Analysis - ML [https://www.geeksforgeeks.org/machine-learning/ml-independent-component-analysis/]
- 7. A method to compare the discriminatory power of data- ... [https://pubmed.ncbi.nlm.nih.gov/30389489/]
- 8. Example box 3.1: Single subject ICA [https://www.fmrib.ox.ac.uk/primers/rest_primer/3.1_ICA_single_subject/index.html]
- 9. Automated Classification of Resting-State fMRI ICA ... [https://pmc.ncbi.nlm.nih.gov/articles/PMC8971556/]
- 10. A method to compare the discriminatory power of data- ... [https://www.sciencedirect.com/science/article/abs/pii/S0165027018303169]
- 11. Capturing inter-subject variability with group independent ... [https://pmc.ncbi.nlm.nih.gov/articles/PMC3690335/]
- 12. Capturing inter-subject variability with group independent ... [https://www.sciencedirect.com/science/article/abs/pii/S1053811911011712]
- 13. A Scalable Approach to Independent Vector Analysis by ... [https://www.mdpi.com/1424-8220/23/11/5333]
- 14. Brainglance: Visualizing Group Level MRI Data at One ... [https://www.frontiersin.org/journals/neuroscience/articles/10.3389/fnins.2019.00972/full]
- 15. Identification of Homogeneous Subgroups from Resting ... [https://www.mdpi.com/1424-8220/23/6/3264]
- 16. A survey of brain functional network extraction methods ... [https://www.sciencedirect.com/science/article/abs/pii/S0166223624000912]
- 17. Brain functional connectivity analysis of fMRI-based ... [https://www.frontiersin.org/journals/medicine/articles/10.3389/fmed.2025.1540297/full]
- 18. Data-Driven Approach to Dynamic Resting State Functional ... [https://pubmed.ncbi.nlm.nih.gov/40736265/]
- 19. Denoising brain networks using a fixed mathematical phase ... [https://pmc.ncbi.nlm.nih.gov/articles/PMC10619417/]
- 20. Bias in data-driven replicability analysis of univariate brain- ... [https://www.nature.com/articles/s41598-025-89257-w]
- 21. Independent component analysis: recent advances - PMC [https://pmc.ncbi.nlm.nih.gov/articles/PMC3538438/]
- 22. Independent component analysis - Wikipedia [https://en.wikipedia.org/wiki/Independent_component_analysis]
- 23. An evaluation of independent component analyses with an application to resting-state fMRI - PMC [https://www.ncbi.nlm.nih.gov/pmc/articles/PMC3954232/]
- 24. Unbiased group‐level statistical assessment of ... [https://pmc.ncbi.nlm.nih.gov/articles/PMC6870691/]
- 25. Comparison of multi‐subject ICA methods for analysis ... [https://pmc.ncbi.nlm.nih.gov/articles/PMC3117074/]
- 26. Comparing the reliability of different ICA algorithms for fMRI ... [https://journals.plos.org/plosone/article?id=10.1371/journal.pone.0270556]
- 27. A comparison of independent component analysis algorithms and measures to discriminate between EEG and artifact components - PubMed [https://pubmed.ncbi.nlm.nih.gov/28268452/]
- 28. Overview of Functional Magnetic Resonance Imaging - PMC [https://pmc.ncbi.nlm.nih.gov/articles/PMC3073717/]
- 29. Functional magnetic resonance imaging [https://en.wikipedia.org/wiki/Functional_magnetic_resonance_imaging]
- 30. A Hitchhiker's Guide to Functional Magnetic Resonance ... [https://www.frontiersin.org/journals/neuroscience/articles/10.3389/fnins.2016.00515/full]
- 31. Comparison of IVA and GIG-ICA in Brain Functional ... [https://www.frontiersin.org/journals/neuroscience/articles/10.3389/fnins.2017.00267/full]
- 32. Comparison of group ICA, GIG-ICA, and IVA-GL [https://pubmed.ncbi.nlm.nih.gov/34793852/]
- 33. Systematic evaluation of fMRI data-processing pipelines for ... [https://www.nature.com/articles/s41467-024-48781-5]
- 34. IVA to detect spatial map differences between ... [https://archive.ismrm.org/2014/3462.html]
- 35. Independent Component Analysis (ICA) [https://towardsdatascience.com/independent-component-analysis-ica-a3eba0ccec35/]
- 36. Twinned neuroimaging analysis contributes to improving ... [https://www.nature.com/articles/s41598-024-71174-z]
- 37. Deriving Autism Spectrum Disorder Functional Networks ... [https://arxiv.org/abs/2106.09000]
- 38. Comparative analysis of group information-guided ... [https://pubmed.ncbi.nlm.nih.gov/37928736/]
- 39. Frontiers | Preserving subject variability in group fMRI analysis ... [https://www.frontiersin.org/journals/systems-neuroscience/articles/10.3389/fnsys.2014.00106/full]
- 40. Independent vector analysis: Model, applications, challenges [https://www.sciencedirect.com/science/article/abs/pii/S0031320323000778]
- 41. Independent Component Analysis (ICA) – demystified [https://pressrelease.brainproducts.com/independent-component-analysis-demystified/]
- 42. Independent Vector Analysis for Feature Extraction in Motor ... [https://pmc.ncbi.nlm.nih.gov/articles/PMC11359939/]
- 43. PCA/LDA/ICA : a components analysis algorithms ... [https://towardsdatascience.com/pca-lda-ica-a-components-analysis-algorithms-comparison-c5762c4148ff/]
- 44. Impact of inter-individual variability on the estimation ... [https://www.sciencedirect.com/science/article/pii/S1053811921003918]
- 45. Tracing Evolving Networks Using Tensor Factorizations vs. ... [https://www.frontiersin.org/journals/neuroscience/articles/10.3389/fnins.2022.861402/full]
- 46. Preserving subject variability in group fMRI analysis - PubMed [https://pubmed.ncbi.nlm.nih.gov/25018704/]
- 47. Disjoint Subspaces for Common and Distinct Component Analysis: Application to the Fusion of Multi-task FMRI Data - PMC [https://www.ncbi.nlm.nih.gov/pmc/articles/PMC8217295/]
- 48. Comparison of IVA and GIG-ICA in Brain Functional Network ... [https://pubmed.ncbi.nlm.nih.gov/28579940/]
- 49. We need to talk about reliability: making better use of test ... [https://pmc.ncbi.nlm.nih.gov/articles/PMC6536112/]
- 50. The Test–Retest Reproducibility, Standard Error ... [https://www.mdpi.com/2076-3417/13/11/6358]
- 51. Group ICA for identifying biomarkers in schizophrenia [https://www.sciencedirect.com/science/article/pii/S221315821930097X]
- 52. ICA-Based Resting-State Networks Obtained on Large ... [https://www.mdpi.com/2306-5729/10/7/109]
- 53. (PDF) Development of ICA and IVA Algorithms with Application to... [https://www.academia.edu/69453240/Development_of_ICA_and_IVA_Algorithms_with_Application_to_Medical_Image_Analysis]
- 54. A Method for Functional Network Connectivity Among ... [https://pmc.ncbi.nlm.nih.gov/articles/PMC3164840/]
- 55. Altered dynamic functional network connectivity patterns in ... [https://www.frontiersin.org/journals/aging-neuroscience/articles/10.3389/fnagi.2025.1617191/full]
- 56. Altered static and dynamic functional network connectivity ... [https://www.sciencedirect.com/science/article/abs/pii/S0306452225003318]
- 57. Combination of structural and functional connectivity ... [https://www.sciencedirect.com/science/article/pii/S1053811922006462]