GC×GC-MS vs. GC-MS in Forensics: A Comparative TRL Analysis for Complex Evidence
This article provides a comparative analysis of the Technology Readiness Levels (TRL) of comprehensive two-dimensional gas chromatography-mass spectrometry (GC×GC-MS) versus traditional one-dimensional GC-MS for forensic analysis.
GC×GC-MS vs. GC-MS in Forensics: A Comparative TRL Analysis for Complex Evidence
Abstract
This article provides a comparative analysis of the Technology Readiness Levels (TRL) of comprehensive two-dimensional gas chromatography-mass spectrometry (GC×GC-MS) versus traditional one-dimensional GC-MS for forensic analysis. Aimed at researchers and forensic scientists, it explores the foundational principles of both techniques, detailing how GC×GC-MS overcomes critical limitations of GC-MS, such as coelution in complex samples like sexual lubricants, automotive paints, and tire rubber. The scope extends to methodological applications, troubleshooting common challenges, and a validation-focused comparison of analytical figures of merit, including sensitivity, resolution, and reliability. The synthesis concludes that GC×GC-MS represents a higher-TRL solution for complex evidence, with significant implications for improving the accuracy and efficiency of forensic investigations.
GC-MS to GC×GC-MS: Foundational Principles and Forensic Evolution
For decades, Gas Chromatography-Mass Spectrometry (GC-MS) has remained the undisputed gold standard in forensic chemical analysis, providing the critical foundation for evidence analysis in judicial systems worldwide. This status is built upon its unparalleled ability to both separate complex mixtures and provide definitive identification of individual components—a dual capability that makes it indispensable for analyzing everything from controlled substances to trace evidence. The technique's versatility for isolating and analyzing different components in unknown mixtures, often without requiring substantial method development for each new sample, has established it as the primary tool in the forensic analysis of trace evidence such as ignitable liquids and drugs [1]. Within forensic science laboratories, traditional one-dimensional GC–MS is considered a "go-to" analytical technique, primarily because of its proven reliability, robustness, and extensive established protocols that meet rigorous legal standards [1] [2].
The enduring position of traditional GC–MS as the benchmark is particularly remarkable given the emergence of advanced multidimensional separation techniques like Comprehensive Two-Dimensional Gas Chromatography (GC×GC–MS). While these newer approaches offer enhanced separation power for exceptionally complex mixtures, they have not displaced traditional GC–MS for the vast majority of routine forensic applications [1] [2]. This continued dominance stems from a crucial balance: traditional GC–MS provides sufficient separation capability for most forensic casework while offering superior method simplicity, faster analysis times, lower operational costs, and extensive established legal precedent for courtroom admissibility. The technique's robust performance across diverse forensic applications—from seized drug analysis to fire debris investigation—ensures its position remains secure even as the technological landscape evolves [3] [4].
Analytical Principles: The Technical Foundation of a Gold Standard
Core Technology and Separation Mechanisms
The analytical power of traditional GC–MS stems from the effective coupling of two powerful techniques: gas chromatography for physical separation and mass spectrometry for chemical identification. In the gas chromatography stage, a sample is vaporized and injected into a chromatographic column, where components separate based on their differing distributions between a mobile gas phase and a stationary liquid phase coated on the column interior. This separation process is governed by each compound's unique physicochemical properties, including volatility and polarity, resulting in distinct retention times as they elute from the column [2].
The mass spectrometry stage provides the definitive identification capability. As separated compounds elute from the GC column, they are ionized, typically using electron ionization (EI), which generates characteristic fragment patterns. These charged fragments are then separated based on their mass-to-charge ratios (m/z) in the mass analyzer, creating a mass spectrum that serves as a molecular "fingerprint" for each compound [5]. The most common configuration for traditional GC–MS in forensic laboratories uses a single quadrupole mass analyzer, which provides an optimal balance of performance, cost, and operational simplicity for routine analysis [5].
Operational Modes and Detection Capabilities
Traditional GC–MS systems operate in two primary data acquisition modes, each serving distinct forensic purposes. In full-scan mode, the instrument collects complete mass spectra across a specified mass range, typically at rates of 10-20 spectra per second. This mode provides comprehensive data for unknown identification and library searching, as the entire mass spectrum is available for each eluting compound. The total ion chromatogram (TIC) generated represents the sum of all ion signals at each point in the analysis, serving as a nearly universal detection method [5].
For targeted analysis requiring higher sensitivity, selected ion monitoring (SIM) mode offers significantly lower detection limits by focusing the mass analyzer on specific ions characteristic of target compounds. Rather than scanning the entire mass range, the detector cycles between predefined masses, increasing the dwell time and thus the signal-to-noise ratio for these specific ions. This noise reduction makes SIM particularly valuable for detecting trace-level analytes in complex forensic matrices, though it sacrifices the comprehensive spectral data obtained in full-scan mode [5].
Figure 1: Traditional GC-MS Analytical Workflow
Traditional GC-MS Versus GC×GC-MS: A Technical Comparison
Performance Benchmarking and Capability Assessment
The comparison between traditional GC–MS and comprehensive two-dimensional GC–MS (GC×GC–MS) reveals a nuanced relationship where each technique excels in different forensic scenarios. While GC×GC–MS provides dramatically increased peak capacity through orthogonal separations, this advantage comes with significant complexity that often makes it unsuitable for routine forensic analysis. The core limitation of traditional GC–MS—coelution of compounds in complex mixtures—represents the primary motivation for implementing GC×GC–MS in research settings, particularly for samples containing hundreds of components such as sexual lubricants, automobile paints, and tire rubber [1].
Table 1: Technical Comparison of Traditional GC-MS vs. GC×GC-MS
| Parameter | Traditional GC–MS | GC×GC–MS |
|---|---|---|
| Separation Dimensions | Single dimension | Two orthogonal dimensions |
| Peak Capacity | Limited (typically 100-500) | Significantly enhanced (typically 1,000-10,000) [2] |
| Analysis Time | 10-30 minutes for typical methods [3] | Significantly longer due to comprehensive separation |
| Method Development | Straightforward, established protocols | Complex, requires specialized expertise |
| Coelution Resolution | Limited, a key disadvantage [1] | Excellent, can resolve coeluting compounds [1] [2] |
| Forensic Legal Precedent | Extensive, gold standard status [2] | Limited, primarily research applications [2] |
| Operational Costs | Lower | Significantly higher |
| Technology Readiness Level | 9 (Actual system proven in operational environment) | 4-7 (Technology demonstration to system prototype) [2] |
Application-Specific Performance and Limitations
The practical implications of these technical differences become evident in specific forensic applications. In the analysis of synthetic lubricants, traditional GC–MS demonstrates adequate performance but reveals limitations when confronted with extremely complex mixtures. For example, when analyzing oil-based personal lubricants containing multiple organic components, traditional GC–MS shows substantial coelution between retention times of 7 and 20 minutes, potentially obscuring minor components. GC×GC–MS analysis of the same samples reveals more than 25 different components, successfully separating compounds that coelute in traditional analysis [1].
Similar performance patterns emerge in other challenging forensic applications. In automotive paint analysis using pyrolysis-GC–MS, coelution occurs with certain compounds of interest such as toluene and 1,2-propandial, limiting the ability to differentiate clear coats. The implementation of py-GC×GC–MS provides increased separation of paint components, particularly for peaks that typically coelute in traditional GC–MS [1]. This enhanced separation power comes at the cost of significantly increased methodological complexity, requiring specialized instrumentation and expertise not routinely available in operational forensic laboratories.
Experimental Protocols: Methodologies for Forensic Analysis
Optimized Protocol for Seized Drug Analysis
The application of traditional GC–MS in forensic drug analysis continues to evolve, with recent methodological advances focusing on reducing analysis time while maintaining analytical confidence. A recently developed and validated rapid GC–MS method for seized drug screening demonstrates this progression, achieving a significant reduction in total analysis time from 30 to 10 minutes while maintaining excellent analytical performance. This method, developed using an Agilent 7890B GC system coupled to a 5977A single quadrupole mass spectrometer, employed a DB-5 ms column (30 m × 0.25 mm × 0.25 μm) with helium carrier gas at a fixed flow rate of 2 mL/min [3].
The optimized temperature program for this rapid method began with an initial temperature of 80°C, held for 0.5 minutes, then ramped at 45°C/min to 180°C, followed by a second ramp at 30°C/min to 300°C, with a final hold time of 1.5 minutes. This aggressive temperature programming enabled the significant reduction in analysis time while maintaining sufficient chromatographic separation for confident identification. Method validation demonstrated excellent performance characteristics, with limits of detection improving by at least 50% for key substances including cocaine and heroin, achieving detection thresholds as low as 1 μg/mL for cocaine compared to 2.5 μg/mL with conventional methods. The method exhibited exceptional repeatability and reproducibility with relative standard deviations (RSDs) less than 0.25% for stable compounds under operational conditions [3].
Table 2: Research Reagent Solutions for Forensic GC-MS Analysis
| Reagent/Material | Function in Analysis | Application Example |
|---|---|---|
| DB-5 ms GC Column | (30 m × 0.25 mm × 0.25 μm) provides medium-polarity separation | General screening of drugs and ignitable liquids [3] |
| Methanol (99.9%) | Solvent for standard preparation and sample extraction | Liquid-liquid extraction of seized drugs [3] |
| Certified Reference Standards | Quantitative calibration and method validation | Preparation of calibration curves for controlled substances [3] [6] |
| Helium Carrier Gas | (99.999% purity) mobile phase for chromatographic separation | All GC-MS applications requiring high-purity carrier gas [3] |
| Solid-Phase Extraction (SPE) Cartridges | Sample clean-up and concentration | Extraction of opioids from oral fluid [6] |
| Deuterated Internal Standards | Compensation for matrix effects and variability | Quantification of fentanoids in biological samples [6] |
Specialized Protocol for Opioid Detection in Oral Fluid
The analysis of opioids and fentanoids in biological matrices represents another critical forensic application where traditional GC–MS methodologies continue to demonstrate robust performance. A novel GC–MS/MS method has been developed and validated for the quantification of four opioids and seven fentanyl analogues in oral fluid, utilizing a fast and simple solid-phase extraction (SPE) procedure that enables identification and quantification of all analytes in just 11 minutes. This method employed electron impact ionization (EI) with multiple reaction monitoring (MRM) acquisition, providing the specificity and sensitivity required for detecting these potent compounds at low ng/mL concentrations [6].
Method validation according to international guidelines demonstrated a satisfactory degree of linearity (R² ≥ 0.993), precision, accuracy, and sensitivity, with limits of detection ranging from 0.10 to 0.20 ng/mL. The method successfully addressed the significant analytical challenge presented by the complex oral fluid matrix, achieving recoveries consistently higher than 57% for all target analytes. When applied to real forensic samples collected during traffic stops, the method detected codeine, morphine, fentanyl, and norfentanyl in several specimens that had previously tested negative using immunoassay screening, demonstrating its superior sensitivity and forensic utility [6].
Technology Readiness and Legal Admissibility: The Courtroom Benchmark
Legal Standards and Forensic Admissibility
The gold standard status of traditional GC–MS in forensic science extends beyond technical performance to encompass established legal admissibility in judicial proceedings. Court systems maintain specific standards for the admission of expert testimony based on scientific techniques, and traditional GC–MS has consistently met these rigorous benchmarks across international jurisdictions. In the United States, the Daubert Standard (from Daubert v. Merrell Dow Pharmaceuticals, Inc., 1993) establishes four key factors for evaluating scientific evidence: whether the technique can be and has been tested; whether it has been peer-reviewed and published; the known or potential error rate; and whether it has gained general acceptance in the relevant scientific community [2].
Traditional GC–MS satisfies all Daubert criteria comprehensively, with extensive published literature documenting its reliability, well-characterized error rates, and universal acceptance in the forensic science community. Similarly, the earlier Frye Standard (from Frye v. United States, 1923), which requires that scientific techniques be "generally accepted in the relevant scientific community," presents no barrier to GC–MS evidence. This established legal precedent creates a significant advantage for traditional GC–MS over emerging techniques like GC×GC–MS, which currently lack similar extensive courtroom validation [2].
Technology Readiness Assessment
The concept of Technology Readiness Levels (TRL) provides a structured framework for evaluating the maturity of analytical techniques in forensic science. Traditional GC–MS operates at TRL 9, representing "actual system proven in operational environment"—the highest maturity level indicating routine implementation in casework. In contrast, comprehensive two-dimensional GC–MS applications in forensics currently range between TRL 4-7, spanning "technology validation in laboratory environment" to "system prototype demonstration in operational environment" [2].
This TRL disparity explains why GC×GC–MS remains primarily a research technique despite its superior separation capabilities for complex samples. The transition from established GC–MS methods to GC×GC–MS for routine forensic analysis requires not just instrumental acquisition, but also extensive method validation, operator training, quality assurance protocols, and—critically—demonstration of reliability in actual casework that can withstand legal scrutiny under Daubert and related standards [2].
Traditional GC–MS maintains its gold standard status in forensic science through a powerful combination of analytical robustness, methodological maturity, and established legal precedent. While advanced techniques like GC×GC–MS offer compelling advantages for specific challenging applications involving extremely complex mixtures, they complement rather than replace traditional GC–MS for the majority of routine forensic analysis. The enduring value of traditional GC–MS lies in its optimal balance of performance, efficiency, and admissibility—a combination that continues to make it the foundational technique for forensic chemical analysis.
As forensic science continues to evolve, traditional GC–MS methodologies are also advancing, with developments in rapid screening protocols, enhanced sensitivity through improved ionization techniques, and expanded compound libraries. These innovations ensure that traditional GC–MS will maintain its central role in forensic laboratories worldwide, even as researchers continue to explore the potential of more complex multidimensional techniques for specialized applications. For the foreseeable future, traditional GC–MS remains the indispensable workhorse of the forensic laboratory, providing the analytical certainty required by the justice system.
In forensic science, the analysis of complex evidentiary samples—from illicit drugs and explosive residues to lubricants and paint pyrolysates—routinely encounters a fundamental analytical limitation: coelution. This phenomenon occurs when two or more compounds in a mixture possess such similar chemical properties that they exit the chromatography column simultaneously, preventing their individual identification and quantification. In traditional one-dimensional gas chromatography-mass spectrometry (GC-MS), this coelution presents a significant barrier to accurate analysis, potentially obscuring minor components, leading to misidentification, and complicating the interpretation of evidence. This guide objectively compares the performance of comprehensive two-dimensional gas chromatography-mass spectrometry (GC×GC-MS) against traditional GC-MS, focusing on their capabilities to overcome coelution, supported by experimental data and detailed methodologies.
Performance Comparison: GC×GC-MS vs. Traditional GC-MS
The table below summarizes the key performance characteristics of both techniques when applied to complex forensic mixtures, highlighting the impact on coelution resolution.
Table 1: Performance Comparison for Forensic Mixture Analysis
| Performance Characteristic | Traditional GC-MS | GC×GC-MS |
|---|---|---|
| Peak Capacity | Limited, one-dimensional separation [2] | Significantly increased through two independent separation mechanisms [2] |
| Ability to Resolve Coelutions | Limited; severe coelution often requires alternative techniques [1] [7] | High; can deconvolute coeluted components, even those with near-identical spectra [8] [1] |
| Sensitivity for Minor Components | Minor components can be hidden by larger, coeluting peaks [1] | Increased signal-to-noise ratio reveals trace components previously obscured [2] |
| Resulting Data Complexity | Simple, linear chromatogram [1] | Complex, two-dimensional chromatographic "fingerprint" [1] [7] |
| Forensic Technology Readiness | Gold standard; legally established for routine use [2] | Advanced research stage; requires further validation for court admissibility [2] |
Experimental Data and Protocols
Experiment 1: Analysis of Forensic Lubricants
Objective: To characterize the complex composition of an oil-based personal lubricant and overcome the coelution observed in traditional GC-MS [1] [7].
Methodology:
- Sample Preparation: Lubricant samples were prepared via hexane solvent extraction [1].
- GC-MS Protocol: Analysis was performed using an Agilent 7890B GC coupled to a 5977 quadrupole MS. The sample was injected onto a single capillary column, resulting in a chromatogram with significant coelution between 7 and 20 minutes [1].
- GC×GC-MS Protocol: The same GC-MS system was used but with a comprehensive two-dimensional configuration. The effluent from the first column (1D) was focused and re-injected at regular intervals into a second, chemically different column (2D) via a modulator [1] [2].
Results and Data:
- GC-MS Outcome: The chromatogram indicated more than the six labeled ingredients but was hampered by "a substantial amount of coelution," preventing full characterization [1].
- GC×GC-MS Outcome: The two-dimensional separation readily resolved over 25 distinct components. Peaks that coeluted in the first dimension were separated based on their different affinities for the second-dimension stationary phase [1].
Table 2: Experimental Results for Lubricant Analysis
| Analytical Technique | Number of Components Detected | Key Observation on Coelution |
|---|---|---|
| GC-MS | >6 (limited by coelution) | Substantial coelution between 7-20 min retention time [1] |
| GC×GC-MS | >25 | Successful separation of coeluted peaks into individual compounds [1] |
Experiment 2: Identification of Isomeric New Psychoactive Substances (NPS)
Objective: To detect and identify isomeric mixtures in illicit drug casework, even under conditions of severe coelution [8].
Methodology:
- Technique: Gas Chromatography-Vacuum Ultraviolet Spectroscopy (GC-VUV). While not GC×GC-MS, this experiment directly addresses the limitation of coelution in traditional GC-MS and demonstrates an advanced deconvolution approach.
- Protocol: Severe coelution was deliberately induced at elevated GC temperatures. VUV spectral deconvolution software was applied to the resulting data. To simulate the encounter of a novel substance, spectra were systematically removed from the reference library [8].
Results and Data:
- The deconvolution software correctly identified both substances in a mixture, even with near-identical VUV spectra and almost full coelution [8].
- When a compound was not in the library (simulating a novel NPS), the software still detected the coelution, flagging it via a match score below 0.998 [8].
Experiment 3: Pyrolysis-GC-MS of Automotive Paint Clear Coats
Objective: To differentiate automotive clear coats by analyzing their pyrolysates, overcoming the coelution of key compounds in standard Py-GC-MS [1] [7].
Methodology:
- Sample Introduction: A Pryoprobe 4000 was used for flash pyrolysis (ramped from 50 °C to 750 °C) of automotive clear coat samples [1].
- Py-GC-MS Protocol: The pyrolysates were injected into a traditional GC-MS system.
- Py-GC×GC-MS Protocol: The pyrolysates were analyzed using a comprehensive two-dimensional GC-MS system.
Results and Data:
- Py-GC-MS Outcome: Coelution of compounds like toluene/1,2-propandial and α-methylstyrene/n-butyl methacrylate limited the ability to differentiate clear coats [1].
- Py-GC×GC-MS Outcome: The technique provided increased separation. For instance, α-methylstyrene (11.776 min 1D retention time) and n-butyl methacrylate (11.600 min 1D retention time), which coeluted on the first column, were resolved from one another on the second dimension column [1].
Visualizing the Workflows
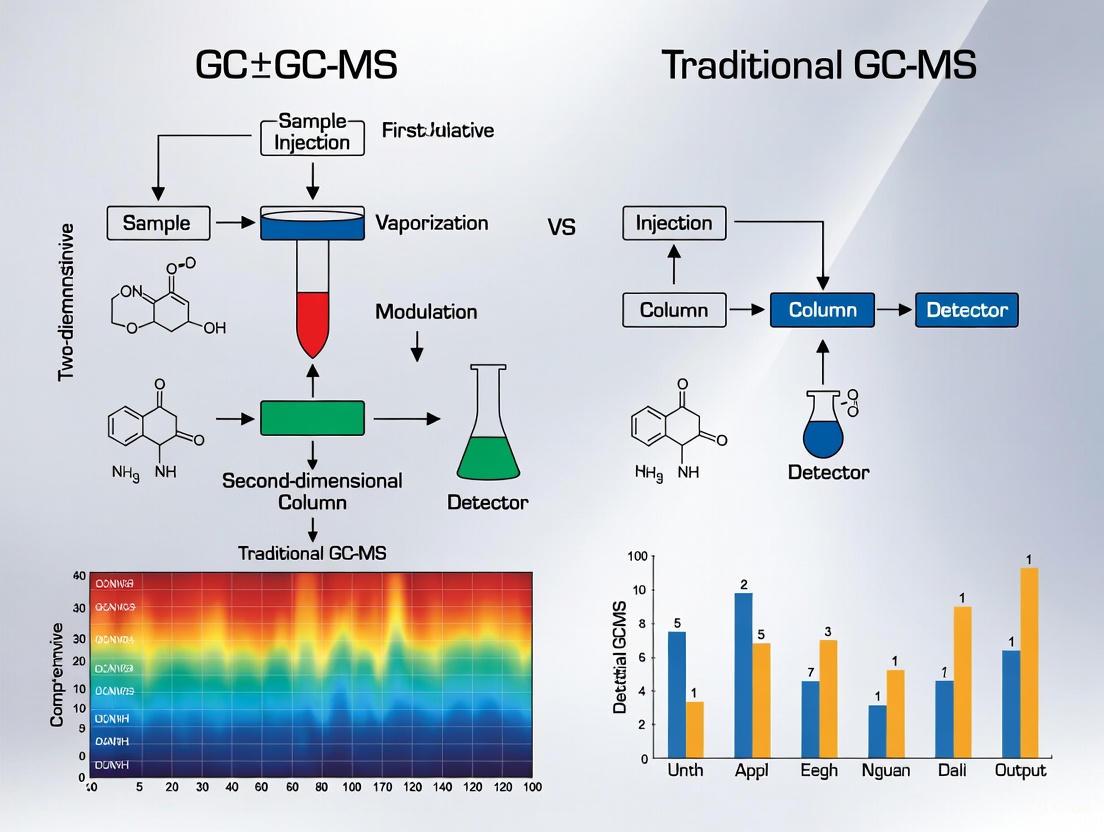
The diagram below illustrates the core difference between the one-dimensional GC-MS workflow, where coelution is a terminal problem, and the GC×GC-MS workflow, which adds a second separation dimension to resolve coeluted compounds.
The Scientist's Toolkit: Essential Research Reagents and Materials
The table below lists key materials and reagents used in the featured experiments for the analysis of complex forensic mixtures.
Table 3: Essential Research Reagents and Materials for Forensic GC×GC-MS Analysis
| Item | Function/Description | Example Use Case |
|---|---|---|
| Hexane | Organic solvent for extracting organic components from complex matrices. | Solvent extraction of lubricants from swabs or other evidence [1]. |
| Dichloromethane | Organic solvent for extracting a wide range of organic compounds. | Extraction of organic gunshot residue (OGSR) and smokeless powders from various substrates [9]. |
| Methanol | Polar organic solvent for extraction. | Exhaustive extraction of OGSR from PTFE collection tapes via sonication [9]. |
| Flocked Swabs | Sample collection tool designed for high elution efficiency of particles and cells. | Collection of trace evidence from surfaces; superior for recovery of intact cells for DNA analysis [10]. |
| AutoMACS Elution Buffer | A specialized buffer solution for maintaining cell integrity during elution. | Elution of intact white blood cells from swabs to aid in DNA mixture deconvolution [10]. |
| Capillary GC Columns (Two) | The core separation components in GC×GC. The 1D column is typically non-polar, and the 2D column is polar. | Providing two independent separation mechanisms to resolve coelutions [2]. |
The data and experimental protocols presented confirm that coelution is a fundamental limitation of traditional GC-MS when analyzing complex forensic mixtures. While GC-MS remains the court-accepted gold standard, it can fail to resolve chemically similar compounds in samples like lubricants, paint pyrolysates, and isomeric drugs. GC×GC-MS directly addresses this core limitation by employing a second, independent separation dimension, dramatically increasing peak capacity and enabling the deconvolution of coeluted peaks. This provides forensic researchers with a powerful tool for uncovering a more complete chemical profile of evidence. However, the adoption of GC×GC-MS into routine casework is gated by the need for extensive validation, establishment of known error rates, and achieving general acceptance within the legal community to meet admissibility standards like Daubert and Mohan [2]. For the forensic researcher facing increasingly complex evidence, GC×GC-MS represents a promising, high-resolution solution to the persistent challenge of coelution.
The analysis of complex chemical mixtures, from metabolites to forensic evidence, has long been a challenge in analytical science. Traditional gas chromatography-mass spectrometry (GC-MS) has served as the benchmark technique for separating and identifying volatile compounds, but encounters limitations with highly complex samples where component coelution can obscure critical findings. Comprehensive two-dimensional gas chromatography mass spectrometry (GC×GC-MS) represents a fundamental paradigm shift in separation technology, offering unprecedented resolution for forensic applications. This guide objectively compares the performance of GC×GC-MS against traditional GC-MS within the context of Technology Readiness Level (TRL) assessment for forensic analysis, providing researchers and drug development professionals with experimental data to evaluate these platforms for their specific applications.
The core principle of GC×GC-MS involves coupling two GC columns with different stationary phases through a thermal modulator [11]. Typically, the first column is a standard non-polar or mid-polar column (30-60 m), while the second column is much shorter (1-2 m) with a different stationary phase and is operated at a higher temperature [11]. This configuration provides superior chromatographic peak capacity, selectivity, and lower detection limits for small molecule analysis [11]. As forensic scientists increasingly encounter complex evidence such as sexual lubricants, automotive paints, and explosive residues, GC×GC-MS offers a powerful solution to analytical challenges that surpass the capabilities of conventional GC-MS.
Experimental Comparison: GC-MS vs. GC×GC-MS Performance Metrics
Methodology for Comparative Analysis
To objectively evaluate the performance differences between GC-MS and GC×GC-MS platforms, a structured comparative study was conducted analyzing metabolite extracts from 109 human serum samples [11]. The experimental design provided a direct comparison under controlled conditions:
Sample Preparation: All samples underwent identical preparation procedures. Serum samples (100 µL) were extracted using ice-cold methanol/chloroform (3:1 v:v) containing internal standards (heptadecanoic acid and norleucine at 10 µg/mL). After centrifugation, supernatants were dried under nitrogen and derivatized using a two-step method: first with methoxyamine in pyridine (20 mg/mL, 90 min at 30°C), followed by MSTFA with 1% TMCS (60 min at 70°C) [11].
Instrumentation Configuration: Both platforms used the same GC-TOF MS system (Agilent 7890A GC with LECO Pegasus TOF MS) to ensure comparable detection. For GC-MS, a 60 m × 0.25 mm × 0.25 µm DB-5 ms UI column was used. For GC×GC-MS, the same primary column was coupled with a 1 m × 0.25 mm × 0.25 µm DB-17 ms secondary column [11].
Chromatographic Conditions: Both methods used helium carrier gas at 1.0 mL/min, with a temperature program from 60°C to 300°C at 5°C/min. The GC×GC-MS employed a modulator period of 2.5 s and a secondary oven temperature offset of +10°C relative to the primary oven [11].
Quality Control: A pooled serum quality control (QC) sample was analyzed after every nine biological samples to assess reproducibility and correct for technical variations [11].
Quantitative Performance Comparison
The experimental data revealed substantial differences in analytical performance between the two platforms, summarized in the table below.
Table 1: Performance comparison between GC-MS and GC×GC-MS platforms based on experimental data from 109 human serum samples
| Performance Metric | GC-MS | GC×GC-MS | Improvement Factor |
|---|---|---|---|
| Peaks Detected (SNR ≥ 50) | Not specified | ~3× more than GC-MS | 3× [11] |
| Metabolites Identified (Rsim ≥ 600) | Not specified | ~3× more than GC-MS | 3× [11] |
| Statistically Significant Biomarkers | 23 metabolites | 34 metabolites | 1.5× [11] |
| Common Biomarkers | 9 metabolites detected in both platforms | 9 metabolites detected in both platforms | Consistent detection [11] |
The data demonstrates that GC×GC-MS provides significantly enhanced capability for detecting and identifying chemical compounds in complex mixtures. The threefold increase in detected peaks and identified metabolites highlights the superior resolution of the comprehensive two-dimensional approach [11]. This enhanced performance directly translates to more comprehensive biomarker discovery, with GC×GC-MS identifying nearly 50% more statistically significant biomarkers compared to traditional GC-MS [11].
Table 2: Forensic application comparison between GC-MS and GC×GC-MS
| Application | GC-MS Performance | GC×GC-MS Advantage |
|---|---|---|
| Sexual Lubricant Analysis | Substantial coelution between 7-20 min retention times [1] | >25 components clearly separated; resolution of coeluted peaks between 10-15 min FDRT [1] |
| Automotive Paint Pyrolysis | Coelution of toluene and 1,2-propandial; limited differentiation of similar clear coats [1] | Clear separation of α-methylstyrene and n-butyl methacrylate; improved discrimination of similar samples [1] |
| Tire Rubber Analysis | Coelution issues with complex mixtures containing 200+ components [1] | Enhanced separation of pyrolysates from complex rubber formulations [1] |
Forensic Applications: Practical Advantages of GC×GC-MS
Sexual Lubricant Analysis
In forensic sexual assault investigations, the analysis of lubricants becomes crucial when DNA evidence is unavailable. Traditional GC-MS analysis of an oil-based lubricant with six labeled ingredients revealed substantial coelution between retention times of 7 and 20 minutes, limiting the ability to differentiate components [1]. GC×GC-MS analysis of the same sample clearly resolved more than 25 different components, with specific separation of compounds that coeluted in traditional GC-MS between 10-15 minute first dimension retention times [1]. The technique also enabled differentiation between various natural oil-based and plant-based lubricants based on their distinct chromatographic profiles, particularly between FDRTs of 7 and 17 minutes [1].
Automotive Paint and Tire Analysis
Automotive paint represents a chemically complex evidence type with discriminatory value in hit-and-run and vehicular investigations. While pyrolysis-GC-MS currently offers the highest discrimination among standard techniques, coelution issues persist with certain compounds like toluene and 1,2-propandial [1]. Py-GC×GC-MS demonstrates improved separation of clear coat components, successfully resolving α-methylstyrene and n-butyl methacrylate that coelute in the first dimension [1]. Similarly, for tire rubber analysis—evidence commonly encountered in road accidents—GC×GC-MS provides enhanced separation of pyrolysates from the extremely complex chemical mixture containing over 200 components including natural and synthetic rubbers, oils, plasticizers, antioxidants, and vulcanizing agents [1].
Technical Workflow: Principles of GC×GC-MS Operation
System Configuration and Separation Mechanism
The fundamental advancement of GC×GC-MS lies in its two-dimensional separation approach, which dramatically increases peak capacity compared to traditional one-dimensional GC-MS. The following diagram illustrates the complete analytical workflow from sample introduction to data analysis.
GC×GC-MS Analytical Workflow
The thermal modulator plays a critical role in the GC×GC-MS system, trapping and refocusing effluent from the first dimension column before reinjecting it as narrow chemical pulses into the second dimension column [11]. This modulation process occurs rapidly, with typical modulation periods of 2-6 seconds, ensuring that the separation achieved in the first dimension is preserved [11]. The second dimension column, with its different stationary phase (often more polar) and higher operating temperature, provides an orthogonal separation mechanism based on different chemical properties [11].
Peak Capacity and Resolution Enhancement
The enhanced separation power of GC×GC-MS can be visualized through its two-dimensional chromatographic output, which provides significantly increased peak capacity compared to traditional GC-MS. The following diagram illustrates the resolution of coeluted compounds through orthogonal separation mechanisms.
Separation Mechanism Comparison
The orthogonal separation mechanism in GC×GC-MS provides a multiplicative increase in peak capacity, theoretically equal to the product of the peak capacities of each individual dimension [11]. In practical applications, this translates to a 3-8 fold increase in the number of detected peaks, as demonstrated in the experimental comparison of human serum samples [11]. This enhanced resolution is particularly valuable for complex forensic samples like sexual lubricants, where traditional GC-MS shows substantial coelution, while GC×GC-MS can clearly resolve dozens of individual components [1].
Essential Materials and Research Reagent Solutions
The implementation of GC×GC-MS methodology requires specific instrumentation components and reagents optimized for comprehensive two-dimensional separation. The following table details key research solutions essential for successful analysis.
Table 3: Essential research reagents and materials for GC×GC-MS analysis
| Component | Specification | Function |
|---|---|---|
| Primary GC Column | 30-60 m × 0.25 mm × 0.25 µm DB-5 ms (phenyl arylene polymer) [11] | First dimension separation based primarily on volatility and weak polarity |
| Secondary GC Column | 1-2 m × 0.25 mm × 0.25 µm DB-17 ms ((50%-phenyl)-methylpolysiloxane) [11] | Second dimension orthogonal separation with different selectivity |
| Thermal Modulator | Dual stage quad-jet thermal modulator with 2-6 second modulation period [11] | Traps and refocuses effluent from first dimension, reinjecting as narrow pulses to second dimension |
| Derivatization Reagents | Methoxyamine in pyridine (20 mg/mL) and MSTFA with 1% TMCS [11] | Enhance volatility and thermal stability of metabolites through methoximation and silylation |
| Internal Standards | Heptadecanoic acid and norleucine (10 µg/mL in extraction solvent) [11] | Monitor and correct for technical variations in sample preparation and analysis |
| Retention Index Standard | C10-C40 alkane series [11] | Enable retention time alignment and compound identification across multiple samples |
The experimental data and practical applications demonstrate that GC×GC-MS represents a significant advancement over traditional GC-MS for the analysis of complex mixtures in forensic science. While GC-MS remains a reliable and widely implemented technique (higher TRL for routine analysis), GC×GC-MS offers superior resolution, sensitivity, and compound identification capabilities (rapidly advancing TRL for specialized forensic applications). The technology shows particular promise for evidence types with extreme chemical complexity, including sexual lubricants, automotive paints, and tire rubber, where traditional GC-MS suffers from coelution issues that limit discriminatory power [1].
For forensic researchers and drug development professionals, the implementation of GC×GC-MS requires consideration of both advantages and challenges. The enhanced separation comes with increased methodological complexity, more demanding data processing requirements, and the need for specialized expertise [11]. However, for applications where comprehensive characterization of complex mixtures is essential, GC×GC-MS provides an unparalleled analytical tool that can reveal chemical information inaccessible to traditional one-dimensional separation techniques. As the forensic community continues to adopt and validate this technology, GC×GC-MS is poised to become an indispensable tool for the next generation of trace evidence analysis.
For decades, Gas Chromatography-Mass Spectrometry (GC-MS) has served as the undisputed gold standard in forensic trace evidence analysis, providing the foundational technology for crime laboratories worldwide [1]. Its ability to simultaneously separate complex mixtures and provide definitive compound identification has made it indispensable for analyzing evidence ranging from illicit drugs and ignitable liquids to toxicological samples [2] [12]. This article examines the established Technology Readiness Level (TRL) of traditional GC-MS within forensic laboratories, contrasting it with the emerging implementation of comprehensive two-dimensional gas chromatography (GC×GC-MS) through the lens of historical workload, legal precedent, and analytical performance.
The TRL scale, when applied to forensic science, must consider not only analytical maturity but also legal admissibility—a dimension unique to this field. While GC-MS operates at TRL 4 (validated in relevant environments) across most forensic applications, GC×GC-MS primarily resides at TRL 3 (proof-of-concept demonstrated in forensic research) with progression toward TRL 4 in specific applications like fire debris and oil spill analysis [2]. This disparity stems from GC-MS's long-established history of meeting rigorous legal standards for evidence admission, including the Daubert Standard and Frye Standard in the United States and the Mohan Criteria in Canada, which require demonstrated reliability, known error rates, and general acceptance in the relevant scientific community [2].
Analytical Foundations: Technical Mechanisms and Performance
Core GC-MS Technology and Operational Modes
Traditional GC-MS couples the separation power of gas chromatography with the identification capabilities of mass spectrometry. In this system, volatile compounds are separated through a capillary column based on their partitioning between a mobile gas phase and a stationary liquid phase, followed by ionization (typically via electron ionization) and mass analysis [5] [13]. This process generates both chromatographic retention data and mass spectral information, creating a two-dimensional dataset for each analyte.
GC-MS operates in two primary detection modes. Full-scan acquisition collects complete mass spectra across a specified mass range, enabling untargeted analysis and library searching for unknown identification. Selected Ion Monitoring (SIM) enhances sensitivity for targeted analysis by monitoring only specific ions characteristic to compounds of interest, reducing chemical noise and improving detection limits [5]. The resulting data can be presented as a Total Ion Chromatogram (TIC), which shows all detected compounds, or as Extracted Ion Chromatograms (EICs), which display only ions specific to particular analytes [5].
Table 1: Fundamental Operational Modes of GC-MS in Forensic Analysis
| Operational Mode | Mechanism | Primary Forensic Applications | Key Advantages |
|---|---|---|---|
| Full-Scan MS | Collects complete mass spectra (e.g., m/z 50-500) continuously throughout separation | Drug screening, unknown substance identification, fire debris analysis | Universal detection; library searchable data; retrospective analysis |
| Selected Ion Monitoring (SIM) | Monitors only pre-selected mass-to-charge ratios | Targeted toxicology, pesticide analysis, quantitation of known compounds | Enhanced sensitivity; reduced chemical noise; lower detection limits |
Advanced GC-MS Configurations
Beyond single quadrupole systems, advanced GC-MS configurations have emerged to address specific analytical challenges. GC-Tandem MS (GC-MS/MS), typically using a triple quadrupole platform, introduces an additional fragmentation and selection stage that significantly enhances selectivity and reduces background interference [5]. In this configuration, the first quadrupole (Q1) selects a precursor ion, the second (Q2) induces collision-induced dissociation, and the third (Q3) analyzes the resulting product ions.
The most sensitive mode for quantitative analysis in GC-MS/MS is Multiple Reaction Monitoring (MRM), where both Q1 and Q3 are set to specific ions, monitoring a defined transition unique to the target compound [5]. For example, in caffeine analysis, this might involve the transition from mass 194 to mass 109 [5]. This process provides exceptional selectivity by dramatically reducing the possibility of two compounds sharing both the same precursor and product ions, effectively eliminating isobaric interferences that can complicate traditional GC-MS analysis.
GC-MS/MS MRM Workflow: Diagram illustrating the sequential stages of Multiple Reaction Monitoring in a triple quadrupole system.
Performance Benchmarking: Quantitative Comparison with Emerging Techniques
Direct Comparison of GC-MS and GC×GC-MS Performance
A metabolomics study comparing GC-MS and GC×GC-TOF-MS for analyzing human serum samples from 109 subjects demonstrated distinct performance differences. When analyzing pooled quality control samples, GC×GC-MS detected approximately three times as many chromatographic peaks at a signal-to-noise ratio (SNR) ≥ 50 and led to the identification of three times more metabolites through spectral library matching [11]. The study attributed this advantage primarily to the enhanced chromatographic resolution of GC×GC-MS, which reduces peak overlap and facilitates more accurate spectrum deconvolution for both identification and quantification [11].
Table 2: Experimental Performance Comparison Between GC-MS and GC×GC-MS
| Performance Metric | GC-MS | GC×GC-MS | Experimental Context |
|---|---|---|---|
| Detected Peaks (SNR ≥ 50) | Baseline (1x) | ~3x more peaks | Human serum metabolomics [11] |
| Identified Metabolites | 23 significant | 34 significant | Biomarker discovery study [11] |
| Sensitivity | Lower | ~10x more sensitive (IMS comparison) | VOC analysis with TD-GC-MS-IMS [14] |
| Chromatographic Resolution | Limited peak capacity | Superior resolution; reduces coelution | Complex mixture analysis [11] [1] |
Comparison with Alternative Detection Systems
Thermal desorption GC coupled with both IMS and MS provides another performance perspective. In VOC analysis, IMS demonstrated approximately ten times higher sensitivity than MS, achieving limits of detection in the picogram per tube range [14]. However, MS maintained a broader linear dynamic range—remaining linear over three orders of magnitude (up to 1000 ng/tube) compared to IMS, which typically maintained linearity for only one order of magnitude before transitioning to a logarithmic response [14]. This highlights the complementary nature of different detection systems and the continued value of MS for quantitative applications requiring wide calibration ranges.
Established Forensic Workload and Legal Admissibility
Current Implementation Across Evidence Types
GC-MS maintains an extensive presence across diverse forensic disciplines, supported by decades of casework and legal challenges. Its applications include:
- Illicit Drug Analysis: Identification and quantification of controlled substances in seized materials [2]
- Forensic Toxicology: Screening and confirmation of drugs, poisons, and metabolites in biological specimens [2] [12]
- Fire Debris Analysis: Characterization of ignitable liquid residues in arson investigations [2]
- Explosives and CBRN Materials: Detection of explosive residues and chemical threat agents [2]
The technique's versatility across these evidence types has solidified its position as a fundamental tool in modern crime laboratories, with established protocols and validation procedures that meet international quality standards.
Legal Precedent and Courtroom Admissibility
The legal admissibility of GC-MS data is well-established through numerous precedents under evidence standards including the Daubert Standard, Frye Standard, and Federal Rule of Evidence 702 in the United States, and the Mohan Criteria in Canada [2]. These legal frameworks evaluate factors including:
- Whether the technique can be and has been tested
- Whether the technique has been peer-reviewed and published
- The known or potential error rate of the technique
- The existence and maintenance of standards controlling the technique's operation
- Whether the technique has gained general acceptance in the relevant scientific community [2]
GC-MS satisfies all these criteria through its extensive documented history, standardized methodologies, established proficiency testing programs, and widespread implementation in forensic laboratories worldwide. This stands in contrast to emerging techniques like GC×GC-MS, which despite demonstrating superior analytical performance in research settings, lack this extensive legal foundation for routine evidentiary applications [2].
Essential Methodologies and Research Toolkit
Standard Experimental Protocol: Drug Analysis in Biological Specimens
A typical validated protocol for forensic drug analysis using GC-MS involves:
- Sample Preparation: 100 µL of serum, urine, or blood is combined with 1 mL of ice-cold methanol/chloroform (3:1 v:v) containing internal standards (e.g., heptadecanoic acid and norleucine at 10 µg/mL). The mixture is vortexed and centrifuged (15 min at 18,000 rcf, 4°C) [11].
- Derivatization: The dried extract undergoes a two-step process: (1) reaction with 50 µL of methoxyamine in pyridine (20 mg/mL) for 90 minutes at 30°C with agitation, followed by (2) silylation with 50 µL of MSTFA with 1% TMCS for 60 minutes at 70°C with agitation [11].
- GC-MS Analysis: 1 µL is injected in splitless mode with helium carrier gas at 1.0 mL/min. Oven temperature programs typically start at 60°C (hold 1 min), ramped at 5°C/min to 300°C (hold 12 min) [11].
- Data Acquisition and Interpretation: Full-scan data (e.g., m/z 45-1000) is collected at 20 spectra/second. Data reduction and metabolite identification are performed using vendor software with spectral library matching (e.g., NIST, Fiehn Metabolomics Library) [11].
Forensic Drug Analysis Workflow: Standardized protocol for processing biological specimens using GC-MS.
Essential Research Reagent Solutions
Table 3: Key Reagents and Materials for Forensic GC-MS Analysis
| Reagent/Material | Function | Typical Specification |
|---|---|---|
| Methoxyamine hydrochloride | Protection of carbonyl groups; oxime formation | Pyridine solution, 20 mg/mL [11] |
| N-Methyl-N-(trimethylsilyl)trifluoroacetamide (MSTFA) | Silylation agent for hydroxyl and amine groups | With 1% trimethylchlorosilane (TMCS) as catalyst [11] |
| Alkane Retention Index Standard | Retention time calibration | C10-C40 hydrocarbons in hexane [11] |
| Internal Standards | Quantification control and matrix effects compensation | Deuterated analogs or structural analogs (e.g., norleucine) [11] |
| DB-5ms UI GC Column | Primary separation medium | (5%-phenyl)-methylpolysiloxane, 30-60m length [11] |
GC-MS maintains its status as the technological cornerstone of modern forensic chemistry, operating at a mature TRL (Level 4) with an extensive history of casework application and legal validation. While emerging techniques like GC×GC-MS demonstrate superior chromatographic resolution and sensitivity in research settings, their current TRL (Level 3, progressing to 4 in specific applications) reflects ongoing development toward full implementation in routine forensic casework [2]. The established precedent, historical workload, and legal admissibility of GC-MS ensure its continued dominance in crime laboratories, even as complementary advanced technologies evolve to address increasingly complex analytical challenges. For the foreseeable future, GC-MS will remain the benchmark against which emerging forensic technologies are measured, serving as the workhorse instrumentation for the majority of evidentiary analysis in forensic chemistry worldwide.
Gas chromatography-mass spectrometry (GC-MS) has long been regarded as the gold standard in forensic trace evidence analysis due to its ability to separate and identify components in complex mixtures [15]. However, the evolving complexity of forensic evidence—from sophisticated sexual lubricants to multicomponent automotive materials—has begun to outpace the capabilities of traditional one-dimensional GC-MS [15]. The fundamental limitation lies in coelution, where multiple compounds exit the chromatography column simultaneously, preventing their individual identification and quantification [15]. This analytical shortcoming becomes critical when analyzing forensic samples containing hundreds of components, such as tire rubber (containing over 200 components) or condom lubricants with complex natural oil formulations [15].
Comprehensive two-dimensional gas chromatography (GC×GC-MS) represents a paradigm shift in forensic chemical analysis by introducing an orthogonal separation mechanism that significantly increases peak capacity and resolution [2]. By connecting two columns of different stationary phases in series with a modulator, GC×GC-MS can separate compounds that would otherwise coelute in traditional GC-MS [2]. This technological advancement is particularly valuable for non-targeted forensic applications where a wide range of analytes must be analyzed simultaneously without prior knowledge of the sample composition [2]. The technique provides a unique chromatographic "fingerprint" that reveals both major components and trace compounds that may have previously remained hidden [15].
Technology Readiness Level (TRL) Comparison: GC×GC-MS vs. Traditional GC-MS
TRL Assessment Framework
For forensic analytical techniques to be adopted into routine casework, they must meet rigorous standards set by both the scientific and legal communities [2]. In the United States, the Daubert Standard guides the admissibility of expert testimony by evaluating whether a technique has been tested, peer-reviewed, has a known error rate, and is generally accepted in the relevant scientific community [2]. Similarly, Canada's Mohan Criteria establishes requirements for relevance, necessity, absence of exclusionary rules, and properly qualified experts [2]. These legal frameworks directly influence the Technology Readiness Level (TRL) of analytical methods in forensic science.
Table 1: Technology Readiness Level (TRL) Comparison Between GC-MS and GC×GC-MS in Forensic Applications
| Forensic Application | Traditional GC-MS TRL | GC×GC-MS TRL | Key Advancements Enabled by GC×GC-MS |
|---|---|---|---|
| Illicit Drug Analysis | TRL 9 (Routine operational use) | TRL 3-4 (Research stage) | Improved separation of complex mixtures and cutting agents [2] |
| Forensic Toxicology | TRL 9 (Routine operational use) | TRL 3-4 (Research stage) | Enhanced detection of minor metabolites and novel psychoactive substances [2] |
| Ignitable Liquid Analysis (Arson) | TRL 9 (Routine operational use) | TRL 4 (Technology validated in lab) | Superior chemical fingerprinting for petroleum-based accelerants [2] |
| Oil Spill Tracing | TRL 9 (Routine operational use) | TRL 4 (Technology validated in lab) | Increased discrimination capability for hydrocarbon source attribution [2] |
| Sexual Lubricant Analysis | TRL 6-7 (Technology demonstration in relevant environment) | TRL 3 (Experimental proof of concept) | Detection of coeluting components in complex natural oil matrices [15] |
| Fingerprint Chemical Profiling | TRL 5-6 (Technology development) | TRL 3 (Experimental proof of concept) | Monitoring time-dependent chemical changes for age estimation [16] |
| Automotive Paint & Tire Analysis | TRL 7-8 (System qualified) | TRL 3-4 (Research to validation) | Pyrolysis product separation for enhanced discrimination [15] |
Forensic Applications and TRL Progression
The TRL comparison reveals that while traditional GC-MS has reached maturity and widespread adoption across most forensic disciplines (TRL 9), GC×GC-MS remains primarily in the research and development phase (TRL 3-4) for the majority of applications [2]. However, GC×GC-MS demonstrates particular promise in forensic domains requiring the analysis of highly complex chemical mixtures that overwhelm traditional GC-MS capabilities. For example, in the analysis of sexual assault evidence, GC×GC-MS has successfully differentiated natural oil-based lubricants that confound traditional GC-MS due to substantial coelution between retention times of 7-20 minutes [15]. Where GC-MS might identify 6-10 components, GC×GC-MS can resolve over 25 different chemical constituents, providing significantly greater discriminatory power for evidence comparison [15].
The progression of GC×GC-MS toward higher TRL levels requires focused research on intra- and inter-laboratory validation, error rate analysis, and standardization [2]. Recent studies applying machine learning and chemometric modeling to GC×GC-MS data represent crucial steps toward establishing the known error rates and statistical foundation required for courtroom admissibility [17] [16]. As these validation studies accumulate, the technology readiness of GC×GC-MS for routine forensic casework is expected to advance accordingly.
Experimental Protocols and Performance Comparison
Methodologies for Forensic Analysis
Table 2: Standardized Experimental Protocols for GC-MS and GC×GC-MS Forensic Analysis
| Analytical Parameter | Traditional GC-MS Protocol | GC×GC-MS Protocol | Forensic Advantage |
|---|---|---|---|
| Sample Preparation | Hexane solvent extraction [15] | Hexane solvent extraction [15] | Consistent workflow integration |
| Injection Technique | Split-splitless injector [15] | Split-splitless injector [15] | Method transferability |
| Pyrolysis Conditions | Flash pyroprobe: 50°C for 2s, ramp to 750°C at 50°C/s, hold for 2s [15] | Identical pyrolysis conditions [15] | Direct comparison of results |
| GC System Configuration | Agilent 7890B GC [15] | Agilent 7890B GC with modulator [15] | Hardware compatibility |
| Mass Spectrometer | 5977 quadrupole MS (Agilent) [15] | 5977 quadrupole MS (Agilent) [15] | Consistent detection platform |
| Data Analysis | Targeted compound identification | Untargeted analysis with chemometric modeling [16] | Enhanced pattern recognition |
Quantitative Performance Data
Table 3: Performance Comparison Between GC-MS and GC×GC-MS in Forensic Evidence Analysis
| Performance Metric | Traditional GC-MS | GC×GC-MS | Application Context |
|---|---|---|---|
| Peak Capacity | ~400 [2] | ~1,200 [2] | Theoretical separation power |
| Number of Detected Components | 6-10 major components [15] | 25+ components [15] | Sexual lubricant analysis |
| Coelution Resolution | α-methylstyrene and n-butyl methacrylate coelute [15] | Complete baseline separation [15] | Automotive clear coat analysis |
| Signal-to-Noise Ratio | Standard sensitivity | 2-5x increase for minor components [15] | Trace compound detection |
| Confidence in Identification | Moderate (spectral overlap) | High (orthogonal retention indices) [16] | Fingerprint aging markers |
Recent research demonstrates that GC×GC-MS provides substantially improved forensic discrimination compared to traditional GC-MS across multiple evidence types. In automotive paint analysis, pyrolysis-GC×GC-MS successfully separated α-methylstyrene and n-butyl methacrylate, which consistently coelute in traditional GC-MS analysis [15]. This enhanced separation capability is particularly valuable for clear coat analysis, where these compounds serve as diagnostic markers for manufacturer differentiation [15]. Similarly, in fingerprint chemical profiling, GC×GC-TOF-MS enables monitoring of subtle, time-dependent changes in fingerprint composition that are undetectable with traditional GC-MS, potentially enabling forensic age estimation of latent prints [16].
The implementation of machine learning algorithms for GC×GC-MS data interpretation further enhances its forensic utility. A 2025 study by Malmborg et al. demonstrated that a convolutional neural network (CNN) applied to GC×GC-MS data of diesel oils achieved superior source attribution compared to traditional statistical models using selected peak ratios [17]. The CNN-based approach yielded a median likelihood ratio of approximately 1800 for same-source comparisons, significantly higher than the 180 obtained using traditional feature-based methods [17]. This demonstrates how GC×GC-MS combined with advanced data science techniques can provide stronger probabilistic evidence for courtroom proceedings.
Analytical Workflow and Signaling Pathways
The fundamental advantage of GC×GC-MS lies in its orthogonal separation mechanism, which significantly expands the analytical space for compound separation. The following diagram illustrates the key technological differences and data flow between traditional GC-MS and GC×GC-MS systems:
Figure 1: Comparative analytical workflows of traditional GC-MS versus GC×GC-MS for forensic analysis. The critical difference is the modulator that transfers unresolved fractions from the first dimension to a second column with different separation mechanics, effectively addressing coelution [15] [2].
The modulator serves as the "heart" of the GC×GC-MS system, capturing narrow bands of effluent from the primary column and reinjecting them into the secondary column for additional separation [2]. This process occurs throughout the entire analysis, typically with a modulation period of 1-5 seconds [2]. The resulting data is visualized as a contour plot rather than a traditional chromatogram, providing a two-dimensional separation landscape where chemically related compounds form structured patterns [15].
Essential Research Reagent Solutions for Forensic GC×GC-MS
Successful implementation of GC×GC-MS in forensic research requires specific reagents, reference materials, and consumables. The following table details essential research reagent solutions for method development and validation:
Table 4: Essential Research Reagent Solutions for Forensic GC×GC-MS Analysis
| Reagent/Consumable | Technical Function | Application Example | Forensic Importance |
|---|---|---|---|
| Dichloromethane | Sample dilution solvent | Diesel oil dilution (1:7 v/v) for hydrocarbon analysis [17] | Optimal extraction of non-polar compounds |
| Hexane | Lubricant extraction solvent | Sexual lubricant solvent extraction [15] | Efficient recovery of natural oils and waxes |
| Alkane Standard Mixtures | Retention index calibration | Establishing first and second dimension retention indices [16] | Compound identification confidence |
| Silicon-Based Stationary Phases | Primary column chemistry (1D) | Rxi-5Sil MS (30 m × 0.25 mm ID) [17] | Separation by volatility and polarity |
| Polyethylene Glycol Stationary Phases | Secondary column chemistry (2D) | Rxi-17Sil MS (1-2 m × 0.15-0.25 mm ID) [17] | Orthogonal separation mechanism |
| Quality Control Mixtures | System performance verification | Defined compound mixtures for retention time stability [17] | Method validation and quality assurance |
| Internal Standard Solutions | Quantitation and process control | Deuterated analogs of target analytes [16] | Correction for analytical variability |
| Tuning Calibrants | MS performance optimization | Perfluorotributylamine (PFTBA) or similar [18] | Optimal mass accuracy and sensitivity |
The selection of appropriate reagent solutions is particularly critical for maintaining analytical reproducibility across different laboratories—a fundamental requirement for courtroom admissibility [2]. Recent research has emphasized the importance of standardized sample preparation protocols, especially for complex forensic matrices like fingerprint residues, where inconsistent recovery of chemical components can compromise the development of reliable aging models [16]. The trend toward compound ratio-based models that minimize sensitivity to sampling inconsistencies represents an important advancement in addressing this challenge [16].
The driving need for GC×GC-MS in forensic science is unequivocally clear: traditional one-dimensional analysis is increasingly inadequate for addressing the chemical complexity of modern evidence types. From sexual lubricants with intricate natural oil formulations to automotive paints with multilayer chemical systems, conventional GC-MS struggles with coelution and limited peak capacity [15]. GC×GC-MS directly addresses these limitations through its orthogonal separation mechanism, providing unprecedented resolution and sensitivity for forensic chemical profiling [2].
Despite its superior analytical capabilities, GC×GC-MS remains at a lower technology readiness level compared to traditional GC-MS for most forensic applications [2]. The path to courtroom admissibility requires focused research on method validation, error rate determination, and inter-laboratory standardization [2]. The integration of machine learning and chemometric modeling with GC×GC-MS data represents a promising direction for establishing the statistical foundations required for expert testimony [17] [16].
As forensic evidence continues to grow in complexity, the implementation of GC×GC-MS will be essential for maintaining the evidentiary value of chemical trace evidence. The technology's ability to provide comprehensive chemical fingerprints with minimal coelution positions it as the future gold standard for forensic analysis, potentially surpassing the capabilities that made traditional GC-MS indispensable to previous generations of forensic scientists.
Advanced Applications: Where GC×GC-MS Outperforms in Forensic Evidence
In sexual assault cases, the forensic analysis of sexual lubricants can provide crucial evidence, especially as the use of condoms by perpetrators has increased to mitigate DNA deposition. With approximately 30% of sexual assault kits lacking probative DNA profiles, the ability to chemically link a suspect to a victim or crime scene through lubricant analysis becomes paramount [1] [7]. However, this analytical task presents significant challenges due to the complex chemical composition of lubricants, which often contain natural oils, silicones, polyethylene glycols, and various additives that are difficult to differentiate using traditional analytical methods [19]. These formulations share many components with personal hygiene products (PHPs), creating a substantial risk of misinterpretation if analytical techniques cannot achieve sufficient discriminatory power [19].
The core of the challenge lies in coelution, where multiple compounds in a mixture elute simultaneously during chromatographic separation, preventing their individual identification. This limitation is particularly problematic for traditional one-dimensional gas chromatography-mass spectrometry (GC-MS) when analyzing complex mixtures like oil-based lubricants comprising multiple organic butters and oils [1]. This article provides a comprehensive technical comparison between comprehensive two-dimensional gas chromatography-mass spectrometry (GC×GC-MS) and traditional GC-MS, evaluating their capabilities, experimental protocols, and technology readiness levels for forensic lubricant analysis.
Technical Comparison: GC×GC-MS vs. Traditional GC-MS
Fundamental Separation Principles
Traditional GC-MS operates on a one-dimensional separation principle, where complex mixtures are separated based on a single chemical property (typically volatility) as they travel through a column with a specific stationary phase. While this method is versatile and considered the gold standard for many forensic applications, its primary limitation emerges with highly complex samples: coelution of compounds prevents individual identification and quantification [1] [7].
GC×GC-MS represents a significant technological evolution by employing two distinct separation mechanisms in sequence. The technique utilizes two GC columns with different, orthogonal stationary phases—typically a non-polar primary column (e.g., 100% dimethylpolysiloxane) followed by a more polar secondary column (e.g., 50% phenyl-, 50% dimethylpolysiloxane) [20]. This configuration provides enhanced peak capacity through two independent separation dimensions, enabling the deconvolution of coeluted components while providing increased sensitivity for detecting minor components that may be diagnostically significant for lubricant characterization [1].
Table 1: Core Technical Specifications and Capabilities
| Feature | Traditional GC-MS | GC×GC-MS |
|---|---|---|
| Separation Dimensions | One-dimensional | Two-dimensional |
| Peak Capacity | Limited (~10²) | Significantly enhanced (~10³-10⁴) |
| Primary Limitation | Coelution of complex mixture components | Method development complexity |
| Sensitivity for Minor Components | Limited; often obscured by major components | Greatly enhanced; reveals trace additives |
| Data Output | Conventional chromatogram | Topographic contour plot with chemical patterns |
| Chemical Information | Retention time & mass spectrum | Two retention times & mass spectrum |
| Forensic Discrimination Power | Moderate for complex lubricants | Superior chemical fingerprinting |
Performance Data and Comparative Efficacy
Experimental comparisons demonstrate the superior performance of GC×GC-MS for lubricant analysis. In one study analyzing an oil-based personal lubricant with six labeled ingredients, traditional GC-MS showed substantial coelution between retention times of 7-20 minutes, preventing identification of individual components beyond the major constituents [1]. In contrast, GC×GC-MS analysis revealed more than 25 different components in the same sample, with clear separation of previously coeluted compounds between 10-15 minutes first dimension retention times [1].
The enhanced separation power directly impacts forensic utility. GC×GC-MS produces unique chromatographic "fingerprints" similar to topography charts, showing trends of chemically related compounds and revealing both major and minor components that would otherwise remain hidden [1] [7]. This capability is particularly valuable for distinguishing between different lubricant formulations and excluding personal hygiene products, as the minor components often provide the greatest discriminatory power [19].
Table 2: Quantitative Performance Comparison in Lubricant Analysis
| Performance Metric | Traditional GC-MS | GC×GC-MS |
|---|---|---|
| Components Identified | ~6-10 major components | 25+ components (major & minor) |
| Resolution of Coelutions | Limited; significant peak overlap | Comprehensive deconvolution |
| Detection of Trace Additives | Often obscured | Clearly resolved and identifiable |
| Analysis Time | 20-40 minutes (standard) | Similar or slightly longer |
| Data Richness | Moderate; limited pattern information | High; distinct chemical class patterns |
| Statistical Discrimination | Requires multiple techniques | Single-technique classification |
Experimental Protocols and Methodologies
Sample Preparation Workflows
Proper sample preparation is critical for both GC-MS and GC×GC-MS analysis of sexual lubricants. The general workflow involves:
Sample Collection: Evidence is collected from swabs, clothing, or bedding using sterile techniques to prevent contamination.
Solvent Extraction: Samples are prepared using solvent extraction, typically with methanol and hexane in a 1:1 ratio by weight, creating organic and aqueous phases [19]. The organic fraction contains silicone-based components like polydimethylsiloxane (PDMS), while the aqueous fraction contains polyethylene glycol (PEG), glycerin, and water-soluble additives.
Extract Concentration: The solvent extracts are carefully concentrated under gentle nitrogen stream to prevent loss of volatile components.
Instrumental Analysis: Prepared extracts are introduced via autosampler into the GC system. For silicone-rich samples that may damage standard GC columns, pyrolysis (py-GC-MS) can be employed to break down PDMS into smaller cyclic dimethyl siloxanes prior to separation [19].
GC×GC-MS Instrumental Configuration
The experimental setup for GC×GC-MS analysis typically includes:
- GC System: Agilent 7890B gas chromatograph or equivalent with split/splitless injector
- Mass Spectrometer: 5977 quadrupole mass spectrometer or time-of-flight (TOF) mass spectrometer [1]
- Column Configuration: First dimension - non-polar column (e.g., 100% dimethylpolysiloxane, 30m × 0.25mm i.d. × 0.25μm film); Second dimension - polar column (e.g., 50% phenyl-, 50% dimethylpolysiloxane, 1-2m × 0.18mm i.d. × 0.18μm film) [20]
- Modulator: Thermal or differential flow modulator to transfer effluent from first to second dimension
- Oven Program: Typically 40°C (2 min hold) to 320°C at 3-10°C/min
- Carrier Gas: Helium at constant flow (1-2 mL/min)
- Modulator Parameters: 2-4 second modulation period depending on first dimension peak widths
Diagram 1: Analytical Workflow for Sexual Lubricant Analysis
Data Analysis and Chemometrics
Advanced statistical treatments are essential for interpreting complex lubricant data from either technique:
- Hierarchical Cluster Analysis (HCA): Groups samples based on similarity in chemical composition
- Principal Component Analysis (PCA): Reduces data dimensionality and visualizes patterns in sample relationships
- Linear Discriminant Analysis (LDA): Builds classification models to differentiate lubricant types and exclude PHPs [19]
These chemometric approaches are particularly powerful when applied to GC×GC-MS data, as the richer chemical information enables more robust classification models. Research demonstrates that while major components (PEG, PDMS) identify a sample as a lubricant, minor components provide the greatest discriminatory power for distinguishing between specific products and ruling out PHPs [19].
Technology Readiness Level (TRL) Comparison
Traditional GC-MS: Established Gold Standard (TRL 9)
Traditional GC-MS has reached TRL 9 - actual system proven in operational environment. It is extensively validated and accepted in forensic laboratories worldwide for various applications, including drug analysis, fire debris, and trace evidence [21]. The technique benefits from:
- Standardized Protocols: Well-established methods for forensic analysis
- Regulatory Acceptance: Court-admissible results with extensive precedent
- Automated Systems: Streamlined calibration and data processing [22]
- Proven Robustness: Decades of operational experience in casework
Despite its maturity, traditional GC-MS faces limitations with increasingly complex evidence samples, particularly sexual lubricants with extensive formulation similarities and overlapping components with PHPs [19].
GC×GC-MS: Emerging Forensic Technology (TRL 6-7)
GC×GC-MS currently operates at approximately TRL 6-7 - technology demonstrated in relevant and operational environments. While extensively used in petrochemical, environmental, and flavor/fragrance industries, its application in forensic science remains emerging [1] [7]. Key TRL considerations include:
- Limited Forensic Validation: Research studies demonstrate efficacy, but standardized forensic protocols are still developing
- Technical Complexity: Requires specialized expertise in method development and data interpretation
- Growing Evidence Base: Multiple research publications validate its superior resolution for complex forensic samples [1] [20]
- Courtroom Adoption: Limited but growing precedent for admitting GC×GC-MS data in legal proceedings
The technology shows particular promise for sexual lubricant analysis, where its enhanced separation power directly addresses the limitations of traditional GC-MS. Research indicates GC×GC-MS can successfully resolve coeluted components in lubricant formulations that are inseparable by one-dimensional chromatography [1].
Table 3: Technology Readiness Level Assessment
| TRL Aspect | Traditional GC-MS | GC×GC-MS |
|---|---|---|
| Current TRL | 9 (Fully operational) | 6-7 (Demonstration in relevant environment) |
| Forensic Adoption | Widespread; gold standard | Emerging; limited to research & specialized labs |
| Standard Methods | Extensive & validated | In development; research phase |
| Regulatory Acceptance | Fully accepted | Growing body of validation studies |
| Expertise Requirement | Moderate; widely available | High; specialized training needed |
| Case Law Foundation | Extensive precedent | Limited but developing |
| Instrument Cost | Moderate | High (premium technology) |
| Laboratory Infrastructure | Commonly available | Specialized installation required |
Essential Research Reagent Solutions
Successful sexual lubricant analysis requires specific reagents and materials optimized for chromatographic techniques:
Table 4: Essential Research Reagents and Materials
| Reagent/Material | Function | Application Notes |
|---|---|---|
| Hexane (HPLC Grade) | Organic solvent extraction | Extracts silicone-based components (PDMS); forms organic phase [19] |
| Methanol (HPLC Grade) | Aqueous solvent extraction | Extracts PEG, glycerin, water-soluble additives; forms aqueous phase [19] |
| Dichloromethane (DCM) | Alternative extraction solvent | Evaluated for comprehensive extraction; less commonly used than hexane/methanol [19] |
| Internal Standards | Quantification calibration | Isotopically labeled compounds normalize analytical response; essential for QC [22] |
| Certified Reference Materials | Method validation | Validated lubricant samples for quality assurance and control |
| Deactivated Glass Inserts | Sample containment | Prevents adsorption of analytes during analysis |
| Pyrolysis Foils | Sample introduction | For py-GC-MS analysis of silicone-based lubricants [19] |
The comparative analysis demonstrates that while traditional GC-MS remains the established gold standard in forensic laboratories (TRL 9), GC×GC-MS offers superior technical capabilities for the complex challenge of sexual lubricant analysis in sexual assault cases. The enhanced separation power of GC×GC-MS directly addresses the critical limitation of coelution that plagues traditional GC-MS when analyzing complex lubricant formulations and distinguishing them from personal hygiene products [1] [19].
For forensic practitioners, the current technological landscape suggests a complementary approach: traditional GC-MS for routine analysis where its capabilities are sufficient, and GC×GC-MS for complex evidentiary samples where maximum discriminatory power is required. As GC×GC-MS continues to mature toward higher TRL status through method validation and standardization, its adoption in operational forensic laboratories is likely to increase, ultimately enhancing the scientific precision available for sexual assault investigations and contributing to more conclusive analytical outcomes in the justice system.
Automotive paint is a common and critical form of trace evidence encountered in forensic investigations, from hit-and-run accidents to vehicle-related crimes. These paints are chemically complex, multilayer systems, with each layer—electrocoat, primer, basecoat, and clear coat—comprising a sophisticated mixture of binders, pigments, additives, and solvents. The forensic characterization of these materials demands analytical techniques capable of discriminating between chemically similar samples to establish crucial links between crime scene evidence and suspect vehicles.
For decades, pyrolysis-gas chromatography-mass spectrometry (Py-GC-MS) has served as a powerful tool for characterizing the polymer binders in automotive paints, often providing superior discrimination over microscopic and spectroscopic methods. However, the complex chemical composition of paints can lead to co-elution of compounds in traditional one-dimensional GC, potentially obscuring minor but forensically significant components. The emergence of comprehensive two-dimensional gas chromatography (GC×GC) coupled with mass spectrometry and pyrolysis introduces a powerful separation enhancement that addresses these limitations, offering unprecedented resolution for forensic paint analysis.
This guide examines the analytical evolution from established Py-GC-MS to the advanced capabilities of Py-GC×GC-MS, providing a direct performance comparison for researchers and forensic scientists seeking to implement these techniques in automotive paint characterization.
Analytical Techniques: Principles and Workflows
Pyrolysis-GC-MS: The Established Benchmark
Py-GC-MS combines thermal decomposition with chromatographic separation and mass spectral detection. The pyrolysis process heats paint samples to high temperatures (e.g., 750°C) in an inert atmosphere, breaking down non-volatile polymer binders into smaller, volatile fragments. These pyrolysates are then swept into the GC-MS system for separation and identification. The resulting pyrogram serves as a chemical "fingerprint" specific to the paint's polymer composition, often enabling discrimination between samples with similar infrared spectra [23] [24].
Key Experimental Protocol (Based on Established Methodologies):
- Sample Preparation: Paint samples (typically <100 µg) are collected as thin films from a metallic substrate. No chemical pre-treatment is required.
- Pyrolysis: Flash pyrolysis using a pyroprobe with temperature program: start at 50°C for 2 seconds, ramp to 750°C at 50°C/s, hold for 2 seconds [1] [7].
- GC-MS Conditions:
- Column: 30 m × 0.25 mm i.d. × 0.25 µm film thickness 5% diphenyl/95% dimethyl polysiloxane column
- Oven Program: 40°C (hold 2 min) to 300°C at 10°C/min
- Mass Spectrometer: Electron impact (EI+) mode, scanning 35-390 amu [23]
Pyrolysis-GC×GC-MS: The Advanced Separation Platform
Py-GC×GC-MS builds upon this foundation by adding a second dimension of separation. After separation on the first column, chemical compounds are focused and transferred in small pulses (modulation) to a second column with a different stationary phase. This process provides two independent separation mechanisms, dramatically increasing peak capacity and resolution, which is particularly valuable for complex mixtures like automotive paints where co-elution can occur in traditional GC-MS [2] [1].
Figure 1: Py-GC×GC-MS Analytical Workflow. The modulator and second dimension separation represent the key enhancements over traditional Py-GC-MS.
Performance Comparison: Experimental Data and Applications
Separation Capability and Discrimination Power
Multiple studies have demonstrated the superior separation capabilities of Py-GC×GC-MS compared to traditional Py-GC-MS for automotive paint analysis. The following table summarizes key performance differences based on experimental data:
Table 1: Performance Comparison Between Py-GC-MS and Py-GC×GC-MS for Automotive Paint Analysis
| Parameter | Py-GC-MS | Py-GC×GC-MS | Experimental Basis |
|---|---|---|---|
| Peak Capacity | Limited by single dimension | ~2-5x increase due to orthogonal separation | Theoretical and practical enhancement [2] [1] |
| Co-elution Issues | Significant for complex paints | Effectively resolves co-eluting peaks | Separation of α-methylstyrene and n-butyl methacrylate in clear coats [1] [7] |
| Minor Component Detection | Possibly obscured by major components | Enhanced detectability due to peak spreading | Identification of low-intensity peaks from minor paint components [24] |
| Discrimination Power | High for different polymer classes | Superior for samples with similar composition | Differentiation of paints in same FT-IR group [23] |
| Data Visualization | 1D chromatogram (retention time vs. abundance) | 2D contour plot (1D vs. 2D retention times) | Topographic "fingerprint" with chemical class patterns [1] |
The resolving power of Py-GC×GC-MS is particularly evident in the analysis of automotive clear coats. Research has demonstrated that while traditional Py-GC-MS may show co-elution of compounds such as toluene and 1,2-propandial, or α-methylstyrene and n-butyl methacrylate, Py-GC×GC-MS effectively separates these components, revealing previously hidden chemical information that enhances the discrimination of seemingly similar paint samples [1] [7].
Forensic Applications and Casework Significance
In forensic contexts, the ability to distinguish between chemically similar paint samples can be crucial for establishing evidentiary links. Studies involving large sample sets have demonstrated that Py-GC-MS can differentiate automotive paint samples that were previously indistinguishable using Fourier-transform infrared (FT-IR) spectroscopy alone. For instance, one study of 150 automobile clear coat samples found that Py-GC-MS could effectively differentiate binders of identical type and similar infrared spectra in most cases, sometimes based solely on low-intensity peaks from minor components [24].
Another comprehensive comparison demonstrated that Py-GC-MS could distinguish between pairs of samples within the same FT-IR group for solid paints and clear coats, highlighting its superior discrimination power. The technique successfully differentiated between four base coats, twelve solid paints, and four clear coats that FT-IR spectroscopy could not tell apart [23].
The Scientist's Toolkit: Essential Research Reagents and Materials
Table 2: Key Research Reagents and Materials for Py-GC×GC-MS Paint Analysis
| Item | Function/Application | Specific Examples/Properties |
|---|---|---|
| GC×GC-MS System | Instrument platform for separation and detection | Agilent 7890B GC coupled to 5977 MS; differential flow modulation [1] [7] |
| Pyrolysis Unit | Thermal decomposition of paint samples | CDS Analytical Pyroprobe 4000; flash pyrolysis capability to 750°C [1] [7] |
| Chromatographic Columns | Multi-dimensional separation | Primary: 5% diphenyl/95% dimethyl polysiloxane; Secondary: Different selective phase [23] [1] |
| Reference Paint Samples | Method validation and database building | Automotive paint standards with known FT-IR groupings [23] |
| Data Processing Software | Analysis of complex 2D data | Specialized software for GC×GC data handling and visualization [2] |
Technology Readiness and Forensic Admissibility
The implementation of any new analytical technique in forensic science must consider its technology readiness level (TRL) and admissibility under relevant legal standards. The following diagram illustrates the TRL progression for GC×GC-MS in forensic applications:
Figure 2: Technology Readiness Levels for GC×GC in Forensic Applications
Currently, Py-GC×GC-MS for automotive paint analysis resides at approximately TRL 3, representing the proof-of-concept stage where research has demonstrated its capabilities but extensive validation studies are still needed [1]. In contrast, traditional Py-GC-MS has reached TRL 5 or higher, with established protocols and demonstrated admissibility in forensic casework [23] [24].
For forensic techniques to be admissible in court proceedings, they must meet rigorous legal standards including the Daubert Standard (United States) or Mohan Criteria (Canada). These standards require that the technique has been tested, subjected to peer review, has a known error rate, and is generally accepted in the relevant scientific community [2]. While Py-GC-MS meets these criteria for paint analysis, Py-GC×GC-MS requires further development including intra- and inter-laboratory validation, error rate analysis, and standardization before achieving court-ready status.
The characterization of automotive paint through pyrolysis-based techniques represents a critical capability in forensic science. While traditional Py-GC-MS provides robust discrimination power that surpasses spectroscopic methods, Py-GC×GC-MS offers significant advantages in separation capability, particularly for complex paint formulations where co-elution issues limit traditional analysis.
For researchers and forensic professionals, the choice between these techniques involves balancing analytical power with practical considerations. Py-GC-MS remains the established, court-ready technology for routine casework, while Py-GC×GC-MS represents a promising research direction with demonstrated potential for enhanced discrimination of challenging samples. Future directions for Py-GC×GC-MS should focus on method standardization, comprehensive validation studies, and the development of reference databases to advance its technology readiness and facilitate adoption into forensic laboratory workflows.
In hit-and-run investigations, tire rubber evidence recovered from accident scenes provides a critical link to suspect vehicles. The forensic analysis of this trace evidence presents significant analytical challenges due to the extreme chemical complexity of tire rubber, which typically contains over 200 components including natural and synthetic rubber, oils, plasticizers, antioxidants, antiozonants, accelerators, vulcanizing agents, and various curing systems [1] [7]. This chemical complexity often results in coelution of components when using traditional analytical techniques, potentially preventing correct matches and leading to significant interpretive errors [1]. This article examines the technological progression of gas chromatography-mass spectrometry techniques for tire rubber analysis, with particular focus on the comparative advantages of comprehensive two-dimensional gas chromatography-mass spectrometry (GC×GC-MS) versus traditional one-dimensional GC-MS within a technology readiness level (TRL) framework.
Analytical Techniques for Tire Rubber Analysis
Traditional Techniques and Their Limitations
The current standard techniques for forensic tire evidence analysis include physical pattern matching, microscopy, and chemical analysis via pyrolysis gas chromatography-mass spectrometry (py-GC-MS) [1] [7]. Py-GC-MS has demonstrated the most discriminating power among these techniques, enabling differentiation between samples with similar compositions that might not be achievable with other methods [1]. However, a significant limitation persists: pyrograms of tire rubber samples analyzed using py-GC-MS consistently demonstrate coelution of compounds of interest, which restricts the ability to fully differentiate samples and obtain complete chemical profiles [1]. This coelution problem arises because the one-dimensional separation provided by traditional GC-MS is insufficient to resolve the hundreds of chemical components present in tire rubber pyrolysates.
Emerging Techniques: GC×GC-MS and LIBS
To overcome these limitations, two advanced techniques have emerged as promising alternatives: comprehensive two-dimensional gas chromatography-mass spectrometry (GC×GC-MS) and laser-induced breakdown spectroscopy (LIBS). GC×GC-MS addresses the core issue of coelution by implementing a two-dimensional separation system that significantly increases peak capacity and resolution [1] [11]. Meanwhile, LIBS offers a fundamentally different approach by focusing on the elemental profile of tire rubber rather than its organic chemical composition [25].
Table 1: Comparison of Analytical Techniques for Tire Rubber Analysis
| Analytical Technique | Separation Mechanism | Detection Mechanism | Key Advantages | Primary Limitations |
|---|---|---|---|---|
| Py-GC-MS (Traditional) | One-dimensional chromatographic separation | Mass spectrometry | Established protocol; good discrimination power; extensive reference libraries | Severe coelution of complex components; limited peak capacity |
| GC×GC-MS (Advanced) | Two-dimensional chromatographic separation | Mass spectrometry | Superior peak capacity; deconvolution of coeluted peaks; increased sensitivity for minor components | Method development complexity; specialized equipment required; data analysis challenges |
| LIBS (Alternative) | No separation required | Optical emission spectroscopy | Rapid analysis (seconds); minimal sample preparation; portable systems available | Limited to elemental analysis; database development ongoing; less established for tires |
Experimental Comparison: GC×GC-MS vs. Traditional GC-MS
Methodology for Tire Rubber Analysis
The experimental protocol for comparative analysis of tire rubber using GC×GC-MS versus traditional GC-MS follows established pyrolysis techniques described in forensic literature [1] [7]. A flash pyrolysis method is employed to pyrolyze a small portion (~50 µg) of the tire tread sample using a pyroprobe system. The standard pyrolysis profile begins at 50°C for 2 seconds, then ramps to 750°C at 50°C/s and holds for 2 seconds [1] [7]. All samples are analyzed in their natural, unmodified state without derivatization.
For GC×GC-MS analysis, the system configuration typically utilizes a thermal modulator or differential flow modulation between the two chromatographic dimensions. The first dimension generally employs a standard non-polar or mid-polar column (such as a 30-60m DB-5ms), while the second dimension uses a shorter polar column (1-2m DB-17ms) with different stationary phase characteristics [11]. This orthogonal separation mechanism provides the foundation for enhanced chemical resolution of complex tire rubber components.
Performance Metrics and Quantitative Comparison
Experimental data demonstrates significant advantages for GC×GC-MS in tire rubber analysis. In comparative studies of complex samples, GC×GC-MS systems typically detect approximately three times as many peaks as GC-MS platforms at a signal-to-noise ratio ≥ 50 [11]. This increased detection capability directly results from the superior resolution of coeluting compounds that would be reported as a single analyte in traditional GC-MS.
Table 2: Quantitative Performance Comparison Between GC-MS and GC×GC-MS
| Performance Metric | Traditional GC-MS | GC×GC-MS | Improvement Factor |
|---|---|---|---|
| Peak Capacity | ~400-600 | ~1000-2000 | 2-3x increase |
| Number of Detectable Compounds | Limited by coelution (~70-100 in tires) | ~200+ components detectable | ~3x increase |
| Signal-to-Noise Ratio | Baseline for comparison | 3-5x enhancement for minor components | Significant improvement |
| Confidence in Identification | Moderate (coelution affects spectra) | High (pure spectra from resolved peaks) | Substantial improvement |
In practical applications to tire analysis, GC×GC-MS has demonstrated the ability to resolve critical coeluting compounds that traditional GC-MS cannot separate. For example, in analogous automotive material analysis (clear coats), GC×GC-MS successfully separated α-methylstyrene and n-butyl methacrylate, which consistently coelute in traditional GC-MS systems [1]. This enhanced separation power is particularly valuable for tire rubber analysis, where chemical profiles can be used to discriminate between different tire brands, models, and even individual tires based on wear patterns and environmental contamination.
Technology Readiness Level (TRL) Assessment
TRL Comparison Framework
When evaluating analytical techniques for forensic adoption, the Technology Readiness Level framework provides a structured approach to assess maturity and implementation readiness:
Implementation Challenges and Validation Requirements
The adoption of GC×GC-MS in forensic laboratories faces several implementation challenges that impact its TRL assessment. Method validation remains a significant hurdle, as forensic applications require rigorous demonstration of reliability, reproducibility, and error rates [26] [27]. The complexity of GC×GC-MS data analysis presents another barrier, though recent bioinformatics advances have substantially reduced the personnel time and expertise needed for proper data processing [11].
For GC×GC-MS to progress to higher TRL levels (8-9) for tire rubber analysis, comprehensive validation protocols must be established following models recently developed for other forensic techniques. These validation templates typically assess multiple performance components including selectivity, matrix effects, precision, accuracy, range, carryover/contamination, robustness, ruggedness, and stability [26] [27]. Such rigorous validation is crucial for courtroom admissibility and represents the final step in technology maturation for forensic applications.
The Scientist's Toolkit: Essential Research Reagents and Materials
Table 3: Essential Research Reagents and Materials for Tire Rubber Analysis
| Item | Function | Application Notes |
|---|---|---|
| Pyroprobe System | Thermal decomposition of tire samples for analysis | Flash pyrolysis at 750°C replicates manufacturing and degradation processes [1] |
| DB-5ms GC Column | Primary separation dimension for GC×GC-MS | Standard non-polar column (30-60m) provides initial compound separation [11] |
| DB-17ms GC Column | Secondary separation dimension for GC×GC-MS | Shorter polar column (1-2m) provides orthogonal separation mechanism [11] |
| Dental Stone | Casting material for 3D tire impressions | Creates permanent physical molds of tire impressions at crime scenes [28] |
| Electrostatic Dust-Print Lifting Device | Collection of dry or dusty residue impressions | Electrostatic charge transfers trace residue to lifting film for analysis [28] |
| Hexane or Methanol | Solvent extraction of organic components | Extracts oils, plasticizers, and other chemical components from tire rubber [1] [3] |
| Alkane Retention Index Standard | Chromatographic retention time calibration | Enables consistent compound identification across multiple analyses [11] |
| Reference Tire Databases | Chemical profile comparison and sourcing | FBI-maintained and commercial databases assist in brand/model identification [28] |
The forensic analysis of tire rubber in hit-and-run investigations is undergoing a significant technological transformation driven by advances in separation science and analytical instrumentation. Traditional GC-MS methods, while firmly established at TRL 9, face fundamental limitations in resolving power when confronting the extreme chemical complexity of tire rubber formulations. GC×GC-MS emerges as a powerful solution to these limitations, offering substantially enhanced peak capacity and component resolution that enables more confident chemical profiling and comparison of tire rubber evidence.
While GC×GC-MS currently resides at TRL 6-7 for tire rubber applications, its progression toward full forensic implementation appears promising as validation protocols mature and data analysis workflows become more accessible. The ultimate adoption pathway will likely follow trajectories established by other advanced analytical techniques in forensics, requiring demonstrated superiority in casework applications and the development of standardized methods that ensure reliability and reproducibility across laboratory environments. For researchers and forensic practitioners, this technological evolution promises enhanced capability to link vehicles to crime scenes through chemical signatures that were previously inaccessible to forensic analysis.
The relentless emergence of Novel Psychoactive Substances (NPS) represents a significant challenge for forensic laboratories and public health authorities worldwide. These synthetic compounds, designed to mimic the effects of controlled drugs while circumventing legislation, enter the illicit market at a pace of approximately one new substance per week [29]. The dynamic nature of the NPS market, coupled with the structural diversity and often high potency of these compounds, necessitates analytical techniques that move beyond traditional methods. This guide provides a comparative analysis of Gas Chromatography-Mass Spectrometry (GC-MS) and comprehensive two-dimensional Gas Chromatography-Mass Spectrometry (GC×GC-MS) for NPS screening, evaluating their performance, limitations, and technological readiness within a forensic context.
Analytical Techniques for NPS Screening: A Comparative Framework
Traditional GC-MS: The Established Workhorse
Gas Chromatography-Mass Spectrometry (GC-MS) is rightly considered the gold standard in forensic trace evidence analysis due to its versatility in isolating and analyzing unknown mixtures [15]. Its principle is well-understood: a sample is vaporized and carried by a gas through a chromatographic column, where components are separated based on their affinity for the column's stationary phase. These separated compounds are then ionized and identified by a mass spectrometer, which provides a characteristic fragmentation pattern or "fingerprint."
However, the primary limitation of 1D-GC-MS in NPS analysis is coelution, where multiple compounds exit the column simultaneously, preventing their individual identification [15]. This is particularly problematic for complex NPS samples or those containing structurally similar isomers, which may have nearly identical mass spectra and retention times, making definitive identification difficult [30] [31]. Conventional identification relies on library matching, but existing databases are often unable to exhaustively cover the vast and ever-growing spectrum of NPS, leading to potential misidentification or false negatives [31].
GC×GC-MS: Enhanced Separation Power
Comprehensive two-dimensional Gas Chromatography (GC×GC) expands upon traditional GC by adjoining two columns of different stationary phases in series with a device called a modulator [2]. The modulator is the heart of the system; it collects narrow bands of eluent from the end of the first column and injects them as sharp, focused pulses onto the second column. This process provides two independent separation mechanisms, vastly increasing the peak capacity of the analysis [2].
The result is not just better separation, but also an increase in the signal-to-noise ratio, enhancing the detectability of minor or trace components that may be hidden in a 1D-GC-MS analysis [15] [2]. The data is typically visualized as a contour plot, providing a unique chromatographic "fingerprint" that shows trends of chemically related compounds, a feature highly beneficial for characterizing complex mixtures like synthetic cannabinoids or sexual lubricants in forensic casework [15].
Table 1: Core Technical Comparison of GC-MS and GC×GC-MS for NPS Analysis
| Feature | Traditional GC-MS | GC×GC-MS |
|---|---|---|
| Separation Mechanism | Single column separation | Two independent separation mechanisms in series |
| Peak Capacity | Lower; limited by column length and phase | Significantly higher; product of both column capacities |
| Sensitivity | Good for major components | Increased; signal-to-noise ratio is enhanced via modulator [2] |
| Data Output | Retention time & mass spectrum | 2D contour plot ("fingerprint") & mass spectrum |
| Primary Advantage | Rugged, well-established, standardized | Superior separation of complex mixtures |
| Key Limitation for NPS | Coelution of structurally similar compounds | Higher operational complexity and data handling |
Performance Comparison: Experimental Data and Protocols
Evaluating Separation Efficacy and Sensitivity
The superior separation power of GC×GC-MS is not merely theoretical. Research demonstrates its practical application in separating complex forensic samples where traditional GC-MS falls short. For instance, in the analysis of automotive clear coats using pyrolysis, GC×GC-MS successfully distinguished α-methylstyrene and n-butyl methacrylate, two compounds that coelute in the first dimension column and would appear as a single peak in traditional GC-MS [15]. This level of discrimination is critical for NPS analysis, where subtle structural differences define a compound's legal status.
A targeted framework for developing GC-MS methods for synthetic cannabinoids emphasizes maximizing retention time differences (%RTD) to minimize overlapping acceptance windows [30]. While this approach can improve discrimination on 1D systems, it is an optimization workaround for a fundamental limitation. GC×GC-MS inherently provides this separation by spreading components across a two-dimensional plane, resolving compounds that have identical or very similar first-dimension retention times based on their different chemical properties in the second dimension.
Table 2: Performance Benchmarking in Forensic Evidence Analysis
| Analysis Type | GC-MS Performance | GC×GC-MS Performance |
|---|---|---|
| Synthetic Cannabinoids (Targeted Method) | Can differentiate 50 cannabinoids with optimized method; coelution remains a risk for untargeted analysis [30]. | Not specifically tested for NPS in results, but superior separation power suggests high potential for complex mixtures. |
| Automotive Paint (Pyrolysis) | Coelution occurs (e.g., toluene & 1,2-propandial), limiting differentiation [15]. | Clear separation of coeluting peaks (e.g., α-methylstyrene & n-butyl methacrylate) [15]. |
| Oil-Based Lubricant | Showed substantial coelution between 7-20 min [15]. | Resolved >25 different components; deconvoluted coeluted peaks from GC-MS run [15]. |
| Machine Learning for NPS | Models trained on GC-MS data achieved high accuracy but struggle with isomers without low-energy EI [31]. | Potential to provide richer data input (2D retention indices + spectrum) for more robust ML models. |
Detailed Experimental Protocols
Protocol 1: Targeted GC-MS Analysis for Synthetic Cannabinoids [30] This framework involves a six-step, data-driven process for method development:
- Step 1 (Column Selection): A multi-component test solution is analyzed on different column types using identical method parameters to quantify the effect of different stationary phases on retention time differences (%RTD).
- Step 2 (Flow/Temperature Optimization): Gas flow and temperature programs are varied to maximize %RTD while minimizing run time.
- Step 3 (Sensitivity/Reproducibility): A design of experiments (DOE) approach investigates parameters like injection volume, inlet temperature, and split ratio to maximize sensitivity and reproducibility.
- Step 4 (Method Evaluation): A larger panel of available standards is analyzed to establish locked retention times, variability, and identify any pairs that remain indistinguishable by retention time or mass spectral similarity (e.g., using a spectral comparison test).
- Step 5 (Gains Quantification): The performance of the new targeted method is quantitatively compared to the current general method.
- Step 6 (Casework Suitability): Representative case extracts are analyzed to assess performance with real-world samples and matrices.
Protocol 2: GC×GC-MS Analysis of Complex Forensic Evidence [15]
- Instrumentation: A 7890B gas chromatograph coupled to a 5977 quadrupole mass spectrometer (Agilent), though the specific modulator type (thermal or flow) is a key variable.
- Column Configuration: Two columns in series with differing stationary phases (e.g., a non-polar primary column and a more polar secondary column).
- Modulation Period: Set to typically 1-5 seconds, determining the frequency of reinjection from the first to the second column [2].
- Sample Preparation (Lubricants): Samples are prepared by hexane solvent extraction.
- Sample Preparation (Paint/Tires): A flash pyroprobe (e.g., CDS Analytical Pryoprobe 4000) is used. The profile starts at 50 °C for 2 s, ramps to 750 °C at 50 °C/s, and holds for 2 s. Samples are analyzed in their natural, unmodified state.
- Data Analysis: Data is processed to generate 2D contour plots for visual fingerprinting and component identification.
The Data Analysis Frontier: Machine Learning and Statistical Frameworks
The complexity of data generated, especially by GC×GC-MS, is driving the adoption of advanced computational approaches. Machine learning (ML) models are being trained to classify unknown NPS based solely on their GC-MS data, with one study showing that a Balanced Random Forest model outperformed classical library matching [31]. This approach is particularly valuable for NPS not present in existing libraries.
For source attribution, the Likelihood Ratio (LR) framework is widely recommended to quantitatively assess the strength of evidence [17]. Studies are now comparing ML-based LR models with traditional statistical models for interpreting chromatographic data from complex samples like diesel oil. Convolutional Neural Networks (CNNs) applied directly to raw chromatographic signals can derive features automatically, eliminating the need for handcrafted features like peak ratios and potentially offering superior performance for complex pattern recognition tasks [17].
Machine Learning vs. Traditional Library Matching for NPS Identification
Technological and Legal Readiness for Forensic Implementation
The adoption of any new analytical technique in forensic science is not solely an analytical decision; it must also meet rigorous legal standards for the admissibility of evidence in court.
Technology Readiness Level (TRL), on a scale from 1 (basic principles observed) to 4 (technology validated in relevant environment), can be used to categorize forensic applications [2]. Based on current literature, GC×GC-MS for NPS analysis likely resides at a lower TRL compared to traditional GC-MS, which is at the highest level of readiness as the established "gold standard."
Forensic methods must satisfy legal precedents such as the Daubert Standard, which requires that a technique has been tested, peer-reviewed, has a known error rate, and is generally accepted in the relevant scientific community [2]. While GC-MS comfortably meets these criteria, GC×GC-MS would need to undergo extensive intra- and inter-laboratory validation, error rate analysis, and standardization before it could be routinely implemented for casework and accepted as evidence in court [2].
Essential Research Reagent Solutions
Table 3: Key Materials and Reagents for NPS Method Development
| Item | Function/Application | Example/Note |
|---|---|---|
| Synthetic Cannabinoid Standards | Method development, calibration, and reference for identification. | Available from specialty suppliers (e.g., Cayman Chemical) as individual or custom mixtures [30]. |
| DB-200 GC Column | Stationary phase for targeted separation of synthetic cannabinoids. | Used in a developed targeted GC-MS method to maximize retention time differences [30]. |
| Instrument Performance Standards | Testing GC-MS sensitivity, linearity, and repeatability. | Commercially available mixtures (e.g., from Wellington Labs) containing calibrated amounts of analytes like dioxins [32]. |
| Alkane Ladder Standard | Calculation of retention indices (RI) for compound identification. | Allows for standardization of retention times across different instruments and methods [30]. |
| Pyroprobe | Sample introduction for solid, complex matrices (e.g., paint, tires). | Flash pyrolyzer (e.g., CDS Analytical Pryoprobe 4000) thermally decomposes samples for analysis of polymer components [15]. |
Forensic NPS Analysis Workflow from Lab to Courtroom
The analysis of Novel Psychoactive Substances demands analytical techniques that are both powerful and adaptable. While traditional GC-MS remains the validated, court-ready workhorse, particularly when enhanced with targeted methods and machine learning algorithms, its fundamental limitations in peak capacity are clear. GC×GC-MS emerges as a powerful research tool with superior separation capabilities, offering a potential pathway for the future of forensic toxicology and drug chemistry. Its adoption into routine casework, however, is contingent upon extensive further validation to meet the stringent legal standards of the courtroom. The choice between these techniques therefore involves a careful balance between current practical needs, analytical thoroughness, and the ultimate requirement for legally defensible evidence.
Non-targeted screening (NTS) represents a paradigm shift in forensic chemistry, moving beyond the confirmation of known substances to the comprehensive detection and identification of any chemical present in a complex sample. This approach is crucial for investigating emerging threats, such as novel psychoactive substances, complex environmental pollutants, or unknown materials from crime scenes. The core challenge of NTS lies in resolving and identifying a vast number of analytes within samples that have incredibly complex matrices, from drug paraphernalia residues to fire debris and biological specimens [2] [15].
The central analytical techniques in this domain are traditional one-dimensional Gas Chromatography-Mass Spectrometry (GC-MS) and the more advanced Comprehensive Two-Dimensional Gas Chromatography-Mass Spectrometry (GC×GC-MS). While GC-MS has been the undisputed gold standard in forensic laboratories for decades, GC×GC-MS offers a powerful alternative with significantly enhanced separation power [2] [15]. This guide provides an objective comparison of these two techniques, framing their performance, applications, and technological readiness within the context of modern forensic casework.
Analytical Face-Off: GC×GC-MS vs. Traditional GC-MS
The choice between GC×GC-MS and traditional GC-MS involves balancing analytical performance with practical considerations like cost, complexity, and admissibility in court. The following table summarizes their core characteristics.
Table 1: Fundamental Characteristics of GC-MS and GC×GC-MS
| Feature | Traditional GC-MS | GC×GC-MS |
|---|---|---|
| Basic Principle | Single separation on one capillary column [2] | Two sequential, independent separations using two different columns connected via a modulator [2] |
| Peak Capacity | Limited; co-elution is common in complex samples [15] | Significantly higher; reduces co-elution by spreading peaks across a 2D plane [2] [33] |
| Sensitivity | High for major components | Enhanced for minor/trace components; compounds concentrated into narrow bands by modulator [2] [15] |
| Data Output | Chromatogram (Retention Time vs. Intensity) [34] | Structured 2D Chromatrogram (1D Retention Time vs. 2D Retention Time vs. Intensity) [15] |
| Ideal For | Targeted analysis, routine samples, known compounds | Non-targeted screening, extremely complex mixtures, unknown identification [2] [15] |
Quantitative Performance Comparison
The theoretical advantages of GC×GC-MS translate into tangible performance improvements. The table below compares quantitative data from forensic applications, highlighting the operational impact of each technique.
Table 2: Quantitative Performance Comparison in Forensic Applications
| Performance Metric | Traditional GC-MS | GC×GC-MS | Context & Implications |
|---|---|---|---|
| Separation Power | Limited; co-elution of α-methylstyrene and n-butyl methacrylate in paint pyrolysates [15] | Successful separation of co-eluting compounds (e.g., α-methylstyrene and n-butyl methacrylate) [15] | GC×GC-MS provides cleaner mass spectra for reliable library matching and identification in complex evidence. |
| Forensic Application: Sexual Lubricant Analysis | Reveals >6 components with substantial co-elution between 7-20 min [15] | Reveals >25 distinct components within the same timeframe; provides a detailed "fingerprint" [15] | GC×GC-MS's structured chromatograms reveal chemical patterns (e.g., isoparaffins, aldehydes) for better sample differentiation [15]. |
| Technology Readiness Level (TRL) for Forensic Use | TRL 4: Established "gold standard"; universally adopted and legally validated [2] | TRL 3-4: High success in research (e.g., oils, arson, lubricants); requires more validation for routine lab use [2] | GC-MS is court-ready. GC×GC-MS shows high promise but needs intra-/inter-laboratory validation and established error rates for widespread adoption [2]. |
| Method Development & Data Handling | Relatively simple; standardized methods and data processing [3] [34] | Complex; requires optimization of modulation period and column combination. Data is complex and requires specialized processing tools [2] [33] | GC-MS offers a faster, simpler workflow. GC×GC-MS requires significant expertise but provides a deeper level of information. |
Experimental Protocols: From Sample to Result
Protocol for Rapid Seized Drug Screening by GC-MS
The following method, adapted from a 2025 study on seized drug analysis, exemplifies a modern, optimized GC-MS protocol for forensic NTS [3].
- Instrumentation: Agilent 7890B GC system coupled with a 5977A single quadrupole mass spectrometer, equipped with an Agilent J&W DB-5 ms column (30 m × 0.25 mm × 0.25 µm) [3].
- Sample Preparation:
- Solid Samples (e.g., tablets, powders): Approximately 0.1 g is ground into a fine powder. The powder is added to a test tube with 1 mL of methanol, sonicated for 5 minutes, and centrifuged. The supernatant is transferred to a GC-MS vial for analysis [3].
- Trace/Residue Samples: Surfaces are swabbed with a methanol-moistened swab. The swab tip is immersed in 1 mL of methanol and vortexed to extract analytes. The extract is transferred to a GC-MS vial [3].
- GC-MS Parameters:
- Injector: Splitless mode at 250°C.
- Carrier Gas: Helium at a constant flow rate of 2.0 mL/min.
- Oven Program: Initial temperature 80°C, ramped at 40°C/min to 300°C, and held for 3.5 minutes. Total run time: 10 minutes [3].
- Mass Spectrometer: Electron Ionization (EI) source at 70 eV; quadrupole mass analyzer; scan range m/z 40-550 [3].
- Data Analysis: Mass spectra of detected peaks are compared against reference libraries (e.g., Wiley Spectral Library, Cayman Spectral Library) for identification [3].
Protocol for Complex Evidence Analysis by GC×GC-MS
This generalized protocol for analyzing complex forensic evidence like lubricants or pyrolyzed materials is derived from research applications [2] [15].
- Instrumentation: A GC×GC system utilizing a thermal modulator or differential flow modulator, coupled to a mass spectrometer (e.g., quadrupole or time-of-flight). A common column set involves a non-polar primary column (e.g., 30 m × 0.25 mm ID) and a polar secondary column (e.g., 1-2 m × 0.1 mm ID) [15] [33].
- Sample Preparation:
- GC×GC-MS Parameters:
- Injector: Splitless mode at 250-280°C.
- Modulation Period: Typically 2-4 seconds, optimized to capture 3-4 modulations across a first-dimension peak.
- Primary Oven Program: Ramped from a low initial temperature (e.g., 50°C) to a high final temperature (e.g., 280-300°C) at a moderate rate.
- Secondary Oven Offset: Usually maintained 5-10°C above the primary oven temperature.
- Mass Spectrometer: EI source; TOFMS is preferred for its fast acquisition rate, which is necessary to capture the very narrow peaks produced by the modulator [2].
- Data Analysis: Specialized software is used to visualize the two-dimensional contour plot and process the data. The structured patterns of chemically related compounds on the 2D plane aid in the identification of unknowns and matrix components [15] [33].
Diagram 1: GC×GC-MS Analytical Workflow. The process involves sequential separations, with the modulator being the critical component that transfers and focuses effluent from the first column to the second.
The Scientist's Toolkit: Essential Research Reagents and Materials
Successful non-targeted screening relies on a suite of reliable reagents and materials. The following table details key components used in the featured experiments.
Table 3: Essential Reagents and Materials for Forensic NTS
| Item | Function / Description | Example in Use |
|---|---|---|
| DB-5 ms GC Column | A (5%-phenyl)-methylpolysiloxane column; a versatile, non-polar phase used as the primary column in both GC-MS and GC×GC-MS [3] [15]. | Standard column for separating a wide range of semi-volatile organic compounds in seized drugs and ignitable liquids [3]. |
| Methanol (HPLC/MS Grade) | A high-purity solvent for preparing standard solutions and extracting analytes from solid and trace evidence samples [3]. | Used in liquid-liquid extraction to dissolve and prepare seized drug samples for injection into the GC system [3]. |
| Helium Carrier Gas | An inert gas that transports the vaporized sample through the chromatographic column. It is the traditional preferred carrier gas for GC [3] [33]. | Used to maintain a fixed flow rate (e.g., 2.0 mL/min) to ensure consistent analyte separation and retention times [3]. |
| Alkane Standard Solution | A mixture of straight-chain hydrocarbons with known retention indices. It is crucial for calibrating retention times in the first dimension in GC×GC [33]. | Used to create a retention index ladder for aligning chromatograms and improving compound identification confidence in non-targeted studies. |
| Reference Spectral Libraries | Digital databases of mass spectra for known compounds, which are essential for identifying unknowns by spectral matching [3]. | The Wiley and Cayman Spectral Libraries are used to identify controlled substances and novel compounds in seized materials [3]. |
The comparative analysis demonstrates that GC×GC-MS holds a definitive analytical advantage over traditional GC-MS for non-targeted screening of highly complex forensic samples. Its superior peak capacity and sensitivity unlock information that would otherwise remain obscured. However, this power comes with a cost of greater complexity and a currently lower Technology Readiness Level for routine forensic casework compared to the court-validated, user-friendly GC-MS [2].
The future of non-targeted screening will likely be shaped by the integration of advanced data analytics, particularly machine learning (ML), to manage the complexity of the data generated. As seen in other forensic domains, ML algorithms can classify complex patterns and predict sample properties, moving beyond simple identification to intelligent evidence interpretation [17] [35]. Furthermore, as GC×GC-MS methods undergo rigorous intra- and inter-laboratory validation—establishing known error rates and standardized protocols—this powerful technique will overcome the final barriers to becoming an indispensable tool for uncovering the unknowns in forensic casework [2].
Diagram 2: Pathway to Forensic Adoption. For a new technique like GC×GC-MS to be widely adopted in forensics, it must progress from successful research through rigorous validation and legal scrutiny.
Navigating Challenges: Limitations and Optimization of GC×GC-MS
Addressing the High Cost and Operational Complexity of GC×GC-MS
Comprehensive two-dimensional gas chromatography-mass spectrometry (GC×GC-MS) represents a significant advancement over traditional GC-MS, offering superior separation power for complex forensic samples. By connecting two columns of different stationary phases in series with a modulator, GC×GC-MS increases peak capacity and the signal-to-noise ratio, enabling the resolution of analytes that co-elute in one-dimensional systems [2]. This capability is particularly valuable in non-targeted forensic applications, where a wide range of analytes must be analyzed simultaneously [2].
Despite its analytical advantages, the adoption of GC×GC-MS in operational forensic laboratories has been slow, primarily due to high capital and operational costs and significant technical complexity requiring a highly skilled workforce [36] [2]. This guide provides an objective comparison of GC×GC-MS and alternative techniques, delivering supporting experimental data and methodologies to help researchers and laboratory managers make informed decisions.
Technology Comparison: GC×GC-MS vs. Traditional GC-MS and Other Alternatives
Performance and Capability Assessment
Table 1: Technical Performance Comparison of GC-Based Analytical Techniques
| Performance Characteristic | Traditional GC-MS | GC×GC-MS | GC-Ion Mobility Spectrometry (GC-IMS) |
|---|---|---|---|
| Peak Capacity | Limited | High (Significantly increased) [2] | Moderate (Efficient separation) [35] |
| Separation Power | Moderate | Superior resolution of co-eluting compounds [2] | Good for volatile organic compounds [35] |
| Detection Limits | Good | Improved signal-to-noise ratio [2] | Rapid trace-amount detection [35] |
| Analysis Time | Varies (Minutes to hours) | Similar to or longer than GC-MS | Significantly reduced (vs. GC) [35] |
| Sample Preparation | Often required | Often required | Can be minimal to non-destructive [35] |
| Ideal Forensic Application | Targeted compound analysis | Non-targeted analysis of complex mixtures [2] | Rapid volatile organic compound fingerprinting [35] |
Cost and Operational Considerations
Table 2: Cost and Operational Factor Comparison
| Factor | Traditional GC-MS | GC×GC-MS | Portable GC-MS |
|---|---|---|---|
| Estimated Initial Instrument Cost | Moderate to High | High (Premium over GC-MS) | Varies (May be lower for field systems) |
| Operational Complexity | Moderate | High (Specialized operation required) [2] | Lower (Designed for field use) |
| Maintenance Requirements | Regular, skilled maintenance | Complex system, potential for more downtime | Varies by system |
| Operator Skill Requirements | Trained personnel | Highly trained, specialized expertise [36] [2] | Less training may be needed |
| Throughput | Good | Can be lower due to complex analysis | Rapid results in field settings |
| Method Development & Validation | Established practices | Complex, requires extensive validation [2] | Can be simplified |
Technology Readiness Level (TRL) in Forensic Analysis
The legal standards for admissibility of scientific evidence in court—including the Frye Standard, Daubert Standard, and Federal Rule of Evidence 702 in the United States, and the Mohan Criteria in Canada—require rigorous validation of analytical methods [2]. These standards directly impact the Technology Readiness Level (TRL) of chromatographic techniques in forensic science.
Traditional GC-MS: TRL 4 (Operational Readiness) - Considered the "gold standard" in forensic laboratories and routinely admitted as evidence in courtrooms. It meets the "general acceptance" requirement and has known error rates established through decades of use [2].
GC×GC-MS: TRL 3 (Applied Research) - Currently used in forensic research applications but not yet implemented in routine casework. Research has demonstrated its superior capabilities for analyzing complex mixtures including illicit drugs, toxicological evidence, fingerprint residue, and ignitable liquid residues [2]. However, it lacks the extensive intra- and inter-laboratory validation, standardized protocols, and established error rates required for courtroom admissibility [2].
Experimental Protocols and Methodologies
GC×GC-MS Method for Complex Forensic Mixtures
Objective: To separate and identify complex mixtures of volatile and semi-volatile compounds in forensic samples such as ignitable liquid residues or illicit drugs.
Materials and Reagents:
- GC×GC system equipped with a modulator
- Two-dimensional GC columns (typically different stationary phases)
- Mass spectrometer detector (TOF-MS recommended for fast acquisition)
- Certified calibration standards relevant to analytes of interest
- Internal standards (deuterated or carbon-13 labeled compounds)
- High-purity helium carrier gas (or hydrogen as alternative)
Procedure:
- Sample Preparation: Extract analytes using appropriate technique (headspace, SPME, or solvent extraction).
- Primary Separation: Inject sample onto first dimension column (1D) for initial separation based on volatility.
- Modulation: Use thermal or flow modulator to collect effluent from 1D column and transfer as discrete pulses to second dimension column (2D).
- Secondary Separation: Perform rapid separation on 2D column based on different chemical interactions (typically polarity).
- Detection: Analyze eluting compounds using MS detector with acquisition rate ≥ 100 Hz to properly capture 2D peaks.
- Data Analysis: Use specialized software for peak deconvolution and compound identification.
Validation Parameters:
- Establish modulation period optimization for peak capacity
- Determine linear dynamic range for quantitative applications
- Perform repeatability studies for retention time stability in both dimensions
- Conduct comparative studies with 1D-GC-MS for co-eluting compounds
Advanced Calibration Methodology for Improved Quantitation
Objective: To overcome limitations of standard linear calibration models that struggle with non-linear detector responses, matrix effects, and instrument drift.
Materials and Reagents:
- Certified reference materials at multiple concentration levels
- Isotopically labeled internal standards
- Matrix-matched calibration standards
- Quality control samples
Procedure:
- Standard Preparation: Prepare calibration standards spanning expected concentration range using appropriate serial dilution.
- Internal Standard Addition: Add isotopically labeled internal standards to all samples and standards to correct for matrix effects and instrument variation.
- Analysis: Analyze calibration standards in randomized order to account for instrument drift.
- Curve Fitting: Apply weighted regression models (e.g., 1/x or 1/x²) to address heteroscedasticity.
- Model Validation: Use quality control samples to validate calibration model performance.
- Advanced Modeling: Implement machine learning algorithms for predictive drift correction and automated optimization [22].
Validation Metrics:
- Calculate mass accuracy (< 5 ppm error)
- Determine resolving power (> 10,000 FWHM for HRMS)
- Establish detection and quantification limits
- Evaluate precision and accuracy across concentration range
GC×GC-MS Analytical Workflow
Strategic Implementation Framework
Cost-Benefit Analysis and Justification
While GC×GC-MS systems require substantial investment (high-end systems can exceed $100,000), their value proposition becomes clear when examining long-term benefits and application-specific advantages [36]. Organizations should consider:
Throughput Efficiency: Despite potentially longer individual analysis times, GC×GC-MS can reduce overall laboratory workflow time by eliminating the need for multiple analyses or extensive sample preparation.
Labor Cost Distribution: The requirement for highly trained personnel is balanced by the ability to perform more comprehensive analyses with fewer repeat analyses [36].
Alternative Carrier Gases: Implementing hydrogen as a carrier gas alternative to helium can reduce operational costs and mitigate supply chain concerns [37].
Roadmap for Forensic Laboratory Implementation
GC×GC-MS Forensic Implementation Roadmap
The Scientist's Toolkit: Essential Research Reagent Solutions
Table 3: Essential Reagents and Materials for GC×GC-MS Analysis
| Item | Function | Application Notes |
|---|---|---|
| Deuterated Internal Standards | Correct for matrix effects and instrument variation; improve quantification accuracy | Particularly important for complex forensic matrices (blood, tissue, soil) |
| Certified Reference Materials | Method validation and calibration; ensure analytical accuracy and traceability | Required for meeting Daubert Standard requirements for known error rates [2] |
| Isotopically Labeled Compounds | Act as internal standards for challenging analytes; improve quantification in complex samples | Essential for method development and validation [22] |
| Matrix-Matched Calibration Standards | Account for matrix effects in quantitative analysis; improve accuracy | Critical for complex sample types (biological, environmental) |
| High-Purity Carrier Gases | Mobile phase for chromatographic separation; impact sensitivity and resolution | Hydrogen as alternative to helium can reduce costs and supply issues [37] |
| Specialized GC Columns | Provide orthogonal separation mechanisms in two dimensions | Different stationary phases (non-polar/polar combination) for 1D and 2D separation |
| Quality Control Materials | Monitor method performance and instrument stability; ensure data reliability | Required for continuous method validation in operational laboratories |
GC×GC-MS represents a powerful analytical tool with demonstrated advantages for complex forensic samples, though it currently remains at the applied research stage (TRL 3) for most forensic applications. The technology faces significant adoption barriers including high costs, operational complexity, and the extensive validation required for courtroom admissibility [2].
Future developments likely to impact this field include the continued integration of artificial intelligence for data processing and method optimization, further automation to reduce operational complexity, and the development of more standardized protocols specifically designed to meet legal admissibility standards. For laboratories considering implementation, a phased approach beginning with research applications and progressing toward full validation is recommended to systematically address both the technical and legal readiness requirements.
In the realm of analytical chemistry, particularly in forensic analysis, the separation power of gas chromatography (GC) is a critical determinant of success. Traditional one-dimensional gas chromatography (1D GC) has long been the workhorse technique, but faces inherent limitations in peak capacity and resolution when analyzing complex samples containing hundreds or thousands of components [11]. Comprehensive two-dimensional gas chromatography (GC×GC) overcomes these limitations by implementing two independent separation mechanisms, dramatically increasing peak capacity and providing a powerful tool for complex mixture analysis [2]. The heart of this advanced system lies in the careful selection of modulators and column combinations, which together determine the effectiveness of the separation. This guide objectively compares the performance of GC×GC-MS against traditional GC-MS within forensic contexts, examining their respective Technology Readiness Levels (TRL) and providing experimental data to support method development decisions.
GC×GC-MS vs. GC-MS: Core Technical Comparison
Fundamental Principles and System Architecture
Traditional GC-MS couples a gas chromatograph with a mass spectrometer. The GC separates compounds based on their differential partitioning between a mobile gas phase and a stationary phase within a single column, while the MS detects and identifies compounds based on their mass-to-charge ratios [38] [39]. This configuration produces a two-dimensional data output (retention time vs. intensity) with mass spectral identification.
GC×GC-MS represents a significant architectural evolution. It connects two GC columns of different stationary phases in series via a specialized component called a modulator [2]. The modulator, often described as the "heart" of the GC×GC system, captures effluent from the first dimension (1D) column in brief, discrete pulses and injects them into the second dimension (2D) column [2]. This process creates a comprehensive two-dimensional separation where each compound is characterized by two independent retention times, generating three-dimensional data (1D retention time, 2D retention time, intensity) with mass spectral detection [40].
Table 1: Fundamental Differences Between GC-MS and GC×GC-MS
| Feature | GC-MS | GC×GC-MS |
|---|---|---|
| Chromatographic Dimensions | One-dimensional | Two-dimensional |
| Separation Mechanism | Single separation mechanism | Two independent separation mechanisms |
| Key Components | Single column, mass spectrometer | Two columns, modulator, mass spectrometer |
| Data Output | Retention time vs. intensity | 1D retention time, 2D retention time vs. intensity |
| Peak Capacity | Limited | Significantly enhanced (product of 1D and 2D capacities) |
Performance Comparison: Experimental Data
A direct comparison of the techniques in metabolite biomarker discovery highlights their performance differences. When analyzing 109 human serum samples, experimental data derived from pooled quality control samples revealed striking disparities [11]:
- Detection Capability: The GC×GC-MS platform detected approximately three times as many peaks as the GC-MS platform at a signal-to-noise ratio (SNR) ≥ 50 [11].
- Metabolite Identification: Three times the number of metabolites were identified by mass spectrum matching with a spectral similarity score Rsim ≥ 600 using GC×GC-MS [11].
- Biomarker Discovery: In the same study, 23 metabolites showed statistically significant abundance changes between patient and control samples in the GC-MS dataset, while 34 metabolites showed significant differences in the GC×GC-MS dataset [11]. Manual verification indicated that the difference was mainly due to limited chromatographic peak resolution in GC-MS, resulting in severe peak overlap that complicated spectrum deconvolution for identification and quantification [11].
Table 2: Quantitative Performance Comparison from Experimental Data [11]
| Performance Metric | GC-MS | GC×GC-MS | Advantage Factor |
|---|---|---|---|
| Peaks Detected (SNR ≥ 50) | Baseline | ~3x more peaks | 3x |
| Metabolites Identified (Rsim ≥ 600) | Baseline | ~3x more metabolites | 3x |
| Statistically Significant Biomarkers | 23 metabolites | 34 metabolites | ~1.5x |
Critical Hardware Selection: Modulators and Columns
Modulator Technology: The Heart of GC×GC
The modulator is a defining component of GC×GC systems, with its technology directly impacting system performance and practicality. Two primary modulator types exist:
Thermal Modulators use cryogenic cooling (typically liquid nitrogen) to focus analytes exiting the first dimension before rapidly heating and injecting them into the second dimension [11]. These provide excellent focusing but increase operational complexity and cost due to cryogen consumption.
Flow Modulators use valve-based systems to manage fluid flow, trapping and releasing analyte pulses. Recent advances have made these modulators increasingly popular as they eliminate cryogenic requirements, simplify automation, and reduce operational costs [40]. Reverse flow fill/flush (RFF) modulators, which elute the 1D effluent in the opposite direction of the loading step, are particularly effective for samples with a wide dynamic concentration range as they enhance analyte focusing in the 2D column [40].
Column Selection and Combination Strategies
Column selection is arguably the most critical aspect of GC×GC method development, as the combination determines the orthogonality—the degree to which the two separation mechanisms are independent.
The Foundation of Orthogonality: Effective GC×GC requires combining columns with different stationary phase selectivities. A common and highly effective strategy pairs a non-polar primary column with a more polar secondary column [11] [41].
Primary (1D) Column Considerations:
- Typical Dimensions: 15-30 m × 0.25 mm ID × 0.25 µm film thickness [11]
- Common Stationary Phases: 100% dimethyl polysiloxane (e.g., DB-1, Rtx-1) or 5% diphenyl/95% dimethyl polysiloxane (e.g., DB-5, Rtx-5) [41]
- Function: Provides the primary separation based predominantly on analyte volatility
Secondary (2D) Column Considerations:
- Typical Dimensions: Shorter columns, 1-5 m × 0.25 mm ID × 0.25 µm film thickness [11] [40]
- Common Stationary Phases: Mid-polarity phases such as (50%-phenyl)-methylpolysiloxane (e.g., DB-17) [11] or ionic liquid phases (e.g., SLB-IL60) [40]
- Function: Provides rapid secondary separation based on polarity or other molecular interactions
Table 3: Common GC×GC Column Combinations from Experimental Protocols
| Application | 1D Column | 2D Column | Separation Mechanism |
|---|---|---|---|
| Metabolite Biomarker Discovery [11] | DB-5ms UI (30m) | DB-17ms (1m) | Non-polar × Mid-polar |
| Vermouth Aroma Profile [40] | DB-5MS (30m) | SLB-IL60 (5m) | Non-polar × Ionic Liquid |
| Forensic Applications [2] | Various non-polar | Various polar | Non-polar × Polar |
Figure 1: Comparative Workflows of GC-MS and GC×GC-MS
Method Development and Optimization Approaches
Experimental Design and Optimization Strategies
Method development for GC×GC systems involves optimizing multiple interdependent parameters. Multivariate Design of Experiments (DOE) has emerged as a powerful strategy to efficiently navigate this complex parameter space [42].
Screening Stage: Initial screening using two-level designs (e.g., 2k factorial or Plackett-Burman) identifies factors with statistically significant effects on responses like resolution, peak symmetry, and detection limits [42].
Optimization Stage: Subsequent optimization employs more complex designs (e.g., Central Composite, Box-Behnken, or Doehlert designs) with three or more factor levels to model response surfaces and identify optimal conditions [42].
Advanced Modeling: For highly nonlinear systems, Artificial Neural Networks (ANN) may outperform traditional polynomial response surface methodology, as demonstrated in GC×GC optimization for enantiomer separation in wine volatiles [42].
Key Parameter Optimization
Critical parameters requiring optimization in GC×GC method development include:
- Modulation Period: Typically 1-5 seconds, must be synchronized with 1D peak widths [2]
- Temperature Programming: Must balance analysis time with resolution requirements
- Carrier Gas Flows: Optimized for both dimensions, with 2D flows significantly higher (e.g., 20 mL/min) [40]
- MS Acquisition Rates: Must be fast enough to capture multiple data points across narrow 2D peaks (e.g., 200 spectra/s) [11]
Forensic Applications and Technology Readiness
Forensic Application Landscape
GC×GC-MS has been explored across numerous forensic applications, demonstrating its capability to address complex analytical challenges:
- Illicit Drug Analysis: Enhanced separation of complex drug mixtures and precursors [2]
- Ignitable Liquid Residues (ILR): Improved characterization in arson investigations [2]
- Toxicology: Comprehensive screening for drugs and metabolites in biological samples [2]
- Fingermark Chemistry: Analysis of chemical residues in fingerprints for investigative leads [2]
- Decomposition Odor: Characterization of volatile organic compounds for cadaver detection [2]
- Oil Spill Tracing: Chemical fingerprinting for source identification [2]
Technology Readiness Level (TRL) Assessment
The adoption of GC×GC-MS in forensic laboratories must consider both analytical and legal readiness. Courtroom admissibility requires meeting rigorous standards including the Frye Standard ("general acceptance"), Daubert Standard ("appropriate validation"), Federal Rule of Evidence 702 in the United States, and the Mohan Criteria in Canada [2]. These standards emphasize testing, peer review, known error rates, and general acceptance in the scientific community [2].
While GC×GC-MS has demonstrated superior analytical performance in research settings, its routine implementation in forensic casework remains limited due to these legal standards. Current research applications show varying levels of maturity, with areas like oil spill forensics and decomposition odor analysis having reached more than 30 published works each, indicating growing acceptance [2].
The Scientist's Toolkit: Essential Research Reagents and Materials
Table 4: Essential Research Reagents and Materials for GC×GC-MS Method Development
| Item | Function/Purpose | Example Specifications |
|---|---|---|
| Derivatization Reagents | Render polar metabolites volatile for GC analysis | MSTFA with 1% TMCS; Methoxyamine in pyridine [11] [43] |
| Internal Standards | Correct for analytical variation and quantify analytes | Heptadecanoic acid, Norleucine [11] |
| Retention Index Standards | Standardize retention times across runs | Alkane series (C10-C40) [11] |
| SPME Fibers | Extract and concentrate volatile compounds | DVB/CAR/PDMS (50/30 μm) [40] |
| GC Inlet Liners | Provide vaporization chamber for samples | Deactivated, single taper design |
| High-Purity Gases | Carrier and discharge gases for GC and MS | Helium Alphagaz 1 (≥99.999%); Argon Arcal Prime (≥99.999%) [40] |
| Mass Spectral Libraries | Compound identification by spectral matching | NIST/EPA/NIH Library; Fiehn Metabolomics Library [11] [43] |
Figure 2: GC×GC-MS Method Development Strategy
The selection of modulators and column combinations represents a fundamental aspect of GC×GC-MS method development that directly determines analytical success. GC×GC-MS provides demonstrable advantages over traditional GC-MS in peak capacity, sensitivity, and compound identification for complex samples, as evidenced by experimental data showing 3x improvements in metabolite detection and identification [11]. While GC×GC-MS technology shows tremendous promise across diverse forensic applications, its adoption into routine casework must be guided by both analytical performance and legal admissibility standards. Future directions should focus on standardized method validation, error rate determination, and inter-laboratory studies to advance the Technology Readiness Levels of GC×GC-MS applications in forensic science [2].
Forensic science increasingly relies on advanced analytical techniques to decipher complex evidence, a domain where traditional Gas Chromatography-Mass Spectrometry (GC-MS) has long been the gold standard. However, the analysis of intricate mixtures—from sexual lubricants to explosive residues—often pushes conventional one-dimensional separation to its limits, resulting in significant coelution of compounds that masks critical compositional details [1] [7]. This challenge of data overload and insufficient separation is now being addressed by Comprehensive Two-Dimensional Gas Chromatography-Mass Spectrometry (GC×GC-MS), a technique that provides an order-of-magnitude increase in separation power and data complexity [44].
This guide objectively compares the performance and Technological Readiness Level (TRL) of GC×GC-MS against traditional GC-MS within forensic analysis. TRL is a systematic metric used to assess the maturity of a particular technology, ranging from 1 (basic principles observed) to 9 (system proven in operational environment). We provide supporting experimental data, detailed methodologies, and visualization tools to help researchers navigate the transition from one-dimensional to multidimensional data interpretation, thereby transforming analytical challenges into forensic opportunities.
Technology Performance Comparison: GC×GC-MS vs. Traditional GC-MS
Qualitative and Quantitative Performance Metrics
Direct comparative studies demonstrate that GC×GC-MS provides substantial advantages in peak capacity, sensitivity, and metabolite identification for non-targeted analysis. In a 2024 study focusing on non-targeted metabolomics in beagle plasma, researchers established a GC×GC-qMS method with a solid-state modulator (SSM) and systematically compared its performance to a traditional GC-MS platform [44].
Table 1: Quantitative Performance Comparison of GC×GC-MS vs. GC-MS (Metabolomics Study)
| Performance Metric | GC×GC-qMS | Traditional GC-MS | Improvement Factor |
|---|---|---|---|
| Number of Identifiable Metabolites | 3x Increase | Baseline | 3x |
| Lower Limits of Quantitation (LLOQs) | 0.5 - 0.05x | Baseline | 10-20x more sensitive |
| Quantification Accuracy | 85-115% | 85-115% | Comparable |
| Intra- and Inter-day Precision | Majority within 20% | Majority within 20% | Comparable |
The study concluded that the GC×GC-MS platform offered enhanced qualitative capabilities and heightened sensitivity while maintaining accuracy and precision comparable to the traditional method, making it more suitable for complex non-targeted analyses [44].
Forensic Application and Technological Readiness Level (TRL)
While GC×GC-MS exhibits superior technical performance, its adoption in forensic science is still advancing, indicating a different TRL compared to the established GC-MS.
Table 2: Technology Readiness Level (TRL) and Application Comparison
| Aspect | GC×GC-MS | Traditional GC-MS |
|---|---|---|
| Overall Forensic TRL | 6-7 (Technology demonstrated in relevant environment) [1] [7] | 9 (System proven in operational environment) [1] [45] |
| Separation Power | High; Manages complex mixtures, deconvolutes coelutions [1] [7] | Moderate; Coelution is a primary limitation [1] |
| Key Demonstrated Applications | Sexual lubricant analysis, Pyrolysis of automotive paints & tires [1] [7], Non-targeted metabolomics [44] | Drug detection, toxicology, fire debris analysis, trace evidence [45], Organic Gunshot Residue (OGSR) analysis [9] |
| Data Complexity | High; Generates complex 2D "fingerprints" requiring specialized data handling [1] | Moderate; 1D chromatograms are standard and widely interpretable [46] [47] |
Experimental Protocols for Forensic Sample Analysis
Protocol 1: Analysis of Sexual Lubricants
Objective: To differentiate complex, natural oil-based lubricants by resolving coeluted components missed by traditional GC-MS [1] [7].
- Sample Preparation: Lubricant samples are prepared by hexane solvent extraction to isolate organic components. The extract is then concentrated, if necessary, and a suitable aliquot is injected into the GC system [1] [7].
- GC×GC-MS Configuration:
- GC System: 7890B Gas Chromatograph (Agilent) with a split/splitless injector.
- MS Detector: 5977 Quadrupole Mass Spectrometer (Agilent).
- Modulator: Solid-state modulator (SSM) or differential flow modulator (DFM).
- Column Configuration: A non-polar primary column (e.g., HP-5MS) coupled to a polar secondary column (e.g., DB-17HT) via the modulator [1] [7].
- Data Interpretation: Components are identified not just by first-dimension retention time (¹tʀ) and mass spectrum, but also by their second-dimension retention time (²tʀ). Chemically related compounds (e.g., isoparaffins, aldehydes) form structured patterns in the 2D chromatographic plane, creating a diagnostic "fingerprint" for the lubricant [1] [7].
Protocol 2: Pyrolysis-GC×GC-MS of Automotive Paint Clear Coats
Objective: To achieve superior separation of pyrolysates from automotive clear coats, resolving coelutions that limit the discriminating power of py-GC-MS [1] [7].
- Sample Introduction: A microgram-scale paint sample is placed in a pyrolysis probe (e.g., CDS Analytical Pyroprobe 4000). The probe is introduced into the GC injector.
- Pyrolysis Conditions: The pyroprobe executes a flash pyrolysis profile: start at 50 °C for 2 s, ramp to 750 °C at 50 °C/s, and hold for 2 s. This thermally decomposes the non-volatile polymer into volatile fragments [1] [7].
- GC×GC-MS Analysis: The resulting pyrolysates are transferred to the GC×GC-MS system. The method uses the same instrumental configuration as Protocol 1.
- Key Data Outcome: This method successfully separates compounds like α-methylstyrene and n-butyl methacrylate, which coelute in traditional py-GC-MS, providing a more detailed chemical profile for paint comparison [1] [7].
Visualizing Workflows and Data Interpretation Strategies
GC×GC-MS Forensic Analysis Workflow
The following diagram illustrates the end-to-end process, from sample preparation to final reporting, highlighting steps unique to managing 2D data.
Navigating the Data Cube: From Raw Data to Forensic Intelligence
A core challenge of GC×GC-MS is interpreting its complex data output. The instrument generates a three-dimensional data cube defined by first-dimension retention time (¹tʀ), second-dimension retention time (²tʀ), and signal intensity [1]. The following diagram outlines the strategic interpretation process for transforming this raw data into actionable forensic intelligence.
The process involves identifying structural patterns in the 2D contour plot, where chemically related compounds (e.g., alkanes, aldehydes) form ordered clusters [1]. A key advantage is the ability to interrogate previously hidden minor features, as the enhanced separation power unmasks trace components that coeluted in 1D-GC [1] [7]. Analysts then use techniques like Extracted Ion Chromatograms (EICs) to confirm the presence of target compounds and perform library searches against mass spectral databases to identify unknowns [48]. The final output is a detailed chemical fingerprint used for comparative analysis, providing high evidentiary value.
The Scientist's Toolkit: Essential Research Reagents and Materials
Successful implementation of GC×GC-MS in forensic analysis requires specific materials and reagents. The following table details key items and their functions.
Table 3: Essential Reagents and Materials for Forensic GC×GC-MS Analysis
| Item | Function & Application |
|---|---|
| Standard Solvents (e.g., Hexane, Dichloromethane) | For solvent extraction of organic compounds from complex forensic matrices like lubricants, smokeless powders, or fire debris [1] [9]. |
| Deuterated Internal Standards | Added to samples for quantitative analysis using the internal standard method; corrects for injection volume errors and matrix effects, improving data accuracy [47]. |
| NIST Mass Spectral Library & Retention Index Databases | Primary resource for automated identification of unknown compounds by matching acquired mass spectra against a vast database of reference spectra [44] [48]. |
| Certified Reference Materials (CRMs) | Pure analytical standards for target analytes (e.g., specific lubricant components, explosive residues); essential for qualitative confirmation via retention time/mass spectrum matching and for constructing calibration curves [47] [9]. |
| Solid-State or Thermal Modulator | The core hardware component that traps, focuses, and reinjects effluent from the first dimension column onto the second dimension column, enabling the comprehensive 2D separation [44]. |
| Capillary GC Columns (Two with Different Phases) | The set of separation columns; typically a non-polar (e.g., 100% dimethylpolysiloxane) primary column and a mid-to-high polarity (e.g., 50% phenyl polysilphenylene-siloxane) secondary column [1] [7]. |
| Pyroprobe Filaments/Cups | Sample holders for solid samples (e.g., paint, tire rubber) used in flash pyrolysis to thermally decompose the material into analyzable volatile fragments [1] [7]. |
The transition from traditional GC-MS to GC×GC-MS represents a paradigm shift in forensic chemical analysis. While GC-MS remains a mature, court-proven technology (TRL 9), GC×GC-MS (TRL 6-7) offers a demonstrably powerful solution to the problem of data overload from complex mixtures. Its superior separation power, increased sensitivity, and ability to generate structured, information-rich chemical fingerprints provide forensic scientists with unparalleled analytical insight. The primary challenge is no longer whether components can be separated, but how best to manage, process, and interpret the complex two-dimensional data generated. As the strategies and tools outlined in this guide become more integrated into forensic workflows, GC×GC-MS is poised to become the new gold standard for the analysis of the most complex and challenging evidence types.
Mitigating Matrix Effects and Improving Selectivity for Trace Analytes
The analysis of trace analytes within complex sample matrices presents a formidable challenge in fields ranging from forensic science to metabolomics. Matrix effects—the suppression or enhancement of an analyte's signal by co-eluting compounds from the sample—significantly compromise quantitative accuracy and analytical selectivity [49]. These effects manifest throughout the analytical process, particularly during sample injection and the initial separation phases, where interferents can obstruct analyte transfer or detection [49]. In forensic contexts, where results must withstand legal scrutiny under standards such as Daubert and Mohan, the reliability of analytical data is paramount [2]. This guide objectively compares the capabilities of comprehensive two-dimensional gas chromatography-mass spectrometry (GC×GC-MS) against traditional one-dimensional GC-MS in mitigating these challenges, with a specific focus on experimental data supporting their performance in trace analysis.
Technical Comparison: GC×GC-MS vs. Traditional GC-MS
Fundamental Operational Differences
The core distinction between these techniques lies in their separation approach. Traditional GC-MS employs a single chromatographic column, separating compounds based on one chemical property, such as volatility or polarity [50]. In contrast, GC×GC-MS connects two columns of differing stationary phases in series via a modulator, which is considered the "heart of the GC×GC system" [2]. This modulator periodically collects and refocuses effluent from the first column, injecting it as narrow chemical pulses into the second column for an independent, orthogonally-based separation [2] [15]. This process creates a two-dimensional chromatogram with vastly increased peak capacity (the number of peaks that can be resolved in a run) [51].
Performance Data and Comparative Analysis
Direct comparison of experimental data demonstrates the performance advantages of GC×GC-MS. A 2024 study specifically comparing a solid-state modulator (SSM) GC×GC-MS system with traditional GC-MS for non-targeted metabolomics reported a threefold increase in the number of identifiable metabolites on the GC×GC platform. The study also documented significantly improved sensitivity, with lower limits of quantitation (LLOQs) reduced to 0.5–0.05 times those achievable with GC-MS. Critically, this enhancement occurred without sacrificing precision or accuracy, both of which were maintained within the 85-115% range [44].
Table 1: Quantitative Performance Comparison in Metabolomics Analysis
| Performance Metric | Traditional GC-MS | GC×GC-MS (with SSM) | Improvement Factor |
|---|---|---|---|
| Number of Identifiable Metabolites | Baseline | ~3x Increase | 3x [44] |
| Lower Limits of Quantitation (LLOQ) | Baseline | 0.5 to 0.05x Baseline | 2 to 20x more sensitive [44] |
| Quantification Accuracy | 85-115% | 85-115% | Comparable [44] |
| Intra-/Inter-day Precision | Mostly within 20% | Mostly within 20% | Comparable [44] |
Sensitivity enhancements are attributed to the modulation process, which compresses analyte bands into very narrow peaks, thereby increasing the signal-to-noise (S/N) ratio. Studies have documented S/N enhancements by factors of 10-27 compared to 1D-GC [51]. This improved sensitivity allows for the detection of minor and trace-level components that are often obscured in complex 1D chromatograms [15].
Table 2: General Analytical Capabilities Comparison
| Analytical Capability | Traditional GC-MS | GC×GC-MS |
|---|---|---|
| Peak Capacity | Lower | Significantly Higher [2] |
| Signal-to-Noise Ratio | Baseline | 10-27x Enhancement [51] |
| Ability to Deconvolve Co-elutions | Limited | Excellent [15] |
| Chemical "Fingerprinting" | Basic | Highly Structured, Informative [15] |
| Range of Applications | Broad | Ideal for Highly Complex Mixtures [2] |
Experimental Protocols for Comparative Evaluation
Protocol for Evaluating Matrix Effects
Objective: To quantitatively compare the susceptibility of GC×GC-MS and GC-MS to matrix-induced signal suppression/enhancement.
Materials: Analytical standards of target analytes, blank matrix (e.g., plasma, plant extract), appropriate internal standards, derivatization agent (if required, e.g., MTBSTFA or silylation reagents) [49] [52].
Method:
- Preparation of Solutions:
- Neat Solution: Prepare calibration standards in a pure solvent.
- Matrix-Matched Solution: Prepare identical calibration standards in a processed blank matrix extract.
- Internal Standard: Add a stable isotope-labeled internal standard (SIDA) to all solutions where available [53].
- Instrumental Analysis: Analyze both sets of solutions using identical GC×GC-MS and GC-MS methods. Key GC×GC parameters include the modulator type (e.g., solid-state or cryogenic), modulation period, and temperature programs for both ovens [44].
- Data Analysis:
- Plot the peak area (or area ratio relative to internal standard) against the known concentration for both neat and matrix-matched solutions.
- Calculate the Matrix Effect (ME%) as:
ME% = (Slope of matrix-matched calibration curve / Slope of neat solvent calibration curve) x 100%. - An ME% of 100% indicates no matrix effect; <100% indicates suppression; >100% indicates enhancement. Compare the ME% values between the two platforms.
Protocol for Assessing Selectivity in Complex Mixtures
Objective: To demonstrate the superior separation power (selectivity) of GC×GC-MS in resolving analytes from complex backgrounds.
Materials: Complex real-world sample (e.g., sexual lubricant, automotive paint pyrolysate, petroleum product), reference standards [15].
Method:
- Sample Preparation: Extract samples using a suitable solvent (e.g., hexane for lubricants [15]). For paints or tires, use flash pyrolysis (~50 µg, ramped to 750°C) to liberate volatile components [15].
- Dual Instrument Analysis: Inject the same sample extract onto both GC×GC-MS and traditional GC-MS systems.
- Data Comparison:
- For GC-MS, examine the 1D total ion chromatogram (TIC) for peak overlap and co-elutions.
- For GC×GC-MS, examine the 2D contour plot. Analytes separated in the second dimension will appear as distinct spots, even if they co-eluted from the first dimension [15].
- Count the number of resolved peaks/components visible in each analysis. The use of automated filtering scripts based on accurate mass can further aid in identifying and grouping compounds in the GC×GC-MS data [52].
Signaling Pathways and Workflow Visualization
Decision Pathway for Analytical Method Selection
The following diagram outlines a systematic workflow for selecting between GC-MS and GC×GC-MS based on project goals, sample complexity, and legal considerations.
GC×GC-MS Operational Workflow
This diagram illustrates the key stages of the GC×GC-MS analytical process, from sample introduction to final data output, highlighting the modulation step that enables two-dimensional separation.
The Scientist's Toolkit: Essential Research Reagents and Materials
Successful implementation of these analytical methods, particularly for mitigating matrix effects, relies on several key reagents and materials.
Table 3: Essential Reagents and Materials for Reliable GC-MS and GC×GC-MS Analysis
| Item | Function/Purpose | Application Example |
|---|---|---|
| Stable Isotope-Labeled Internal Standards (SIDA) | Corrects for matrix effects and losses during preparation; gold standard for quantitation [53]. | Determination of mycotoxins in food, glyphosate in crops [53]. |
| Derivatization Reagents (e.g., MTBSTFA) | Increases volatility and thermal stability of polar compounds; can improve sensitivity and spectral features [52]. | Analysis of naphthenic acids by producing characteristic [M-57]+ ions [52]. |
| Analyte Protectants / Matrix-Matched Standards | Mimic the sample matrix to compensate for matrix-induced enhancement/suppression during GC injection [49] [53]. | Calibration for pesticide residues in diverse food matrices [53]. |
| Solid-Phase Extraction (SPE) Cartridges | Clean-up sample extracts to remove interfering matrix components, thereby reducing matrix effects [53]. | Cleanup for melamine and cyanuric acid in infant formula [53]. |
| Inert Liner & Column Maintenance | Reduces active sites in the inlet and column that can adsorb analytes, a common source of matrix effects [49]. | Routine maintenance for all analyses; critical for active compounds. |
Forensic Analysis and Technology Readiness Level (TRL) Comparison
The adoption of any new technology in forensic laboratories requires meeting stringent legal standards for evidence admissibility, such as the Daubert Standard in the United States or the Mohan Criteria in Canada, which emphasize reliability, peer review, known error rates, and general acceptance [2]. A review of literature as of 2024 assesses the TRL of various forensic applications on a scale from 1 (basic principle observed) to 4 (technology validated in relevant environment), with 5+ representing routine use [2].
While traditional GC-MS is at TRL 5+ (routinely used in casework), GC×GC-MS is predominantly at TRL 3-4 for most forensic applications. It has been successfully demonstrated in research settings for ignitable liquid analysis, sexual lubricant characterization, automotive paint pyrolysis, and tire rubber analysis [2] [15]. For example, GC×GC-MS deconvoluted co-eluting peaks in automotive paint pyrolysates (e.g., α-methylstyrene and n-butyl methacrylate) and revealed over 25 components in a lubricant where GC-MS showed significant co-elution [15]. To progress to higher TRLs, future work must focus on inter-laboratory validation studies, standardized methods, and established error rate analysis [2].
Both GC×GC-MS and traditional GC-MS are powerful tools in the analytical chemist's arsenal. The choice between them hinges on the specific analytical challenge. Traditional GC-MS remains a robust, legally-established, and cost-effective solution for well-defined applications where target analytes are known and sample complexity is moderate. In contrast, GC×GC-MS provides a paradigm shift in separation science, offering a powerful combination of enhanced selectivity, superior sensitivity, and structured information-rich data. It is the unequivocal choice for untargeted discovery, analyzing highly complex mixtures, and detecting trace analytes obscured by a challenging matrix. As GC×GC-MS continues to undergo rigorous validation, its role in forensic and research laboratories is poised to expand, ultimately providing scientists with deeper insights into the chemical composition of our world.
Forensic science stands at a technological crossroads, where advanced analytical techniques developed in research settings hold immense potential for revolutionizing routine casework. The transition from traditional one-dimensional gas chromatography coupled with mass spectrometry (GC-MS) to comprehensive two-dimensional gas chromatography (GC×GC-MS) represents a paradigm shift in forensic chemical analysis. While conventional GC-MS has long been the undisputed gold standard in forensic laboratories, GC×GC-MS offers unprecedented separation power for complex mixtures encountered in evidentiary materials. This guide objectively compares the performance, technological readiness, and practical implementation challenges of these two techniques within the framework of moving from research validation to routine forensic application. The critical evaluation extends beyond mere analytical capabilities to encompass the stringent legal standards governing admissibility of scientific evidence in courtrooms, including the Daubert Standard and Federal Rule of Evidence 702 in the United States and the Mohan Criteria in Canada [2]. Understanding this complex landscape of analytical science and legal admissibility is essential for researchers, forensic scientists, and laboratory directors aiming to implement cutting-edge technology while maintaining evidentiary integrity.
Technical Comparison: GC-MS versus GC×GC-MS
Fundamental Principles and Mechanisms
Traditional GC-MS operates on a single separation dimension, where volatile and semi-volatile compounds are separated based on their differential partitioning between a mobile gas phase and a stationary liquid phase within a single column. Detection occurs via mass spectrometry, typically using electron ionization sources and quadrupole or ion trap mass analyzers that provide characteristic fragmentation patterns for compound identification. This one-dimensional approach, while robust and well-understood, has inherent limitations in peak capacity that can lead to co-elution of compounds in complex forensic mixtures such as drug samples, fire debris, or biological residues [2].
In contrast, GC×GC-MS represents a significant evolutionary advancement in separation science. The technique employs two separate chromatographic columns connected in series via a specialized interface called a modulator. The first dimension (1D) column typically utilizes a non-polar stationary phase, separating compounds primarily by volatility. The modulator, often described as the "heart of the GC×GC system," continuously traps, focuses, and reinjects narrow bands of effluent from the first column onto a second dimension (2D) column, which generally features a polar stationary phase for separation based on polarity differences [2]. This orthogonal separation mechanism dramatically increases peak capacity and resolution, with the secondary separation occurring rapidly (typically within 2-10 seconds) throughout the entire analysis. Detection is most commonly achieved through time-of-flight mass spectrometry (TOF-MS), which enables rapid acquisition rates necessary to properly capture the narrow peaks produced in the second dimension [16].
Analytical Performance Metrics
Table 1: Direct Performance Comparison of GC-MS and GC×GC-MS for Forensic Applications
| Performance Parameter | Traditional GC-MS | GC×GC-MS |
|---|---|---|
| Peak Capacity | Limited, ~100-400 | Significantly enhanced, ~400-1000+ |
| Resolution | Moderate, co-elution common in complex samples | Superior, minimizes co-elution through orthogonal separation |
| Sensitivity | Good | Enhanced signal-to-noise ratio through analyte focusing in modulator |
| Separation Mechanisms | Single (primarily volatility) | Two orthogonal mechanisms (volatility and polarity) |
| Data Dimensionality | 1D chromatogram (retention time vs. intensity) | 2D contour plot (1D retention time vs. 2D retention time) |
| Ideal Forensic Applications | Targeted analysis of known compounds, simple mixtures | Untargeted screening, complex mixtures, unknown identification |
| Technology Readiness Level (TRL) [2] | 4 (Routine implementation) | 2-3 (Research to validation phase) |
The enhanced performance of GC×GC-MS is particularly valuable for non-targeted forensic applications where a wide range of analytes must be analyzed simultaneously [2]. The increased peak capacity directly addresses the challenge of complex mixture analysis, which is common in forensic evidence such as ignitable liquid residues, illicit drug preparations, and decomposition odors. The modulation process not only improves separation but also concentrates analyte bands, leading to increased signal-to-noise ratios and lower detection limits—a critical advantage when analyzing trace evidence [2].
Experimental Protocols and Forensic Applications
Fingerprint Chemical Profiling and Aging Studies
Experimental Protocol: The analysis of fingerprint chemical composition and its temporal changes employs a meticulous methodology. Fingerprint samples are collected on cleaned substrates (typically aluminum or glass) using approved sampling protocols that minimize contamination. Internal standards are added prior to extraction to account for analytical variability. Extraction is performed using appropriate solvents (e.g., hexane or dichloromethane) with ultrasonication or pressurized fluid extraction. The concentrated extracts are then analyzed via GC×GC-TOF-MS using a standardized temperature program [16].
Key Findings: Research by Vozka and colleagues demonstrates that GC×GC-TOF-MS enables monitoring of subtle chemical transformations in fingerprint residues over time. Immediately after deposition, volatile components begin to evaporate. Over subsequent days, semi-volatile compounds and lipids such as fatty acids undergo oxidative degradation, producing new oxygenated species. These reactions continue over weeks or months, often leading to formation of high-molecular-weight products [16]. The orthogonal separation provided by GC×GC allows researchers to resolve and monitor these chemical changes more effectively than with traditional GC-MS, enabling the development of chemometric models for estimating fingerprint age—a capability largely unattainable with conventional methods.
Forensic Toxicology and Drug Analysis
Experimental Protocol: For toxicological screening in biological matrices, sample preparation typically involves protein precipitation and extraction. One validated protocol specifies adding 200 μL of glacial acetonitrile (-20°C) to 100 μL of whole blood for deproteinization, followed by addition of 40 mg of QuEChERS salts (4 g MgSO₄/1 g NaCl/1 g sodium citrate dihydrate/0.5 sodium citrate sesquihydrate). After centrifugation, the supernatant is diluted with aqueous mobile phase and injected [54]. Chromatographic separation employs a biphenyl column (100 × 2.1 mm, 2.7 μm) with a gradient of ammonium formate buffer and methanol at 0.3 mL/min flow rate [54].
Key Findings: Comparative studies highlight scenarios where GC×GC-MS provides critical advantages. In a case involving driving under the influence of drugs, traditional GC-MS with multiple reaction monitoring (MRM) initially suggested the presence of 2C-B (an amphetamine) based on retention time and two transitions matching reference standards. However, subsequent analysis using GC×GC-TOF-MS revealed a mass error >500 ppm for both the precursor and fragments, definitively excluding 2C-B and preventing a false positive identification [54]. This case demonstrates how the increased specificity of GC×GC-MS can provide unambiguous compound identification in complex biological matrices where isobaric interferences may mislead conventional techniques.
Comprehensive Workflow Diagram
The following diagram illustrates the complete analytical workflow for forensic sample analysis using GC×GC-MS, from sample collection to data interpretation:
Technology Readiness Level (TRL) Assessment
Current TRL Status Across Forensic Applications
Table 2: Technology Readiness Levels for GC×GC-MS in Various Forensic Applications [2]
| Forensic Application | Current TRL | Key Research Developments | Barriers to Routine Implementation |
|---|---|---|---|
| Illicit Drug Analysis | 3 | Proof-of-concept for complex mixture separation | Standardization, validation, database development |
| Fingerprint Chemistry | 2-3 | Chemical profiling and aging models established | Sampling variability, reference databases |
| Toxicology | 3 | Demonstrated superiority for isobaric compound discrimination | Transfer from targeted to untargeted screening |
| Decomposition Odor | 3 | Volatile organic compound profiling for postmortem interval | Environmental variability, validation |
| Fire Debris & ILR | 3-4 | Enhanced chemical profiling for ignitable liquid residues | Standardization, data interpretation guidelines |
| Oil Spill Tracing | 3-4 | Comprehensive hydrocarbon pattern matching | Admissibility precedents, error rate determination |
Legal Admissibility Framework
The adoption of new analytical techniques in forensic laboratories must navigate stringent legal standards for evidence admissibility. In the United States, the Daubert Standard (from Daubert v. Merrell Dow Pharmaceuticals, Inc., 1993) requires that scientific testimony be based on methods that: (1) can be and have been tested; (2) have been peer-reviewed and published; (3) have a known error rate; and (4) are generally accepted in the relevant scientific community [2]. These requirements were subsequently incorporated into the Federal Rule of Evidence 702. Similarly, in Canada, the Mohan criteria establish that expert evidence must be relevant, necessary, absent exclusionary rules, and presented by a qualified expert [2].
For GC×GC-MS to achieve courtroom admissibility, research must progress beyond demonstrating analytical superiority to addressing these legal requirements. This necessitates intra- and inter-laboratory validation studies, establishing standardized operating procedures, determining method error rates, and building general acceptance through publication and peer recognition [2]. Currently, GC×GC-MS meets several Daubert criteria—it has been thoroughly tested and widely published in peer-reviewed literature—but requires further work on establishing known error rates and achieving widespread acceptance in operational forensic laboratories.
Essential Research Reagent Solutions
Table 3: Key Reagents and Materials for Forensic GC×GC-MS Analysis
| Reagent/Material | Function | Application Examples |
|---|---|---|
| QuEChERS Salts (MgSO₄, NaCl, sodium citrate) | Sample preparation: salting-out extraction and cleanup | Whole blood and tissue analysis in toxicology [54] |
| Biphenyl Chromatography Column | LC separation prior to GC×GC analysis | Forensic toxicology screening [54] |
| Internal Standards (deuterated analogs) | Quantification and quality control | All quantitative applications |
| Aluminum Substrates | Fingerprint collection medium | Fingerprint chemical profiling [16] |
| Organic Solvents (hexane, dichloromethane, acetonitrile) | Sample extraction and preparation | General evidence extraction |
| Alkanes Standard Mixture | Retention index calibration | Retention time standardization |
| Quality Control Materials | Method validation and performance verification | Ongoing quality assurance |
Implementation Roadmap: From Research to Routine
Strategic Pathway for Laboratory Adoption
The transition of GC×GC-MS from research technology to routine forensic application requires a systematic approach addressing both analytical and legal considerations. Laboratories should prioritize application areas where the technique provides unambiguous advantages over existing methods, particularly for complex mixture analysis where conventional GC-MS suffers from insufficient resolution. The implementation pathway should include method standardization, comprehensive validation studies conforming to ISO/IEC 17025 requirements, development of expert testimony frameworks, and creation of effective visual aids for courtroom presentation [55].
Research indicates that while GC×GC contour plots appear more complex than traditional chromatograms, non-specialist viewers can effectively identify differences between samples when presented with appropriate context and guidance [55]. This finding is significant for courtroom implementation, suggesting that with proper explanation, judges and juries can comprehend GC×GC data presented through visual aids. Expert witnesses should develop clear explanatory frameworks that translate the technical complexity of GC×GC-MS into accessible information while maintaining scientific integrity.
Future Directions and Emerging Trends
The future integration of GC×GC-MS into forensic laboratories will likely be accelerated by several technological trends. Artificial intelligence and machine learning are increasingly being applied to chromatographic data interpretation, helping to deconvolute complex mixtures and identify patterns relevant to forensic intelligence [56]. Miniaturization of instrumentation addresses interests in green analytics, smaller laboratory footprints, and reduced operational costs [56]. Additionally, automation continues to advance, offering improvements in analysis reproducibility and operational efficiency despite initial capital investment challenges [56].
As these technological advancements mature, the focus must remain on establishing the rigorous scientific foundations required for legal admissibility. Future research should prioritize inter-laboratory validation studies, determination of method error rates, and development of standardized operating procedures that can be implemented across diverse forensic laboratory environments. Through coordinated efforts between researchers, forensic practitioners, and legal stakeholders, GC×GC-MS can successfully bridge the gap from promising research technology to routine forensic implementation, ultimately enhancing the scientific precision of evidence presented in courtrooms worldwide.
Benchmarking Performance: A Direct Comparison of Validation Metrics
In forensic science, the analytical ability to separate individual components within a complex mixture can determine the success of an investigation. Traditional gas chromatography-mass spectrometry (GC-MS) has long been the established method for trace evidence analysis. However, comprehensive two-dimensional gas chromatography-mass spectrometry (GC×GC-MS) provides a powerful alternative with significantly enhanced separation capabilities [1] [7]. This guide objectively compares the performance of these two techniques, focusing on their peak capacity and resolution when applied to forensic-like samples.
The core advantage of GC×GC-MS lies in its two-dimensional separation process. While GC-MS uses a single column to separate components, GC×GC-MS employs two separate columns with different stationary phases, connected via a modulator [2] [57]. This configuration provides two independent separation mechanisms, dramatically increasing the peak capacity—the number of peaks that can be separated in a single analysis. The modulator rapidly traps and re-injects effluent from the first column onto the second column, producing a highly focused, comprehensive chromatographic analysis [57].
Experimental Comparison: Direct Performance Metrics
Quantitative Performance Data
Table 1: Direct Performance Comparison Between GC-MS and GC×GC-MS
| Performance Metric | GC-MS | GC×GC-MS | Sample Type | Source |
|---|---|---|---|---|
| Number of Detected Peaks (SNR ≥ 50) | ~1x (Baseline) | ~3x more peaks | Human Serum Metabolites | [11] |
| Number of Identified Metabolites (Rsim ≥ 600) | ~1x (Baseline) | ~3x more metabolites | Human Serum Metabolites | [11] |
| Statistically Significant Biomarkers | 23 metabolites | 34 metabolites | Human Serum (Patient vs. Control) | [11] |
| Components Found in Lubricant | >6 components with coelution | >25 distinct components | Oil-based Personal Lubricant | [1] [7] |
| Key Outcome | Substantial coelution between 7-20 min retention | Full separation of coeluted components | Oil-based Personal Lubricant | [1] [7] |
Experimental Protocols for Forensic Sample Analysis
The comparative data in Table 1 were generated using standardized experimental protocols designed to ensure a fair comparison between the two techniques.
- Sample Preparation for Lubricant Analysis: Forensic lubricant samples were prepared via hexane solvent extraction. The extracts were then analyzed by both GC-MS and GC×GC-MS on the same instrumental platform to maintain consistency [1] [7].
- Sample Preparation for Serum Metabolomics: Human serum samples were processed using a methanol/chloroform solvent extraction. The dried extracts were subsequently derivatized using a two-step method involving methoxyamine in pyridine followed by N-methyl-N-(trimethylsilyl)trifluoroacetamide (MSTFA) with 1% trimethylchlorosilane (TMCS) to make the metabolites volatile for GC analysis [11].
- Instrumental Configuration (GC×GC-MS): Analyses were performed using an Agilent 7890B gas chromatograph coupled to a quadrupole mass spectrometer. The GC×GC system used a primary column (e.g., DB-5 ms) and a secondary column (e.g., DB-17 ms) with a different stationary phase, connected via a thermal or flow modulator [1] [11].
- Instrumental Configuration (GC-MS): The same GC-MS system was used, but with only the primary column installed, allowing for a direct comparison using identical instrumentation except for the second dimension [1].
- Pyrolysis-GC×GC-MS for Paint and Tires: For solid samples like automotive paint and tire rubber, a pyrolysis probe was used. A small sample (~50 µg) was subjected to a rapid thermal ramp (e.g., from 50 °C to 750 °C at 50 °C/s) to decompose the material into volatile components for chromatographic analysis [1] [7].
Visualizing the Separation Workflow
The following diagram illustrates the core operational difference between the one-dimensional separation of GC-MS and the comprehensive two-dimensional separation of GC×GC-MS.
Case Studies: Resolution in Action
Automotive Paint Clear Coat Analysis
Analysis of automotive clear coats by pyrolysis-GC-MS often reveals coelution of critical compounds such as toluene and 1,2-propandial, which limits the ability to differentiate between similar samples [1]. When analyzed using py-GC×GC-MS, these coeluting compounds are separated into distinct peaks. For instance, α-methylstyrene and n-butyl methacrylate, which coelute in the first dimension, are successfully resolved, providing a more detailed chemical profile for comparison [1] [7].
Complex Natural Oil-Based Lubricants
The superior resolution of GC×GC-MS is particularly evident in the analysis of sexual assault evidence when traditional DNA analysis fails. Natural oil-based lubricants are highly complex, but GC-MS analysis results in a substantial amount of coelution, masking the true number of components [1] [7]. As shown in Table 1, GC×GC-MS revealed over 25 different components in a sample that appeared to contain only a handful by GC-MS. This enhanced detail provides a more specific "fingerprint" for linking a suspect to a crime scene [1].
The Scientist's Toolkit: Essential Research Reagents and Materials
Table 2: Key Reagents and Materials for GC×GC-MS and GC-MS Forensic Analysis
| Item Name | Function in Analysis | Example Forensic Application |
|---|---|---|
| DB-5 ms (or equivalent) GC Column | Primary column for first-dimension separation; a mid-polarity stationary phase. | Separating the complex mixture of components in pyrolysis products or lubricants [11]. |
| DB-17 ms (or equivalent) GC Column | Secondary column for second-dimension separation; a more polar stationary phase. | Providing an orthogonal separation mechanism to resolve coelutions from the first column [11]. |
| Methoxyamine in Pyridine | Derivatization reagent; protects carbonyl groups and ring-forms sugars. | Preparing metabolites and other polar compounds in serum or other biological fluids for GC analysis [11]. |
| N-Methyl-N-(trimethylsilyl)trifluoroacetamide (MSTFA) | Silylation derivatization reagent; replaces active hydrogens with a TMS group. | Increasing volatility and thermal stability of metabolites, fatty acids, and other analytes with -OH, -NH, or -SH groups [11]. |
| Tenax TA Sorbent Tubes | Traps and concentrates volatile organic compounds (VOCs) from air or headspace. | Active sampling of decomposition odors or ignitable liquid residues at a crime scene [58]. |
| Alkane Retention Index Standard (C10-C40) | Provides reference points for calculating retention indices. | Standardizing retention times across different instruments and runs for more reliable identification [11]. |
Technology Readiness Level (TRL) Comparison in Forensics
The adoption of any new technology in forensic laboratories must be evaluated against rigorous legal standards for evidence admissibility, such as the Daubert Standard or Frye Standard in the United States [2]. These standards require a technique to be tested, peer-reviewed, have a known error rate, and be generally accepted in the scientific community.
- GC-MS TRL: Level 4 (Fully Operational): Traditional GC-MS is the established "gold standard" for analyzing a wide range of trace evidence, including drugs and ignitable liquids. Its methods are fully validated, and its results are routinely admitted in court, reflecting the highest level of technological readiness for forensic applications [1] [2] [7].
- GC×GC-MS TRL: Level 2-3 (Validation & Pilot Studies): GC×GC-MS is currently in the advanced research and development stage for most forensic applications. While its superior analytical performance is proven in peer-reviewed literature (as shown in this guide), it has not yet seen widespread implementation in routine casework. Significant research is focused on method development and validation for specific evidence types, such as lubricants, paints, and complex odor profiles [1] [2]. For it to reach Level 4, extensive intra- and inter-laboratory validation studies are required to establish standardized methods and define known error rates [2].
The experimental data from simulated case samples conclusively demonstrates that GC×GC-MS provides a substantial increase in peak capacity and resolution over traditional GC-MS. Its ability to separate coeluting compounds and detect minor components unlocks a deeper level of chemical information from complex forensic evidence. While GC-MS remains the legally vetted, routine workhorse, GC×GC-MS represents a powerful emerging technology for the most challenging analytical problems, poised to advance forensic capabilities as its methods continue to mature and undergo forensic validation.
In the realm of trace compound analysis, the choice of analytical technique directly dictates the boundaries of what is detectable. Gas Chromatography coupled with Mass Spectrometry (GC-MS) has long been the cornerstone for separating, identifying, and quantifying volatile and semi-volatile organic compounds in complex mixtures [1]. Its versatility and reliability have made it the gold standard in fields ranging from forensic science to environmental monitoring [1] [7]. However, as analytical challenges grow more complex—involving increasingly intricate samples and demands for lower detection limits—comprehensive two-dimensional Gas Chromatography (GC×GC-MS) has emerged as a powerful advanced alternative. This technique employs two separate chromatographic columns to deliver a significant boost in separation power and sensitivity [1].
The core of this comparison lies in the critical metric of the Limit of Detection (LOD)—the lowest concentration of an analyte that can be reliably distinguished from the background. For researchers and method developers, understanding the inherent sensitivity differences between these techniques and their various operational modes (such as Full Scan, SIM, and MRM) is fundamental to selecting the right tool for trace analysis. This is particularly true in forensic contexts, where the ability to detect minor or trace components can be pivotal to an investigation [59] [7].
Comparing Detection Limits Across Techniques and Modes
The sensitivity of a GC-MS analysis is not solely determined by the instrument hardware but also by the selected operational mode. The primary modes—Full Scan, Selected Ion Monitoring (SIM), and Multiple Reaction Monitoring (MRM)—offer a trade-off between the amount of structural information collected and the achievable detection limit.
Table 1: Typical Limits of Detection (LOD) for Different GC-MS Operational Modes
| Technique / Mode | Typical LOD Range | Key Characteristics Affecting Sensitivity |
|---|---|---|
| GC-MS (Full Scan) | High ppb to low ppm [60] | Monitors all ions across a broad mass range; higher chemical noise. |
| GC-MS (SIM) | Low ppb (e.g., 5-10 ng/L) [60] | Monitors only a few target ions, reducing noise and improving signal-to-noise ratio. |
| GC-MS/MS (MRM) | sub-ppb to ppt (e.g., 0.1-1 ng/L) [60] | Monitors specific precursor → product ion transitions, drastically reducing background noise. |
| GC×GC-MS | Varies (often used with Full Scan or SIM) | Increased peak capacity and concentration efficiency at the modulator improve sensitivity for minor components [1]. |
The transition from full scan to SIM typically improves sensitivity by approximately an order of magnitude (~10x) by focusing the detector on a limited number of ions specific to the target analyte, thereby reducing chemical noise [5] [60]. Moving to GC-MS/MS and MRM mode can yield a further 10 to 100-fold improvement in LOD. This is because MRM adds a second layer of selectivity: the first mass analyzer (Q1) selects a precursor ion unique to the compound, which is then fragmented in a collision cell (Q2), and a second mass analyzer (Q3) selects a specific product ion. This two-stage filtering process effectively isolates the target signal from a complex matrix background, leading to unparalleled selectivity and very low detection limits [5] [61].
GC×GC-MS enhances sensitivity through a different mechanism. Its two-dimensional separation process reduces co-elution, which minimizes ion suppression in the MS source. Furthermore, the modulation process focuses analytes into very narrow, concentrated bands as they are transferred from the first to the second column. This results in higher peak amplitudes and a better signal-to-noise ratio, making it particularly powerful for uncovering trace-level compounds hidden by major components in one-dimensional GC-MS [1].
Experimental Protocols for Sensitivity Assessment
Protocol for GC-MS/MS Method Development and MRM Optimization
The high sensitivity of GC-MS/MS is not automatic; it requires careful method development. The following protocol is standard for establishing a sensitive and selective MRM method [5]:
- Full-Scan Analysis: Begin by injecting a standard of the target analyte using a standard GC-MS method in full-scan mode (e.g., m/z 50-500). This generates the initial mass spectrum, such as the classic spectrum for caffeine showing a molecular ion and key fragments like m/z 194, 109, and 82 [5].
- Precursor Ion Selection: From the full-scan spectrum, select the most abundant and characteristic ion (e.g., m/z 194 for caffeine) to serve as the precursor ion in Q1.
- Product Ion Scan: The instrument is then set to operate in product ion scan mode. Q1 is fixed to transmit only the selected precursor ion (m/z 194). This ion is passed to the collision cell (Q2), where it is fragmented using an optimized collision energy. The resulting product ions are scanned by Q3 to generate a product ion mass spectrum.
- MRM Transition Selection: Choose one or more abundant and stable product ions from the product ion spectrum (e.g., m/z 109 for caffeine). The pair of precursor and product ions (e.g., 194 → 109) forms an MRM transition. One transition is used for primary quantification, while others serve as qualifiers for confirmatory analysis [5].
- Optimization: The collision energy and other MS parameters are systematically optimized to maximize the signal for the chosen MRM transitions.
Protocol for Forensic Analysis Using Pyrolysis-GC×GC-MS
For non-volatile and complex forensic evidence like automotive paints or tires, pyrolysis (Py) is coupled with GC×GC-MS. The following workflow illustrates its application [1] [7]:
- Sample Preparation: A small sample (~50 µg) of the material (e.g., automotive clear coat or tire tread) is collected and placed in a pyrolysis tube.
- Flash Pyrolysis: The sample is rapidly heated in the pyrolyzer under an inert atmosphere. A standard profile might be: hold at 50°C for 2 seconds, then ramp to 750°C at 50°C/s and hold for 2 seconds. This thermal decomposition breaks down polymeric materials into smaller, volatile fragments (pyrolysates) [7].
- GC×GC-MS Analysis:
- First Dimension Separation: The pyrolysates are transferred to the first GC column, which is typically a non-polar column, separating compounds primarily by boiling point.
- Modulation: A thermal or flow modulator at the interface between the two columns traps, refocuses, and reinjects the effluent from the first column as sharp, narrow pulses into the second column.
- Second Dimension Separation: The second column, often a mid-polar or polar column, provides a very fast separation (over a few seconds) based on a different chemical property, such as polarity.
- Detection: The separated compounds eluting from the second column are detected by a time-of-flight (TOF) mass spectrometer, which is ideal for the fast scanning speeds required to capture the narrow peaks produced by GC×GC [59].
- Data Interpretation: The data is visualized as a 2D contour plot. This "fingerprint" provides a highly informative pattern for differentiating complex mixtures that are indistinguishable by one-dimensional GC-MS, revealing both major and previously hidden minor components [1].
The following diagram illustrates the logical workflow for developing a GC-MS/MS method, from initial compound detection to final, highly sensitive quantification.
The Scientist's Toolkit: Essential Reagents and Materials
Table 2: Key Research Reagent Solutions for GC-MS and GC×GC-MS Analysis
| Item / Reagent | Function / Application | Example Use-Case |
|---|---|---|
| Tenax TA Sorbent Tubes | Active sampling and trapping of Volatile Organic Compounds (VOCs) from air or headspace [62]. | Environmental monitoring; VOC profiling in forensic decomposition studies [59] [62]. |
| SPME Fibers (e.g., PDMS-DVB) | Solvent-free extraction and pre-concentration of volatiles and semi-volatiles directly from liquid or headspace samples [62]. | Sample introduction in portable GC-MS systems; analysis of explosives in water [62]. |
| Derivatization Reagents (e.g., MSTFA, BSTFA) | Chemically modify polar or thermally labile compounds (e.g., drugs, hormones) to improve their volatility and thermal stability for GC analysis [13] [61]. | Enabling GC-MS analysis of steroids, drugs of abuse, and metabolites [13]. |
| Isotopically Labeled Standards | Act as internal standards for calibration, compensating for matrix effects and losses during sample preparation to ensure accurate quantification [62]. | Essential for reliable quantitation in complex matrices like biological fluids (blood, vitreous humor) in forensic toxicology [63] [62]. |
Advanced Considerations and Future Outlook
The comparison of sensitivity extends beyond traditional benchtop instruments. A systematic study comparing three portable GC-MS devices to a state-of-the-art stationary system revealed that the mobile instruments generally showed a poorer signal-to-noise ratio (with a median S/N roughly 8 times lower) and worse mass spectral reproducibility, impacting both reliable identification and the achievable LODs in the field [62]. This highlights a key trade-off between portability and ultimate sensitivity.
The future of sensitive GC-MS analysis is being shaped by several advanced techniques. GC×GC coupled with Time-of-Flight MS (GC×GC-TOF-MS) is proving invaluable for untargeted forensic analysis, such as studying the time-dependent chemical changes in latent fingerprints or the complex VOC profiles during decomposition, providing rich data sets for multivariate analysis [59]. Furthermore, the combination of GC with Vacuum Ultraviolet (VUV) spectroscopy is emerging as a powerful tool for distinguishing between challenging positional isomers, a task that can be difficult for traditional electron ionization MS [59].
In conclusion, the "sensitivity showdown" reveals a clear hierarchy. While traditional GC-MS in full-scan mode is sufficient for many routine applications, the use of SIM, and particularly the adoption of GC-MS/MS in MRM mode, drives detection limits to their lowest possible levels for targeted quantitation. For untargeted analysis of highly complex mixtures, GC×GC-MS provides superior separation and enhanced sensitivity for minor components. The choice of the optimal technique is therefore dictated by the specific analytical problem: the required detection limit, the complexity of the sample matrix, and the scope of the analysis (targeted vs. untargeted).
The forensic analysis of seized drugs represents a critical juncture where analytical science meets the legal system. The conclusions drawn from this analysis can profoundly impact judicial outcomes, making the reliability, accuracy, and defensibility of the methods employed paramount. Within this context, standards developed by the Scientific Working Group for the Analysis of Seized Drugs (SWGDRUG) provide the foundational framework for minimum methodological requirements [64] [65]. Concurrently, the United Nations Office on Drugs and Crime (UNODC), in collaboration with the World Health Organization, establishes international standards for drug use prevention, which implicitly recognize the need for reliable analytical data to inform sound policy [66]. The adoption of any new analytical technique in routine casework is not merely a function of its technical superiority but is contingent upon its adherence to these rigorous validation and legal admissibility standards.
This guide objectively compares traditional Gas Chromatography-Mass Spectrometry (GC-MS) with the more advanced Comprehensive Two-Dimensional Gas Chromatography-Mass Spectrometry (GC×GC-MS) within this structured framework. While GC-MS is the established "gold standard" in forensic laboratories due to its versatility and robustness, it faces limitations with highly complex mixtures due to co-elution, where multiple compounds elute from the chromatographic column simultaneously [1] [2]. GC×GC-MS addresses this fundamental challenge by introducing a second, orthogonal separation dimension, drastically increasing peak capacity and providing a more detailed chromatographic "fingerprint" of complex samples [2] [7]. The transition from established to novel techniques necessitates a rigorous evaluation of their Technology Readiness Level (TRL) and their alignment with legal precedents such as the Daubert Standard, which requires that a technique be tested, peer-reviewed, have a known error rate, and be generally accepted [2]. This article provides a practical comparison to inform laboratories on the current state of these technologies for the analysis of seized drugs.
Technology Comparison: GC-MS vs. GC×GC-MS
Core Principles and Operational Mechanisms
GC-MS combines the separation power of gas chromatography with the identification capabilities of mass spectrometry. A sample is vaporized, and its components are separated based on their volatility and interaction with the stationary phase of a capillary column. The separated compounds are then ionized and fragmented in the mass spectrometer, producing a mass spectrum that serves as a unique identifier for each compound [61]. This technique provides a single dimension of separation followed by mass detection.
GC×GC-MS is a comprehensive multidimensional technique that fundamentally enhances separation. It employs two serially connected columns of differing stationary phases, linked by a modulator. As compounds elute from the first dimension (¹D) column, the modulator traps and focuses narrow bands of the eluate, then rapidly injects them into the second dimension (²D) column. This process occurs repeatedly throughout the entire analysis. The ²D separation, which is very fast (typically a few seconds), provides an independent separation mechanism based on different chemical properties (e.g., polarity vs. volatility) [2]. The result is a two-dimensional chromatogram where compounds are spread across a plane, resolving co-elutions that are intractable by 1D-GC and increasing the signal-to-noise ratio for minor components [1] [7].
Performance Metrics and Comparative Data
The following table summarizes the key analytical differences between GC-MS and GC×GC-MS, which form the basis for their respective capabilities and limitations.
Table 1: Performance Comparison of GC-MS and GC×GC-MS
| Feature | GC-MS | GC×GC-MS |
|---|---|---|
| Separation Dimensions | One | Two (orthogonal) |
| Peak Capacity | Lower | Significantly Higher (10x or more) |
| Sensitivity | Moderate (ng to pg) [61] | Enhanced for minor/trace components [1] |
| Resolution of Complex Mixtures | Limited by co-elution | Superior, deconvolutes co-eluted peaks [1] [2] |
| Type of Data Output | Linear Chromatogram | 2D / Topographic Plot (Fingerprint) |
| Data Complexity | Moderate | High, requires specialized software [2] |
| Operational Complexity | Lower, widely understood | Higher, requires specialized training |
| Analysis Time | Shorter (e.g., 30 min) [67] | Longer (can be several hours) |
| Cost (Initial & Operational) | Lower | Higher |
Analytical Standards and Legal Admissibility Framework
SWGDRUG Recommendations and Method Validation
The SWGDRUG Recommendations are recognized as the minimum standards for the forensic examination of seized drugs. The core philosophy is that analyses should utilize techniques from at least two different analytical methods (e.g., chromatography and spectroscopy) to confidently identify a controlled substance [64] [65]. The recommendations provide detailed guidelines on method validation, requiring demonstrated specificity, accuracy, precision, linearity, range, limit of detection (LOD), and robustness for any technique used [64].
For a novel technique like GC×GC-MS to be adopted in an accredited laboratory, its validation package must demonstrate compliance with these criteria. This involves direct comparison with established methods like GC-MS, proving that it meets or exceeds performance in key areas, particularly specificity (the ability to distinguish the analyte from interferents) [2]. The enhanced separation power of GC×GC-MS directly addresses the specificity requirement for complex mixtures where GC-MS may fail.
Legal Admissibility: Daubert and Frye Standards
The legal system acts as the ultimate gatekeeper for forensic evidence. In the United States, the Daubert Standard (and the related Frye Standard) sets the criteria for the admissibility of expert testimony [2]. The key Daubert factors are:
- Whether the theory or technique can be (and has been) tested.
- Whether it has been subjected to peer review and publication.
- The known or potential error rate.
- The existence and maintenance of standards controlling its operation.
- Whether it has gained widespread acceptance within the relevant scientific community.
Table 2: Legal and Validation Readiness Level (LVRL) Assessment
| Criterion | GC-MS | GC×GC-MS |
|---|---|---|
| General Acceptance | High ("Gold Standard") [1] | Low to Moderate (Research & Development) [2] |
| Peer-Reviewed Literature | Extensive | Growing, but limited for forensic drugs [2] |
| Known Error Rate | Established through decades of use | Under active investigation [2] |
| Standardized Methods | Well-defined (e.g., ASTM) | In development, not yet routine [2] |
| SWGDRUG Compliance | Fully compliant | Can be compliant, but requires extensive validation |
As the table illustrates, while GC×GC-MS shows immense analytical promise, its journey toward routine use in courtrooms is ongoing. Current research must focus on intra- and inter-laboratory validation studies, establishing reproducible error rates, and developing standardized methods to meet Daubert criteria [2].
Experimental Protocols and Data Generation
Sample Preparation Workflow
The following diagram illustrates a generalized sample preparation workflow applicable to the analysis of complex forensic drug mixtures, adapted from protocols referenced in the search results [61] [1].
Key Experimental Parameters from Literature
To illustrate the practical application, the following table summarizes experimental conditions from published forensic studies utilizing these techniques.
Table 3: Exemplary Experimental Parameters from Forensic Studies
| Application | Technique | Sample Preparation | Key Instrumental Parameters | Key Finding |
|---|---|---|---|---|
| Sexual Lubricant Analysis [1] [7] | GC×GC-MS | Hexane solvent extraction | Columns: ¹D non-polar, ²D mid-polar; Modulator: Differential Flow Modulation (DFM) | Resolved >25 components; GC-MS showed substantial co-elution between 7-20 min. |
| Automotive Paint Pyrolysis [1] [7] | Py-GC×GC-MS | Flash pyrolysis at 750°C | Same column configuration as lubricant analysis. | Resolved co-eluting peaks of α-methylstyrene and n-butyl methacrylate, not possible with 1D GC-MS. |
| Fire Debris Analysis [67] | Rapid GC-MS | Passive headspace concentration | Column: 2m DB-1ht; Run time: ~1 minute. | Successfully identified major compounds in gasoline and diesel as a rapid screening tool. |
| General Drug Analysis [61] | GC-MS/MS | Solid Phase Extraction (SPE), Derivatization | MRM mode for high sensitivity and selectivity. | Detection limits in the pg to fg range for targeted analytes in complex matrices. |
The Scientist's Toolkit: Essential Research Reagents and Materials
The following table details key materials and consumables critical for conducting GC-MS and GC×GC-MS analyses in a forensic context.
Table 4: Essential Research Reagent Solutions and Materials
| Item | Function / Description |
|---|---|
| Chromatography Columns | ¹D Column: Typically a non-polar (e.g., 100% polydimethylsiloxane) or mid-polar column for primary separation. ²D Column: A short, highly efficient polar (e.g., wax) or semi-polar column for fast secondary separation [2]. |
| Modulator | The heart of the GC×GC system. It traps, focuses, and reinjects eluate from the first to the second column. Types include thermal modulators (TM) and flow modulators (DFM) [1] [2]. |
| Mass Spectrometer | Detector for identifying separated compounds. Quadrupole MS is common for GC-MS; GC×GC often uses Time-of-Flight (TOF) MS for fast acquisition rates to capture narrow ²D peaks [2] [5]. |
| Extraction Sorbents (SPE) | Solid-phase extraction cartridges (e.g., C18, silica, mixed-mode) for sample clean-up to remove matrix interferences and concentrate analytes [61]. |
| Derivatization Reagents | Chemicals like N,O-Bis(trimethylsilyl)trifluoroacetamide (BSTFA) or Methylation reagents. They improve volatility and thermal stability of polar compounds (e.g., acids, alcohols) [61]. |
| Internal Standards | Stable isotope-labeled analogs of target analytes. Added to the sample to correct for variability in sample preparation and instrument response, crucial for quantitative accuracy [61]. |
| Certified Reference Materials | Physicochemical standards with certified purity and identity for instrument calibration, method development, and validation as required by SWGDRUG [64] [65]. |
The objective comparison between GC-MS and GC×GC-MS reveals a clear trajectory in forensic analytical science. GC-MS remains the robust, legally validated, and cost-effective workhorse for the majority of routine seized drug analyses. Its position is solidified by its compliance with SWGDRUG standards and general acceptance under the Daubert framework.
In contrast, GC×GC-MS represents a powerful research and development tool with demonstrated analytical superiority for the most complex evidence types. Its ability to deconvolute complex mixtures and provide unparalleled fingerprinting data is undeniable. However, its current Technology Readiness Level for routine casework is lower, as it has not yet fully met the stringent requirements for legal admissibility on a widespread scale [2]. The path forward for GC×GC-MS requires a concerted effort focused on inter-laboratory validation, standardization of methods, and the establishment of known error rates. As this process continues, GC×GC-MS holds the potential to become the new gold standard for forensic analyses where complexity exceeds the capabilities of traditional methods.
In the field of forensic chemical analysis, the confident identification of trace compounds is paramount. Complex mixtures—from illicit drugs to explosive residues and ignitable liquids—present a significant analytical challenge: chromatographic coelution, where multiple compounds exit the separation column simultaneously. This phenomenon obscures individual component mass spectra, leading to misidentification or missed detections entirely. Spectral deconvolution has emerged as a critical computational process to address this by separating overlapping mass spectra, thereby reconstructing pure component spectra for more reliable identification [68].
This guide objectively compares how this data analysis challenge is addressed by traditional one-dimensional Gas Chromatography-Mass Spectrometry (GC-MS) and the more advanced Comprehensive Two-Dimensional Gas Chromatography-Mass Spectrometry (GC×GC-MS). We evaluate both platforms within a forensic context, focusing on their deconvolution efficacy, the resulting confidence in metabolite identification, and the supporting experimental data that quantifies their performance. The core thesis is that the superior peak capacity of GC×GC-MS reduces the initial burden of coelution, leading to cleaner spectra for deconvolution algorithms and, consequently, higher-confidence identification scores essential for forensic reporting and testimony.
Platform Comparison: GC-MS vs. GC×GC-MS
Fundamental Principles and Technological Differences
Traditional GC-MS separates complex mixtures using a single chromatographic column. The separation power, or peak capacity, is limited by the column's length and stationary phase. In complex samples, this often leads to coelution, where multiple analytes reach the detector simultaneously, resulting in mixed mass spectra that are difficult to interpret and identify [11] [68].
GC×GC-MS employs two separate chromatographic columns in series, connected by a modulator. The second column is typically shorter and has a different stationary phase, providing an independent, and often orthogonal, separation mechanism. The modulator periodically collects effluent from the first dimension, focuses it into a narrow band, and reinjects it into the second dimension. This process results in two key advantages: a dramatic increase in peak capacity (the number of peaks that can be resolved in a run) and peak focusing, which concentrates analytes into sharper bands, thereby increasing signal-to-noise ratios [11] [1] [51].
Performance Metrics and Experimental Data
Direct comparative studies quantify the performance gap between these platforms. The following table summarizes key experimental findings from the analysis of human serum samples, a complex biological matrix relevant to forensic toxicology [11].
Table 1: Quantitative Comparison of GC-MS and GC×GC-MS Performance in Metabolite Analysis
| Performance Metric | GC-MS Platform | GC×GC-MS Platform | Improvement Factor |
|---|---|---|---|
| Detected Peaks (SNR ≥ 50) | Baseline (x1) | ~3x more peaks | ~3x [11] |
| Identified Metabolites (Rsim ≥ 600) | Baseline (x1) | ~3x more metabolites | ~3x [11] |
| Statistically Significant Biomarkers | 23 metabolites | 34 metabolites | ~1.5x [11] |
| Primary Advantage | Well-established, simpler data analysis | Superior resolution & sensitivity for complex samples | - |
| Key Limitation | Severe coelution in complex matrices | Increased data complexity and processing time | - |
Further sensitivity studies using flame ionization detection (FID) and time-of-flight mass spectrometry (TOF-MS) have demonstrated that the modulation process in GC×GC can lead to a signal-to-noise (S/N) enhancement by a factor of 10-27 compared to 1D GC, directly lowering method detection limits (MDLs) for trace-level analytes [51].
Experimental Protocols: Deconvolution in Action
Sample Preparation and Analysis
A standardized protocol for comparing platform performance on human serum samples involves [11]:
- Extraction: 100 µL of serum is added to 1 mL of ice-cold methanol/chloroform (3:1 v:v) containing internal standards (e.g., heptadecanoic acid, norleucine).
- Derivatization: The dried extract is subjected to a two-step derivatization process: first with methoxyamine in pyridine (90 min at 30°C), followed by N-methyl-N-(trimethylsilyl)trifluoroacetamide (MSTFA) with 1% trimethylchlorosilane (TMCS) (60 min at 70°C) to make metabolites volatile for GC analysis.
- Instrumental Analysis: The derivatized samples are analyzed in randomized order on both GC-MS and GC×GC- MS platforms. A pooled quality control (QC) sample is analyzed after every nine biological samples to monitor instrument performance and for data correction. A 60 m DB-5 ms UI column is used for the first dimension in both systems, while the GC×GC system adds a 1 m DB-17 ms column as the second dimension.
Data Processing and Spectral Deconvolution Workflow
The raw data from both platforms is processed to extract pure mass spectra and enable identification. The generalized workflow for deconvolution is as follows, with the complexity of the input data being a key differentiator:
Diagram 1: Spectral Deconvolution Workflow.
The algorithms, such as those in AMDIS (Automated Mass Spectrometry Deconvolution and Identification System), perform this deconvolution through several steps [68]:
- Noise Analysis: The chromatogram is segmented to calculate a characteristic noise factor, distinguishing true signal from background noise.
- Component Perception: The algorithm scans for points where multiple ions maximize simultaneously, indicating a potential component.
- Model Peak Determination: For each perceived component, the model peak shape is determined from the individual ion chromatograms that maximize together.
- Spectrum Deconvolution: The algorithm calculates the contribution of each coeluting component to the total signal at every point in the peak cluster, reconstructing a pure mass spectrum for each.
The effectiveness of this process is highly dependent on the initial chromatographic separation. GC×GC-MS, by spreading peaks across a two-dimensional plane, presents simpler, less overlapping mixtures to the deconvolution algorithm, resulting in more accurate pure spectra [11] [69].
Forensic Case Studies: Resolution in Practice
Sexual Assault Lubricant Analysis
In sexual assault cases where condoms are used, traditional DNA evidence may be absent. Analysis of lubricant residues can provide a crucial alternative link. However, commercial lubricants often contain complex mixtures of natural oils and synthetic compounds. GC-MS analysis of an oil-based lubricant revealed significant coelution between 7 and 20 minutes, obscuring many individual components. In contrast, GC×GC-MS analysis resolved over 25 distinct components in the same region, successfully deconvoluting previously hidden peaks and creating a more definitive chemical fingerprint for evidence matching [1].
Automotive Paint and Tire Rubber Pyrolysis
Pyrolysis-GC-MS (Py-GC-MS) is a standard technique for analyzing non-volatile polymers like automotive paints and tire rubber. These materials yield pyrolysates with hundreds of components, leading to inevitable coelution. For instance, in automotive clear coat analysis, Py-GC-MS struggles to separate α-methylstyrene and n-butyl methacrylate. Using Py-GC×GC-MS, these previously coeluted compounds were fully resolved in the second dimension [1]. This enhanced separation power allows for more confident identification of material brands and sources, which is critical for hit-and-run investigations.
The Scientist's Toolkit: Essential Research Reagents & Materials
Table 2: Key Reagents and Materials for GC-MS and GC×GC-MS Metabolomics
| Item | Function in Protocol | Example from Literature |
|---|---|---|
| Methoxyamine Hydrochloride | Protects carbonyl groups (e.g., in sugars) during derivatization by forming methoximes. | Dissolved in pyridine (20 mg/mL) for the first derivatization step [11]. |
| MSTFA with 1% TMCS | Primary silylation reagent; replaces active hydrogens (e.g., in -OH, -COOH, -NH groups) with trimethylsilyl groups, increasing volatility. | Used in the second, 60-minute derivatization step at 70°C [11]. |
| Deuterated Internal Standards | Compounds with stable isotope labels used to correct for variability in extraction, derivatization, and instrument response. | Heptadecanoic acid and norleucine were used in serum metabolite extraction [11]. |
| Alkane Retention Index Standard | A mixture of straight-chain alkanes (e.g., C10-C40) analyzed to calculate retention indices for more confident metabolite identification. | Run at the beginning, middle, and end of sample sequences [11]. |
| GC×GC Modulator | The interface between the two columns; focuses and reinjects effluent as narrow pulses. Critical for achieving 2D separation. | Cryogenic (liquid nitrogen) modulators or newer, cryogen-free reverse flow modulators are used [51] [70]. |
The experimental data and case studies presented lead to a clear conclusion: GC×GC-MS, coupled with advanced spectral deconvolution, provides a demonstrably superior platform for the confident identification of compounds in complex forensic mixtures. The three-fold increase in detected and identified metabolites, coupled with significant signal-to-noise enhancements, directly translates to higher identification scores and greater confidence for the forensic scientist [11] [51]. While traditional GC-MS remains a robust and sufficient tool for many routine analyses, the added resolution and sensitivity of GC×GC-MS make it an indispensable technology for tackling the most challenging evidence, where the certainty of identification can have profound legal consequences.
In forensic science, the analysis of trace evidence presents a significant challenge due to the complexity of samples encountered at crime scenes. For decades, traditional one-dimensional gas chromatography-mass spectrometry (GC-MS) has been the established "gold standard" for the forensic analysis of such evidence, providing reliable separation and identification of components in mixtures [15]. However, the primary limitation of conventional GC-MS lies in the co-elution of compounds in highly complex mixtures, which can obscure minor components and complicate interpretation [15] [2]. Comprehensive two-dimensional gas chromatography-mass spectrometry (GC×GC-MS) represents a significant technological advancement that addresses this limitation by providing superior separation power through two independent separation mechanisms with different stationary phases [2].
This analytical comparison guide objectively evaluates both techniques within the context of forensic evidence analysis, focusing on their respective Technology Readiness Levels (TRL) and practical implementation in casework. The TRL framework, with levels from 1 to 4, categorizes the maturity of research applications, where GC-MS maintains a TRL of 4 (routine implementation) while GC×GC-MS generally ranges between TRL 2-3 (research to validation stages) for most forensic applications [2]. Through experimental data and detailed protocols, this analysis provides forensic researchers, scientists, and drug development professionals with a realistic assessment of both techniques' capabilities, limitations, and implementation considerations for analyzing adjudicated samples.
Technical Comparison: GC-MS versus GC×GC-MS
Fundamental Principles and Mechanisms
Traditional GC-MS operates on a single separation dimension, where compounds are separated based on their volatility and interaction with a single stationary phase before detection by mass spectrometry. This technique has proven versatile for analyzing a wide range of forensic samples without requiring substantial method development for each new sample [15].
GC×GC-MS enhances this approach through a two-dimensional system where two columns of different stationary phases are connected in series via a modulator. The modulator collects effluent from the first column at set intervals (typically 1-5 seconds) and injects it onto the second column for further separation via a different retention mechanism [2]. This configuration significantly increases peak capacity and provides a structured chromatographic "fingerprint" where chemically related compounds form recognizable patterns [15].
Table 1: Technical Configuration Comparison Between GC-MS and GC×GC-MS
| Parameter | Traditional GC-MS | GC×GC-MS |
|---|---|---|
| Separation Dimensions | One-dimensional | Two-dimensional |
| Separation Mechanism | Single stationary phase | Two orthogonal stationary phases |
| Modulator | Not applicable | Thermal or flow modulation |
| Peak Capacity | Limited (~100-400) | Significantly increased (~1000+) |
| Signal-to-Noise Ratio | Standard | Increased 5-10 fold |
| Data Representation | Chromatogram | Topographic plot |
| Commercial Configurations | Single system | Thermal modulation (TM), Deans switch (DS), differential flow modulation (DFM) |
Analytical Performance Metrics
The enhanced separation power of GC×GC-MS translates to measurable improvements in key analytical performance metrics, particularly for complex forensic samples where compound co-elution frequently occurs with traditional GC-MS.
Table 2: Performance Comparison for Forensic Evidence Analysis
| Performance Metric | Traditional GC-MS | GC×GC-MS | Application Evidence |
|---|---|---|---|
| Peak Capacity | Limited resolution for co-eluting compounds | 2-5x increase in detected components | Sexual lubricant analysis: 6+ components vs. 25+ [15] |
| Detection Sensitivity | Nanogram range for full scan | Picogram range capability | VOC analysis: 10x S/N improvement for target compounds [71] |
| Deconvolution Capability | Limited, requires software post-processing | Built-in physical separation | Automotive paint: resolution of α-methylstyrene & n-butyl methacrylate [15] |
| Analysis Time | 15-60 minutes typical | Comparable to slightly increased | Similar run times with enhanced information yield [2] |
| Pattern Recognition | Limited chromatographic patterns | Structured 2D fingerprint patterns | Oil hydrocarbon profiling showing homologous series [17] |
Experimental Protocols for Forensic Evidence Analysis
Sexual Lubricant Analysis Protocol
Background: Sexual assault cases increasingly involve condom usage by perpetrators, potentially eliminating biological DNA evidence. In approximately 30% of sexual assault kits, no probative DNA profiles are recovered, creating a need for alternative evidence such as lubricant analysis [15].
Sample Preparation:
- Extract suspected lubricant residues using hexane solvent extraction
- Concentrate extract under gentle nitrogen stream
- Reconstitute in appropriate injection solvent (e.g., 50 μL hexane)
GC-MS Analysis Parameters:
- Column: 30m × 0.25mm ID, 0.25μm film thickness standard non-polar column
- Injection: Split-splitless, 250°C
- Oven Program: 50°C (hold 2 min), ramp to 280°C at 10°C/min
- Mass Spectrometer: Quadrupole, electron ionization at 70eV
- Mass Range: 35-550 amu
GC×GC-MS Analysis Parameters:
- Primary Column: 30m × 0.25mm ID, 0.25μm non-polar phase (e.g., DB-5)
- Secondary Column: 1-2m × 0.1mm ID, 0.1μm polar phase (e.g., DB-17)
- Modulator: Thermal or differential flow modulation
- Oven Program: 50°C (hold 2 min), ramp to 280°C at 5°C/min
- Modulation Period: 4-6 seconds
- Mass Spectrometer: Time-of-flight (TOF) or quadrupole
Results Interpretation: Traditional GC-MS shows substantial co-elution between retention times of 7-20 minutes, while GC×GC-MS separates over 25 different components in the same timeframe, with isoparaffinic compounds and aldehydes forming distinct structured patterns in the 2D chromatographic space [15].
Automotive Paint Analysis Using Pyrolysis
Background: Automotive paint evidence is frequently encountered in hit-and-run accidents and vehicle-related crimes. Paint is a chemically complex, multi-layer system with pigments, additives, binders, and solvents that can provide valuable associative evidence [15].
Sample Preparation:
- Collect micro-sample (~50μg) of clear coat layer using microscalpel
- Place in quartz pyrolysis tube
Pyrolysis Parameters:
- Pyroprobe: CDS Analytical Pyroprobe 4000
- Temperature Program: 50°C for 2s, ramp to 750°C at 50°C/s, hold for 2s
GC×GC-MS Analysis Parameters:
- Primary Column: 30m × 0.25mm ID, 0.25μm DB-5
- Secondary Column: 1.5m × 0.1mm ID, 0.1μm mid-polar phase
- Modulator: Differential flow modulation
- Oven Program: 40°C (hold 2 min) to 300°C at 3°C/min
- Mass Spectrometer: Time-of-flight (TOF) for rapid acquisition
Results Interpretation: GC×GC-MS resolves critical co-elutions observed in traditional GC-MS, particularly distinguishing α-methylstyrene (11.776 min FDRT) and n-butyl methacrylate (11.600 min FDRT) that normally co-elute in the first dimension [15]. This improved separation enhances the discrimination of chemically similar paint samples.
Diesel Oil Source Attribution Protocol
Background: Diesel oil analysis is relevant for forensic investigations of fuel theft or environmental pollution cases. The chemical complexity of diesel, containing hundreds of components, makes source attribution challenging with traditional methods [17].
Sample Preparation:
- Obtain diesel sample (~10mg) from questioned source
- Dilute with 7mL dichloromethane
- Transfer to GC vial for analysis
GC-MS Analysis Parameters:
- System: Agilent 7890A GC with 5975C MSD
- Column: 30m HP-5MS UI (0.25mm ID, 0.25μm)
- Injection: 1μL, split mode (50:1)
- Oven: 40°C (2min) to 300°C at 6°C/min
- Mass Range: 50-550 amu
Machine Learning Integration:
- Approach: Convolutional Neural Network (CNN) for chromatographic data
- Training: 136 known-source diesel samples from Swedish gas stations/refineries
- Comparison: Benchmark models using peak height ratios (traditional approach)
- Output: Likelihood ratios for source attribution
Results Interpretation: The CNN-based model demonstrated superior performance with median likelihood ratios of approximately 1800 for same-source comparisons, significantly outperforming traditional benchmark models that yielded median LRs of 180 (score-based) and 3200 (feature-based) [17]. This demonstrates how GC-MS data combined with advanced machine learning enhances forensic evidential value.
Technology Readiness Level (TRL) Assessment
Forensic Application TRL Classification
The implementation of analytical techniques in forensic laboratories must meet rigorous standards for courtroom admissibility, including the Daubert Standard (U.S.) and Mohan Criteria (Canada), which emphasize testing, peer review, error rates, and general acceptance [2].
Table 3: TRL Assessment for GC-MS and GC×GC-MS in Forensic Applications
| Forensic Application | GC-MS TRL | GC×GC-MS TRL | Key Research Findings |
|---|---|---|---|
| Illicit Drug Analysis | 4 (Routine) | 3 (Validation) | GC×GC-MS improves NPS isomer separation [59] [2] |
| Fire Debris & ILR | 4 (Routine) | 3 (Validation) | Enhanced chemical fingerprinting for ignitable liquids [2] |
| Lubricant & Condom Evidence | 3 (Validation) | 2 (Research) | 25+ components vs. 6+ with traditional GC-MS [15] |
| Explosives & HME | 4 (Routine) | 2 (Research) | Improved detection of precursor chemicals [4] |
| Paint & Polymer Pyrolysis | 4 (Routine) | 2 (Research) | Resolution of co-eluting polymer markers [15] |
| Fingerprint Aging | 2 (Research) | 2 (Research) | Chemical timing models from lipid degradation [59] |
| Decomposition Odor | 2 (Research) | 2 (Research) | VOC profiling for post-mortem interval estimation [59] |
Legal Admissibility Considerations
For courtroom evidence, analytical methods must satisfy specific legal standards that vary by jurisdiction. In the United States, the Daubert Standard requires that techniques be tested, peer-reviewed, have known error rates, and enjoy general acceptance in the scientific community [2]. The Frye Standard emphasizes "general acceptance" in the relevant scientific community, while Federal Rule of Evidence 702 requires that expert testimony be based on sufficient facts/reliable principles [2]. In Canada, the Mohan Criteria focus on relevance, necessity, absence of exclusionary rules, and properly qualified experts [2].
Traditional GC-MS meets these criteria across most forensic applications, having been extensively validated through decades of use. GC×GC-MS currently faces greater scrutiny due to its more recent introduction and need for comprehensive validation studies, though research demonstrates its technical superiority for complex evidence [2].
The Scientist's Toolkit: Essential Research Reagents and Materials
Table 4: Essential Materials for GC×GC-MS Forensic Method Development
| Item | Function | Application Examples |
|---|---|---|
| Dual-Column Sets | Orthogonal separation mechanisms | Non-polar/polar combinations (DB-5/DB-17) [15] |
| Modulation System | Transfer between chromatographic dimensions | Thermal or flow modulators [15] [2] |
| Time-of-Flight MS | Rapid spectral acquisition for narrow peaks | Decomposition odor profiling, paint analysis [59] |
| Pyrolysis Probe | Thermal decomposition of solid samples | Automotive paint, tire rubber, polymer analysis [15] |
| Chemometrics Software | Multivariate data analysis | PCA, LDA for explosive classification [4] |
| Reference Libraries | Compound identification | Custom forensic libraries (lubricants, paints, oils) [15] |
| Hexane & Dichloromethane | Solvent extraction | Lubricant, oil, and fire debris analysis [15] [17] |
The correlation analysis between traditional GC-MS and GC×GC-MS for adjudicated forensic samples demonstrates a clear trajectory in analytical chemistry. While traditional GC-MS maintains its position as the court-accepted "gold standard" with Technology Readiness Level 4 across most forensic applications, GC×GC-MS offers demonstrable technical advantages for the most complex evidence types [2].
The implementation decision between these techniques involves balancing analytical performance against practical considerations. Traditional GC-MS provides established protocols, known error rates, and courtroom acceptance, while GC×GC-MS offers enhanced separation power and sensitivity for challenging samples where conventional methods reach their limitations [15] [2]. For forensic laboratories dealing with complex evidence such as sexual lubricants, automotive paints, and explosive residues, GC×GC-MS represents a valuable advanced tool that can provide investigative leads when traditional methods prove insufficient.
Future directions should focus on standardized validation protocols, inter-laboratory studies, and error rate determination for GC×GC-MS to facilitate its transition from research to routine casework. The integration of machine learning algorithms with GC×GC-MS data, as demonstrated in diesel oil attribution studies, presents a particularly promising pathway to enhance both the efficiency and evidential value of forensic chemical analysis [17]. As these advanced methodologies mature and accumulate the necessary legal foundation, they will undoubtedly expand the capabilities of forensic science to address increasingly complex evidentiary materials.
Conclusion
The comparative TRL analysis clearly positions GC×GC-MS as a technologically superior and highly mature solution for the analysis of complex forensic evidence, representing a significant advancement beyond traditional GC-MS. While GC-MS remains a robust and essential tool for many routine analyses, its limitations in resolving power and sensitivity for intricate mixtures are decisively overcome by the comprehensive two-dimensional approach. GC×GC-MS delivers enhanced separation, reduced coelution, and the ability to detect minor components, thereby providing a more informative chromatographic 'fingerprint.' For forensic researchers and professionals, the adoption of GC×GC-MS translates to higher confidence in identification, the potential to solve previously intractable cases, and a powerful new capability for non-targeted screening. Future directions should focus on standardizing methods, expanding forensic-specific spectral libraries, and developing intelligent data analysis tools to fully integrate this powerful technology into the mainstream of forensic science, ultimately strengthening the scientific foundation of evidence presented in the judicial system.
References
- 1. GC×GC–MS for Forensic Analysis [https://www.spectroscopyonline.com/view/gc-gc-ms-forensic-analysis-1]
- 2. Are We Ready for It? A Review of Forensic Applications and ... [https://pmc.ncbi.nlm.nih.gov/articles/PMC12012292/]
- 3. Rapid GC-MS method for screening seized drugs in ... [https://www.frontiersin.org/journals/chemistry/articles/10.3389/fchem.2025.1559279/full]
- 4. A Review of Analytical and Chemometric Strategies for ... [https://pubmed.ncbi.nlm.nih.gov/40242023/]
- 5. Flying High with Sensitivity and Selectivity: GC–MS to ... [https://www.chromatographyonline.com/view/flying-high-with-sensitivity-and-selectivity-gc-ms-to-gc-ms-ms]
- 6. A Novel and Validated GC-MS/MS Method for the ... [https://www.mdpi.com/1420-3049/30/22/4478]
- 7. GC×GC–MS for Forensic Analysis [https://www.chromatographyonline.com/view/gc-gc-ms-forensic-analysis]
- 8. Spotting isomer mixtures in forensic illicit drug casework ... [https://www.sciencedirect.com/science/article/pii/S1570023221001550]
- 9. Capabilities and limitations of GC–MS and LC-MS/MS for ... [https://www.sciencedirect.com/science/article/abs/pii/S2468170923000073]
- 10. Comparison of swab types & elution buffers for collection ... [https://pubmed.ncbi.nlm.nih.gov/36087371/]
- 11. Comparison of GC-MS and GC×GC-MS in the Analysis ... [https://pmc.ncbi.nlm.nih.gov/articles/PMC4849136/]
- 12. Why is Using GC-MS More Advantageous than GC-FID? [https://monadlabtech.com/blogs/why-is-using-gc-ms-more-advantageous-than-gc-fid]
- 13. Gas Chromatography Mass Spectrometry - an overview [https://www.sciencedirect.com/topics/earth-and-planetary-sciences/gas-chromatography-mass-spectrometry]
- 14. Comparison of the quantification performance of thermal ... [https://link.springer.com/article/10.1007/s00216-025-05933-w]
- 15. GC×GC–MS for Forensic Analysis [https://www.chromatographyonline.com/view/gc-gc-ms-forensic-analysis-0]
- 16. Decoding Fingerprint Aging: Leveraging GC×GC–TOF-MS ... [https://www.chromatographyonline.com/view/decoding-fingerprint-aging-leveraging-gc-gc-tof-ms-for-forensic-chemical-profiling]
- 17. Comparing a machine learning approach with traditional ... [https://www.sciencedirect.com/science/article/abs/pii/S246817092500061X]
- 18. GC-MS Screening Data for Instrument Optimization - Catalog [https://catalog.data.gov/dataset/gc-ms-screening-data-for-instrument-optimization]
- 19. Distinguishing sexual lubricants from personal hygiene ... [https://www.sciencedirect.com/science/article/abs/pii/S2468170917300413]
- 20. Comparison of GC–MS, GC–MRM-MS, and ... [https://www.sciencedirect.com/science/article/abs/pii/S0016703712001858]
- 21. How NIST Resources Can Help Crime Labs Work Faster [https://www.nist.gov/blogs/taking-measure/speeding-wheels-justice-how-nist-resources-can-help-crime-labs-work-faster]
- 22. GC-MS Calibration Comparison: Standard vs Advanced ... [https://eureka.patsnap.com/report-gc-ms-calibration-comparison-standard-vs-advanced-models]
- 23. A comparison of pyrolysis–gas chromatography–mass ... [https://www.sciencedirect.com/science/article/abs/pii/S0003267005002758]
- 24. Pyrolysis-gas chromatography/mass spectrometry analysis ... [https://pubmed.ncbi.nlm.nih.gov/17931635/]
- 25. Tire Classification by Elemental Signatures Using Laser- ... [https://pubmed.ncbi.nlm.nih.gov/33543647/]
- 26. Validation of a rapid GC–MS method for forensic seized ... [https://www.sciencedirect.com/science/article/abs/pii/S2468170924000614]
- 27. Validation of a Rapid GC-MS Method for Forensic Seized ... [https://www.nist.gov/publications/validation-rapid-gc-ms-method-forensic-seized-drug-screening-applications]
- 28. Footwear & Tire Track Examination: How It's Done [https://www.forensicsciencesimplified.org/fwtt/how.html]
- 29. Clinical value of analytical testing in patients presenting ... [https://pmc.ncbi.nlm.nih.gov/articles/PMC7080633/]
- 30. A Framework for the Development of Targeted Gas ... [https://pmc.ncbi.nlm.nih.gov/articles/PMC10010759/]
- 31. Screening unknown novel psychoactive substances using ... [https://www.sciencedirect.com/science/article/abs/pii/S2468170923000358]
- 32. Instrument Performance Standards: How to Test GC–MS ... [https://www.chromatographyonline.com/view/instrument-performance-standards-how-test-gc-ms-sensitivity-and-performance-quickly-and-efficiently]
- 33. Advancements in Gas Chromatography Column Technology [https://www.phenomenex.com/knowledge-center/gc-knowledge-center/advancements-in-gc-column-technology-trends-outlook?srsltid=AfmBOooxBbAZH5Zm1H76cE5NanKdUotrEmJq3EUi5XccOeyGNYJZ4gEt]
- 34. Understanding GC - MS : A Powerful Analytical Tool in... - MetwareBio [https://www.metwarebio.com/gc-ms-principles-applications/]
- 35. Researchers Explore Gas Chromatography to Improve ... [https://www.chromatographyonline.com/view/researchers-explore-gas-chromatography-to-improve-forensic-ink-analysis]
- 36. Gas Chromatography (GC) and Gas ... [https://www.24chemicalresearch.com/reports/289264/chromatography-gas-chromatography-mass-spectrometry-market]
- 37. Latest News on Mass Specs – February 2025 [https://www.phenomenex.com/news/news/2025/02/mass-specs?srsltid=AfmBOopFetAhQybO9Bd3qBi-xDGUGFBXERkb9B2bzV4dMQVqRAYxp_mA]
- 38. Gas Chromatography Mass Spectrometry (GC-MS) | Analysis [https://scioninstruments.com/us/blog/gas-chromatography-mass-spectrometry-gc-ms/]
- 39. Why GC-MS is Ideal for Real-Time Process Gas Analysis [https://www.jeolusa.com/NEWS-EVENTS/Blog/why-gc-ms-is-ideal-for-real-time-process-gas-analysis]
- 40. Comprehensive two-dimensional gas chromatography with ... [https://pmc.ncbi.nlm.nih.gov/articles/PMC10149472/]
- 41. Guide to GC Column Selection and Optimizing Separations [https://www.restek.com/articles/guide-to-gc-column-selection-and-optimizing-separations?srsltid=AfmBOoqdylFpHvOyTh0kdT8p_poFzhF-l4RDo_p8AC5nGlG_rvtQAxJF]
- 42. Multivariate Design of Experiments for Gas ... [https://www.chromatographyonline.com/view/multivariate-design-of-experiments-for-gas-chromatographic-analysis]
- 43. the Chemical Profiles of Plant-Based and Comparing ... Traditional [https://www.chromatographyonline.com/view/comparing-the-chemical-profiles-of-plant-based-and-traditional-meats-using-gc-ms-based-metabolomics]
- 44. A GC - × method based on solid-state modulator for non-targeted... GC MS [https://pubmed.ncbi.nlm.nih.gov/38428247/]
- 45. How Is Gas Chromatography Used in Forensics? A ... [https://www.pgeneral.com/news/how-is-gas-chromatography-used-in-forensics-a-powerful-tool-for-criminal-investigation/]
- 46. The Beginner's Guide to Interpreting GC/MS Results [https://www.innovatechlabs.com/newsroom/1841/how-to-interpret-gas-chromatography-mass-spectrometry-results/]
- 47. Analysis results of GC [https://www.shimadzu.com/an/service-support/technical-support/analysis-basics/fundamentals/results.html]
- 48. Fundamentals of Benchtop GC–MS Data Analysis and ... [https://www.chromatographyonline.com/view/fundamentals-of-benchtop-gc-ms-data-analysis-and-terminology]
- 49. Matrix Effects in GC–MS Profiling of Common Metabolites ... [https://pmc.ncbi.nlm.nih.gov/articles/PMC10053008/]
- 50. - GC Principle, Instrument and Analyses and... | Technology Networks MS [https://www.technologynetworks.com/analysis/articles/gc-ms-principle-instrument-and-analyses-and-gc-msms-362513]
- 51. Sensitivity of Comprehensive Two-dimensional Gas ... [https://www.chromatographyonline.com/view/sensitivity-comprehensive-two-dimensional-gas-chromatography-gcxgc-versus-one-dimensional-gas-chroma]
- 52. Automated filtering scripts based on accurate mass applied ... [https://www.sciencedirect.com/science/article/pii/S2772391722000378]
- 53. Important Considerations Regarding Matrix Effects When ... [https://www.chromatographyonline.com/view/important-considerations-regarding-matrix-effects-when-developing-reliable-analytical-residue-method]
- 54. Low-Resolution or High-Resolution Mass Spectrometry for ... [https://www.chromatographyonline.com/view/low-resolution-or-high-resolution-mass-spectrometry-for-clinical-and-forensic-toxicology-some-considerations-from-two-real-cases]
- 55. Observation of chromatographic differences by non- ... [https://www.sciencedirect.com/science/article/abs/pii/S2468170924000729]
- 56. EAS Award Winner Nicholas Snow Highlights Key Trends ... [https://www.chromatographyonline.com/view/gas-chromatography-trends-2025-nicholas-snow]
- 57. How GCxGC Increases Routine Laboratory Performance [https://www.azom.com/article.aspx?ArticleID=16323]
- 58. A comparison between mobile and stationary gas ... [https://link.springer.com/article/10.1007/s00216-022-04391-y]
- 59. Forensic Perspectives on Gas Chromatography [https://www.chromatographyonline.com/view/forensic-perspectives-on-gas-chromatography]
- 60. Detection Limits By GC/MS/MS in SIM And MRM - Blogs [https://www.alwsci.com/news/detection-limits-by-gc-ms-ms-in-sim-and-mrm-85210153.html]
- 61. GC-MS vs. GC-MS/MS: Key Differences Explained [https://www.hplcvials.com/faq/gc-ms-vs-gc-ms-ms-key-differences-explained.html]
- 62. A comparison between mobile and stationary gas ... [https://pmc.ncbi.nlm.nih.gov/articles/PMC9672629/]
- 63. Validation of a direct injection-GC-MS method for the ... [https://pubmed.ncbi.nlm.nih.gov/41160356/]
- 64. SWGDRUG Approved Recommendations [https://www.swgdrug.org/approved.htm]
- 65. SWGDRUG Home Page [https://www.swgdrug.org/]
- 66. International Standards on Drug Use Prevention [https://www.unodc.org/unodc/en/prevention/prevention-standards.html]
- 67. Rapid GC-MS as a Screening Tool for Forensic Fire Debris ... [https://pmc.ncbi.nlm.nih.gov/articles/PMC9888146/]
- 68. Spectral Deconvolution for Gas Chromatography Mass ... [https://pmc.ncbi.nlm.nih.gov/articles/PMC3962095/]
- 69. GCxGC-Analyzer – True Deconvolution [https://spectrometrics.com/product/gcxgc-analyzer-true-deconvolution/]
- 70. Advancing GCxGC for Jet Fuel Testing: Behind the Development of ASTM D8396 | Separation Science [https://www.sepscience.com/advancing-gcxgc-for-jet-fuel-testing-behind-the-development-of-astm-d8396-12103]
- 71. Recent Improvements in Benchtop GC–MS [https://www.spectroscopyonline.com/view/recent-improvements-benchtop-gc-ms-0]