Capillary Electrophoresis in Forensic Science: Advanced Analysis of Ballpoint Pen Inks
This article provides a comprehensive examination of capillary electrophoresis (CE) as a powerful analytical tool for the forensic analysis of ballpoint pen inks.
Capillary Electrophoresis in Forensic Science: Advanced Analysis of Ballpoint Pen Inks
Abstract
This article provides a comprehensive examination of capillary electrophoresis (CE) as a powerful analytical tool for the forensic analysis of ballpoint pen inks. Tailored for researchers and forensic scientists, it explores the foundational principles of CE, detailing its superior separation capabilities for ink dyes and additives compared to traditional methods like thin-layer chromatography. The scope covers methodological workflows, from sample preparation to data interpretation, addresses common troubleshooting and optimization challenges, and validates CE's performance against other spectroscopic and chromatographic techniques. By synthesizing current research and applications, this article serves as a critical resource for advancing the scientific rigor of questioned document examination.
Principles and Power of Capillary Electrophoresis in Ink Analysis
Capillary Electrophoresis (CE) is a powerful analytical technique that separates ions based on their electrophoretic mobility in a buffer-filled capillary under the influence of an applied electric field [1]. This technique boasts high separation efficiency, resolution, and speed, making it a valuable tool in forensic science, particularly for the analysis of complex mixtures such as ballpoint pen inks [2] [1]. In a forensic context, the ability to differentiate between seemingly similar ink formulations is crucial for document examination and authentication. The separation is driven by the differential migration of charged species, a process governed by the core principles of electrophoretic mobility and electroosmotic flow.
Core Principles of Separation
Electrophoretic Mobility
Electrophoretic mobility (μep) is the fundamental parameter that determines the velocity (v) of an ion in an electric field (E). The relationship is defined as: v = μep × E
The electrophoretic mobility of an ion is directly proportional to its charge (q) and inversely proportional to the friction it experiences, which is often related to its size (Stokes' radius, r) and the viscosity (η) of the medium. This is represented by: μ_ep = q / (6π η r)
In practical terms, this means:
- High Charge & Small Size: Ions with a high charge-to-size ratio migrate rapidly toward the electrode of opposite charge.
- Low Charge & Large Size: Ions with a low charge-to-size ratio migrate more slowly. This differential migration is the primary mechanism for separating charged molecules, such as the dyes and additives found in ballpoint pen inks [2].
Electroosmotic Flow (EOF)
Electroosmotic Flow (EOF) is the bulk flow of the entire buffer solution within the capillary when an electric field is applied. In a fused silica capillary, the inner wall contains ionizable silanol groups that become negatively charged above approximately pH 2. These negative charges attract a layer of positive ions from the buffer, forming an electrical double layer. When voltage is applied, these positively charged ions migrate toward the cathode, dragging the entire solution with them through viscous forces. The EOF is often the dominant force in CE separations, typically carrying all analytes—regardless of their own charge—toward the detector. The velocity of the EOF is generally greater than the electrophoretic mobility of most ions, allowing for the simultaneous analysis of cations, neutrals, and anions in a single run.
Net Mobility and Separation
The observed velocity of an analyte is the vector sum of its electrophoretic mobility and the electroosmotic flow. The net mobility (μnet) is given by: μnet = μep + μEOF
The separation of analytes occurs because each unique ion has a distinct electrophoretic mobility. The combination of these mobilities with the EOF results in different migration times, which are detected and recorded as peaks in an electropherogram.
Table 1: Factors Influencing Electrophoretic Mobility and Separation Efficiency
| Factor | Impact on Separation | Forensic Application Consideration |
|---|---|---|
| Buffer pH | Determines the ionization state of analytes and capillary wall; controls EOF and analyte charge. | Must be optimized to ensure dye ions are charged and separable [1]. |
| Buffer Ionic Strength | Affects EOF, Joule heating (temperature increase), and analyte mobility. | High ionic strength can improve separation but may cause excessive heating [1]. |
| Applied Voltage | Higher voltages reduce analysis time but can generate heat, leading to band broadening. | A balance between speed and separation quality must be found [2]. |
| Capillary Dimensions | Smaller internal diameters dissipate heat more effectively, improving efficiency. | Standard capillaries of 50 μm i.d. are often used [1]. |
| Temperature | Affects buffer viscosity and analyte mobility; must be controlled for reproducibility. | Instrument thermostating is critical for reliable, comparable results [1]. |
CE Experimental Protocol for Ink Analysis
The following protocol is adapted from general CE principles and specific forensic applications for analyzing blue ballpoint pen inks [2] [1].
Materials and Reagents
- Capillary Electrophoresis Instrument: An automated CE system capable of UV-Vis or photodiode array (PDA) detection.
- Capillary: Fused silica capillary, 50 μm internal diameter (i.d.), with a total length of 40-60 cm.
- Background Electrolyte (BGE): 1 M Sodium borate buffer, pH adjusted to the desired level (e.g., pH 9.0-9.5 is common for ink analysis).
- Samples: Extracts from blue ballpoint pen ink on questioned documents.
- Standards: Known ink samples for method validation and library creation.
Procedure
Step 1: Preparation of the Electrolyte Solution
- Weigh the appropriate amount of sodium borate and dissolve it in distilled water.
- Adjust the pH to the target value using a dilute solution of HCl or NaOH.
- Filter the solution through a 0.45 μm membrane filter and degas it under vacuum for 10-15 minutes to remove dissolved air [1].
Step 2: Capillary Conditioning
- Flush a new capillary with 0.1 M NaOH for 30 minutes to activate the silanol groups and ensure a stable EOF.
- Rinse the capillary with distilled water for 10 minutes.
- Rinse with 0.1 M HCl for 10 minutes, followed by distilled water again for 10 minutes.
- Finally, equilibrate the capillary with the BGE by flushing for 10-15 minutes before the first analysis [1].
Step 3: Sample Preparation
- A small section of the inked paper is excised.
- The ink is extracted using a minimal volume of a suitable solvent (e.g., ethanol or DMSO).
- The extract is centrifuged at 10,000 g for 5 minutes to remove any insoluble material, such as paper fibers [1].
Step 4: Instrument Operation and Data Acquisition
- Introduce the sample into the capillary via hydrodynamic injection (e.g., pressure injection for 5-10 seconds).
- Apply a constant voltage (e.g., 8-30 kV) across the capillary for separation.
- Detect the separated ink components at the outlet end using a UV-Vis or PDA detector. Monitoring multiple wavelengths is advantageous for obtaining UV-Vis spectra for each peak [2].
- Record the electropherogram (a plot of detector response versus migration time).
Step 5: Data Analysis
- Identify ink components based on their migration times compared to standards and their UV-Vis spectra.
- The area under each peak can be used for quantitative analysis.
- For forensic discrimination, the combination of peak presence/absence, migration times, and spectral data from the PDA detector is used to differentiate between inks from different manufacturers [2].
Research Reagent Solutions and Materials
Table 2: Essential Materials for Capillary Electrophoresis
| Item | Function / Explanation |
|---|---|
| Fused Silica Capillary | The separation channel where electrophoretic migration occurs. Its inner wall chemistry generates the electroosmotic flow. |
| Background Electrolyte (BGE) | A conductive buffer solution that carries the current and defines the separation environment (pH, ionic strength). |
| Sodium Hydroxide (0.1 M & 1 M) | Used for capillary conditioning to activate silanol groups and ensure a stable, reproducible electroosmotic flow [1]. |
| Hydrochloric Acid (0.1 M) | Used in capillary conditioning cycles to rinse and clean the capillary surface [1]. |
| Organic Solvents (e.g., Ethanol) | Used for the extraction of ink components from paper substrates in forensic sample preparation [2]. |
| Standard Marker Solutions | Used to calibrate the system, verify separation performance, and calculate migration times [1]. |
Workflow and Signaling Pathways
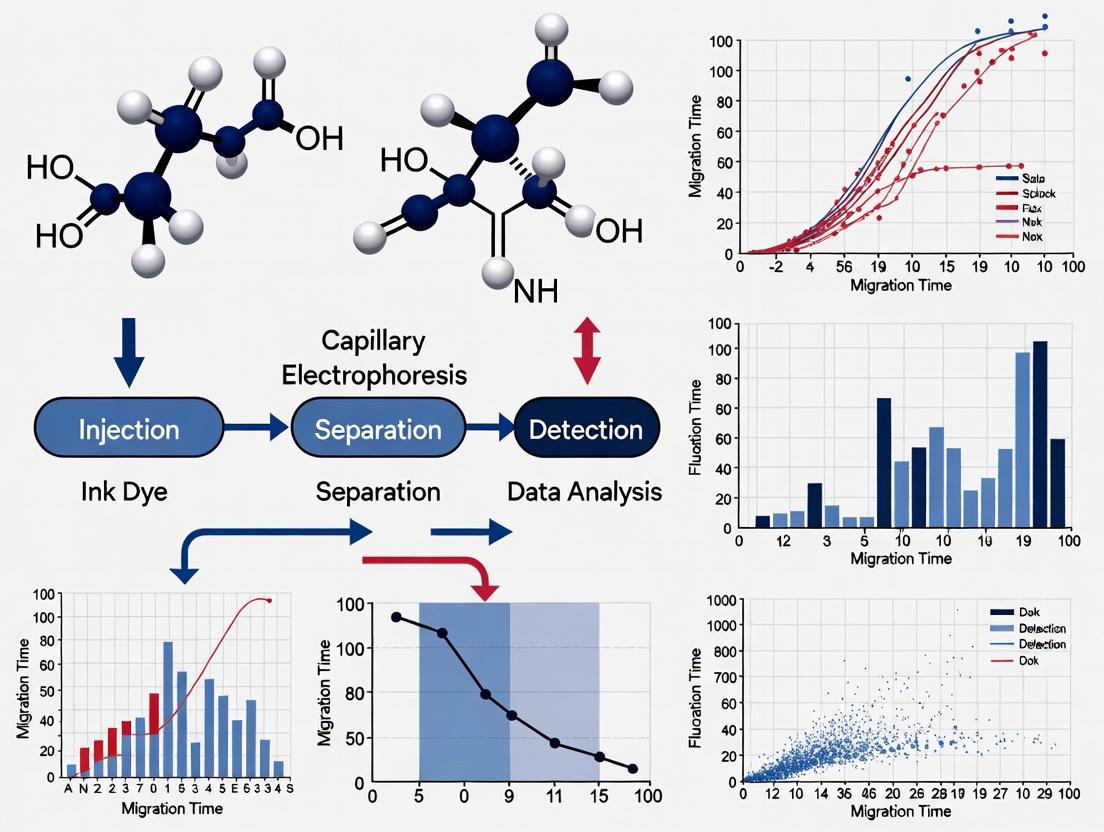
The following diagram illustrates the logical workflow of a CE analysis, from sample introduction to data interpretation, specifically contextualized for forensic ink analysis.
CE Forensic Ink Analysis Workflow
Forensic Application and Quantitative Data
In a key forensic study, CE successfully differentiated 10 different blue ballpoint pen inks extracted from mock forensic samples [2]. The identification of just five components (dyes and additives) was sufficient to distinguish the inks. The use of a photodiode array detector was crucial, as it provided ultraviolet-visible spectra for each separated component. This spectral data, combined with migration time, creates a powerful fingerprint for each ink, enabling the development of searchable, automated libraries—a significant advantage over traditional techniques like thin-layer chromatography (TLC) [2].
Table 3: Advantages of CE over TLC for Forensic Ink Analysis
| Feature | Capillary Electrophoresis | Thin-Layer Chromatography |
|---|---|---|
| Automation | Fully automated; high reproducibility [2]. | Manual spotting; difficult to reproduce [2]. |
| Sensitivity | High sensitivity with low sample consumption [1]. | Less sensitive; faint spots can be difficult to visualize [2]. |
| Data Output | Electronic data (electropherogram & UV-Vis spectra) for searchable libraries [2]. | Physical plate; requires controlled storage; no inherent spectral data [2]. |
| Resolution | High separation efficiency; can resolve components with similar properties [2] [1]. | Can result in unresolved spots for similar dyes, requiring multiple runs [2]. |
| Analysis Time | Rapid method development and fast separations (minutes) [2] [1]. | Time-consuming, especially if multiple solvent systems are needed [2]. |
Why CE for Inks? Analyzing Complex Mixtures of Dyes, Solvents, and Additives
The forensic analysis of ballpoint pen inks presents a significant challenge due to the complex chemical nature of ink formulations. These mixtures typically contain dyes, solvents, resins, and various additives that require high-resolution separation techniques for proper characterization [3]. Capillary Electrophoresis (CE) has emerged as a powerful analytical tool in forensic science, offering distinct advantages for the analysis of ink components found in questioned documents [4] [5]. The technique's ability to handle minute sample volumes—often in the picoliter range—makes it uniquely suited for forensic applications where evidence is often limited and must be preserved for future analysis [4] [6].
The fundamental principle of CE involves the separation of charged molecules within a narrow capillary under the influence of an applied electric field. The differential migration rates of analytes based on their size-to-charge ratio enables high-resolution separation of complex mixtures [4] [5]. For ink analysis, this capability is crucial for distinguishing between chemically similar dyes and additives that may originate from different pen sources or production batches. The versatility of CE instrumentation allows multiple separation modes to be employed with the same basic hardware, simply by changing the buffer composition and capillary type [5]. This flexibility enables forensic scientists to tailor analytical methods to specific ink components, from charged dye molecules to neutral additives.
Key Separation Modes in Capillary Electrophoresis
The analytical power of CE stems from its multiple operational modes, each exploiting different physicochemical properties for separation. The table below summarizes the primary CE modes applicable to ink analysis:
Table 1: Capillary Electrophoresis Modes for Ink Analysis
| CE Mode | Separation Mechanism | Ink Components Analyzed | Key Advantages |
|---|---|---|---|
| Capillary Zone Electrophoresis (CZE) | Differential electrophoretic mobility of ions in a homogeneous buffer [4] | Charged dye components [6] | Simple implementation; effective for ionic species [4] |
| Micellar Electrokinetic Chromatography (MEKC) | Partitioning between aqueous buffer and micellar pseudo-stationary phase [4] [5] | Neutral dyes, solvents, and additives [4] | Extends CE utility to neutral compounds [4] |
| Capillary Electrochromatography (CEC) | Combines electrophoretic mobility with chromatographic partitioning using a packed capillary [4] | Complex mixtures of dyes and additives [4] | Enhanced selectivity for challenging separations [4] |
The application of MEKC is particularly valuable for ink analysis, as many dye components and additives are neutral molecules that would not separate using standard CZE. MEKC incorporates surfactant molecules (such as sodium dodecyl sulfate) into the buffer above their critical micelle concentration, forming a pseudo-stationary phase that enables separation based on hydrophobicity in addition to charge [4]. This mode effectively combines electrophoretic and chromatographic separation mechanisms, making it ideal for the comprehensive analysis of ink formulations containing both charged and neutral components.
Experimental Protocols for Ink Analysis
Direct Sampling Method for Ballpoint Pen Inks
A novel direct sampling technique has been developed that enables analysis of ballpoint pen inks directly from paper substrates without extensive sample pretreatment [6]. This protocol significantly reduces analysis time and minimizes destructive impact on evidence, a critical consideration in forensic document examination.
Materials and Reagents:
- Background electrolyte (BGE): Optimized buffer conditions for separation of cationic and anionic dyes [6]
- Fused-silica capillary: Standard dimensions 50-75 μm internal diameter, 30-60 cm effective length
- Ballpoint pen ink samples on paper substrate
- Double-sided tape for sample mounting
- Universal plastic vials and lids for CE instrument
Procedure:
- Using a hole puncher or similar tool, extract a small section (approximately 0.9 mm diameter) of the inked paper [6] [3]
- Affix the paper sample to a custom sampling device using double-sided tape
- Position the sampling device in the CE autosampler
- Program the instrument to deposit minimal amounts of BGE directly onto the inked paper segment
- Inject the extracted dyes directly into the capillary without pre-extraction or centrifugation steps
- Perform electrophoretic separation under optimized conditions for the target ink components
- Detect separated components using absorbance detection, typically in the UV-visible range [6]
This direct approach eliminates time-consuming extraction, centrifugation, and sample transfer steps required in conventional methods, reducing total analysis time while maintaining analytical performance [6]. The minimal consumption of the evidence sample (only a very small section of the writing is required) makes this protocol particularly valuable for forensic casework where document preservation is crucial.
Conventional Extraction-Based Protocol
For comprehensive analysis of all ink components, including those not efficiently extracted by the direct method, a conventional extraction-based protocol may be employed.
Materials and Reagents:
- Extraction solvents: Methanol, ethanol, acetonitrile, or optimized solvent mixtures [6]
- Background electrolyte: Optimized buffer for targeted separation mode (CZE or MEKC)
- Fused-silica capillary with appropriate dimensions for separation
- Microcentrifuge vials and centrifuge
- Ultrasonic bath for enhanced extraction
Procedure:
- Punch out a small section (1-2 mm diameter) of the inked paper using a hypodermic needle tip or similar tool [3]
- Place the paper sample in a microcentrifuge vial with appropriate extraction solvent (typically 50-100 μL)
- Sonicate the sample for 5-15 minutes to enhance extraction efficiency
- Centrifuge the sample to separate insoluble paper debris from the extracted ink solution
- Transfer the supernatant to an CE injection vial
- Inject into the CE system using hydrodynamic or electrokinetic injection
- Perform separation under optimized conditions for target analytes
- Detect using appropriate detection method (UV-Vis, DAD, or LIF for fluorescent components)
This traditional approach, while more destructive and time-consuming than direct sampling, may provide more complete extraction of certain ink components, particularly those with strong affinity for the paper substrate [6].
Research Reagent Solutions and Essential Materials
Successful implementation of CE for ink analysis requires specific reagents and materials optimized for the separation of ink components. The following table details key research reagents and their functions:
Table 2: Essential Research Reagents for CE Ink Analysis
| Reagent/Material | Function | Application Notes |
|---|---|---|
| Fused-silica capillaries | Separation channel for electrophoretic migration | Standard dimensions: 50-75 μm ID, 30-60 cm length; may require coating for certain applications [5] |
| Surfactants (SDS) | Forms micelles for MEKC of neutral components | Enables separation of neutral dyes and additives [4] |
| Buffer components | Maintains pH and ionic strength | Specific composition depends on separation mode; common buffers include borate, phosphate [6] |
| Linear polymer matrices | Acts as sieving medium for size-based separation | Used for complex dye mixtures with similar charges but different sizes [4] |
| Organic modifiers | Modifies separation selectivity | Acetonitrile, methanol added to buffer to adjust resolution of complex dye mixtures [6] |
The selection of appropriate buffer systems is critical for achieving optimal separation of ink components. Previous research has optimized buffer conditions specifically for the separation of cationic and anionic dyes found in ballpoint pen inks [6]. The use of diode array detection (DAD) further enhances method versatility by enabling simultaneous detection at multiple wavelengths, which is particularly valuable for dye mixtures with different absorbance maxima.
Workflow and Signaling Pathways
The analytical workflow for CE-based ink analysis involves several critical steps from sample preparation to data interpretation. The following diagram illustrates the complete process:
CE-Based Forensic Ink Analysis Workflow
This workflow highlights the two primary sampling approaches (direct and extraction-based) and the alternative separation modes (CZE and MEKC) that can be employed based on the specific analytical requirements. The detection phase typically employs UV-Vis or diode array detection (DAD) to capture spectral information of the separated components, which aids in compound identification [6]. The final stages involve pattern recognition and comparison against reference databases to establish links between questioned documents and potential source materials.
Advantages of CE for Forensic Ink Analysis
The implementation of CE in forensic ink analysis provides several distinct advantages over traditional analytical techniques:
Minimal Sample Consumption: CE's ability to analyze minute sample volumes (often in the nanoliter to picoliter range) makes it ideally suited for forensic evidence where sample preservation is crucial [4] [6]. The direct sampling method further enhances this advantage by eliminating the need for destructive extraction processes [6].
High Separation Efficiency: The narrow capillaries and high electric fields used in CE result in superior separation efficiency compared to traditional slab gel methods or many chromatographic techniques [4] [7]. This high resolution is particularly valuable for distinguishing between chemically similar dyes that may be present in ink formulations from different manufacturers.
Method Flexibility: The ability to employ multiple separation modes (CZE, MEKC, CEC) with the same instrumental setup provides exceptional flexibility for method development [4] [5]. Forensic analysts can tailor the separation mechanism to the specific ink components of interest simply by changing the buffer composition and capillary type.
Low Operational Costs: CE consumes minimal volumes of buffers and reagents during analysis, resulting in reduced operational costs compared to techniques such as HPLC or GC-MS [6] [5]. The minimal waste production also makes CE an environmentally favorable option.
Quantitative Capabilities: Unlike many qualitative ink analysis techniques, CE provides quantitative data on the relative amounts of different components in ink mixtures [7]. This information can be valuable for establishing manufacturing batch variations or tracking formulation changes over time.
These advantages position CE as a powerful tool in the forensic analysis of questioned documents, particularly when combined with the novel direct sampling approach that addresses the unique constraints of evidentiary materials.
The forensic analysis of questioned documents presents significant analytical challenges, particularly when characterizing the chemical composition of ballpoint pen inks. For decades, thin-layer chromatography (TLC) has served as the traditional method for these analyses. However, capillary electrophoresis (CE) has emerged as a superior analytical technique that addresses multiple limitations inherent to TLC methodologies. CE provides forensic scientists with enhanced capabilities for separating and identifying ink components through highly efficient, automated processes that yield both qualitative and quantitative data. This application note details the specific advantages of CE over TLC and provides established experimental protocols for implementing CE in forensic ink analysis workflows, focusing specifically on black ballpoint pen inks as a model system.
Comparative Advantages of CE Over TLC
Capillary electrophoresis demonstrates clear and documentable improvements over thin-layer chromatography across multiple performance parameters essential for forensic validation. The table below summarizes the key advantages quantified through forensic applications.
Table 1: Quantitative Comparison of CE Performance Versus TLC for Black Ballpoint Pen Ink Analysis
| Performance Parameter | Capillary Electrophoresis Performance | Traditional TLC Performance | Forensic Significance |
|---|---|---|---|
| Sensitivity | Significantly higher sensitivity for dye components [8] | Lower sensitivity, requiring more sample | Enables analysis of micro-samples from documents |
| Analysis Time | Faster analysis time [8] | Longer development and drying times | Increases laboratory throughput efficiency |
| Identification Capability | Definitive chemical identification via mobility and spectra [8] | Primarily comparative (Rf values) | Provides chemically specific data for expert testimony |
| Multi-Component Analysis | Detects dyes, solvents, and additives simultaneously [8] | Primarily separates dyes | Offers more comprehensive profiling of ink formulation |
| Separation Efficiency | High separation efficiency with minimal sample volume [4] | Moderate separation efficiency | Reduces destructive sampling of evidence |
| Data Reproducibility | High precision with calculated electrophoretic mobility [8] | Moderate reproducibility subject to environmental factors | Enhances reliability for database matching |
Beyond the parameters detailed in Table 1, CE offers the unique capability to perform simultaneous separation and chemical identification.- The combination of calculated electrophoretic mobility and characteristic ultraviolet-visible (UV-Vis) spectra creates a two-dimensional identification system that is far more specific than the simple Rf values obtained from TLC [8]. This capability is further enhanced when CE is coupled with photodiode array detection (190-600 nm), allowing for the creation of comprehensive spectral profiles for each separated component.
Experimental Protocol: CE Analysis of Ballpoint Pen Inks
Research Reagent Solutions and Essential Materials
The following reagents and materials are required for the successful implementation of the CE ink analysis protocol.
Table 2: Essential Research Reagents and Materials for Forensic Ink Analysis by CE
| Item/Category | Specification/Function | Example Sources |
|---|---|---|
| Capillary Electrophoresis System | Instrument with UV-Vis or PDA detection | SCIEX, Agilent, Beckman-Coulter |
| Fused-Silica Capillary | Separation channel; 50-75 µm ID, 50-60 cm length | Various CE supply companies |
| Anionic CE Buffer | Separation medium for dye components | 20-50 mM borate or phosphate buffer, pH 8-9 |
| Methanol | Primary extraction solvent for ink samples | HPLC or analytical grade |
| Micro-Harris Punch | Micro-sampling of ink from paper substrates | Forensic supply vendors |
| Ultrasonic Bath | Enhances extraction efficiency | Laboratory equipment suppliers |
| Centrifugal Filter Units | Sample cleanup (0.45 µm) | Various manufacturers |
| Standard Ink Samples | Method development and quality control | Standard ink libraries |
Sample Preparation Protocol
- Micro-Sampling: Using a micro-Harris punch, carefully remove a paper substrate containing approximately 0.5 mm² of ink stroke. Precise micro-sampling minimizes visible damage to the document [8].
- Ink Extraction: Transfer the paper sample to a micro-centrifuge tube and add 100 µL of methanol. Sonicate the sample for 15 minutes to ensure efficient extraction of ink components.
- Sample Cleanup: Centrifuge the extracted sample at 10,000 × g for 5 minutes to precipitate paper fibers and particulates. Carefully transfer the supernatant to a clean vial. For heavily pigmented samples, consider filtration through a 0.45 µm centrifugal filter unit.
- Sample Storage: Store prepared samples at 4°C if not analyzed immediately. Under these conditions, samples remain stable for at least 72 hours.
CE Instrumental Conditions and Separation Method
The following method has been specifically optimized for the separation of black ballpoint pen ink dyes [8]:
- Capillary: Bare fused-silica, 60 cm total length (50 cm to detector), 50 µm internal diameter
- Background Electrolyte: 25 mM sodium borate buffer, pH 9.2
- Injection: Hydrodynamic injection, 3.45 kPa for 5 seconds
- Separation Voltage: 30 kV (normal polarity)
- Temperature: 25°C
- Detection: UV-Vis photodiode array, 190-600 nm with primary detection at 214 nm for cationic dyes
- Capillary Conditioning: Between runs, rinse with 0.1 M NaOH for 1 minute, followed by background electrolyte for 2 minutes.
Data Analysis and Interpretation
- Peak Identification: Identify separated components based on their migration time and electrophoretic mobility relative to standards.
- Spectral Confirmation: Compare UV-Vis spectra of unknown peaks against reference spectra for known ink dyes.
- Quantitative Assessment: Measure peak areas or heights for semi-quantitative comparison of dye ratios between samples.
Diagram 1: Experimental workflow for comparative analysis of ballpoint pen inks using capillary electrophoresis, highlighting steps for method validation against traditional TLC approaches.
Discussion of Technical Considerations
Optimizing Sensitivity and Resolution
The high sensitivity of CE for ink analysis stems from several technical factors. The use of extended light path capillaries (bubble cells) can enhance UV detection sensitivity by up to 10-fold without methodological changes [9]. For difficult-to-detect components, sample stacking techniques such as field-amplified sample injection can provide up to 1000-fold sensitivity enhancement compared to standard hydrodynamic injection, achieving detection limits in the lower ng/mL range [9] [10]. When analyzing neutral components in inks (such as certain additives or solvents), micellar electrokinetic chromatography (MEKC) can be employed by adding surfactants like tetradecyltrimethylammonium bromide (TTAB) to the separation buffer [11]. This modification creates a pseudo-stationary phase that enables the separation of neutral compounds through partitioning mechanisms.
Forensic Validation and Standardization
For forensic implementation, CE methods must undergo rigorous validation following established scientific guidelines. Key validation parameters include:
- Precision: Migration time reproducibility (RSD < 1.5%)
- Specificity: Baseline separation of critical dye components
- Sensitivity: Limit of detection established for minor components
- Robustness: Method performance under slight variations of buffer pH and composition
The creation of an ink component database using standardized CE methods enables comparative analysis across casework samples. Such databases facilitate the determination of ink origins and the assessment of whether multiple documents share a common ink source.
Capillary electrophoresis represents a significant advancement in the forensic analysis of ballpoint pen inks, demonstrating clear and documentable improvements over traditional TLC methods. The technique provides a powerful combination of higher sensitivity, faster analysis times, and more definitive chemical identification—critical factors in forensic evidence analysis. The protocols detailed in this application note provide a validated foundation for implementing CE in forensic document examination laboratories. As CE technology continues to evolve with improved detection systems and miniaturized formats, its application in forensic science will further expand, offering even greater capabilities for the analysis of trace evidence in questioned document cases.
The authenticity of handwritten documents is a critical concern in legal, financial, and administrative contexts. Fraudulent alterations to contracts, wills, or checks through the addition of fresh ink necessitate robust forensic methodologies to determine ink sources and establish document integrity. This application note addresses this challenge by providing detailed protocols for the analysis of ballpoint pen inks, with a specific focus on the application of capillary electrophoresis (CE). The content is framed within a broader thesis investigating the Technology Readiness Levels (TRL) of capillary electrophoresis for forensic ink analysis, evaluating its maturity from fundamental research to operational deployment.
Technology Readiness Level (TRL) Assessment
Table 1: Technology Readiness Level for Capillary Electrophoresis in Forensic Ink Analysis
| TRL | Stage Description | Status in CE for Ink Analysis |
|---|---|---|
| 1-2 | Basic principles observed, technology concept formulated | Principles of CE separation established [5] |
| 3-4 | Experimental proof-of-concept, component validation in lab | CE research applied to forensic science; laboratory studies conducted [5] [12] |
| 5-6 | Validation in simulated/relevant environment, prototype demonstration | Component integration and testing; methods developed for specific analytes (e.g., dyes) [5] |
| 7-9 | System prototype in operational environment, technology proven | Breakthrough to routine applications in clinical/forensic labs; use under quality control [12] |
Capillary electrophoresis has demonstrated a proven trajectory from basic research to routine application. Initial studies established the fundamental principles of CE separation [5], with research subsequently transitioning into applied forensic science and clinical diagnostics [12]. This progression demonstrates the technique's maturity, having achieved operational status under stringent quality control conditions in analytical laboratories.
The Scientist's Toolkit: Key Reagents and Materials
Table 2: Essential Research Reagent Solutions for Capillary Electrophoresis
| Item | Function/Description | Application Context |
|---|---|---|
| Fused-Silica Capillaries | The core separation column (<100 µm I.D.), protected by a polyimide layer [5]. | The foundational component for all CE separations. |
| Running Buffers | Aqueous solutions at specific pH and ionic strength to conduct current and define separation conditions. | Creates the electrophoretic environment; composition is key to separation mode (CZE, MEKC, etc.) [5]. |
| Extraction Solvents | Solvents or mixtures (e.g., Ethanol:Methanol 70:30) used to dissolve ink components from paper matrices [13]. | Sample preparation for destructive analysis of inks. |
| Calibration Standards | Compounds with known mobility or mass for instrument calibration and method validation. | Ensures reproducibility, accuracy, and reliability of the analytical data. |
Complementary Analytical Techniques for Ink Analysis
While CE is a powerful technique, a multimodal approach often yields the most comprehensive forensic intelligence. Several other analytical methods are commonly employed, each with distinct advantages and applications.
Table 3: Comparison of Prominent Techniques for Forensic Ink Analysis
| Technique | Principle | Key Application in Ink Analysis | Key Advantage |
|---|---|---|---|
| Gas Chromatography-Mass Spectrometry (GC-MS) | Separates and identifies volatile components based on affinity for a stationary phase and mass [14]. | Analysis of solvent composition (e.g., 2-phenoxyethanol) for absolute ink dating [14]. | High sensitivity for volatile and semi-volatile organic compounds. |
| Multiple Headspace Solid-Phase Microextraction (MHS-SPME) | A stepped extraction technique to monitor the evaporation of volatile components from a sample [14]. | Monitoring ink solvent evaporation over time to establish aging curves (DATINK method) [14]. | Provides mass-invariant measurements, independent of the initial ink amount sampled. |
| Digital Image Analysis (DIA) | Colorimetric analysis of document images using smartphone cameras or scanners and processing software [15]. | Nondestructive, low-cost screening to identify crossings of recent ink lines over old inks [15]. | Completely nondestructive, fast, and low-cost; ideal for initial screening. |
| Laser-Induced Breakdown Spectroscopy (LIBS) | A micro-invasive technique providing multi-elemental analysis via laser-induced plasma [16]. | Discrimination of inks based on elemental signatures and determination of deposition order at crossing lines [16]. | Rapid, requires minimal sample preparation, and enables depth profiling. |
| Multimodal Mass Spectrometry Imaging (e.g., DESI-MSI & MALDI-MSI) | Maps the spatial distribution of molecular species directly from the paper substrate [17]. | In-situ chemical imaging of inks (dyes, polymers) for comprehensive composition analysis and forgery detection [17]. | Provides high chemical specificity and spatial information without the need for extensive sample prep (DESI). |
Experimental Protocols
Protocol A: Analysis of Solvents for Absolute Ink Dating via MHS-SPME/GC-MS
This protocol is designed for determining the age of ballpoint pen ink entries by monitoring the evaporation of volatile solvents, primarily 2-phenoxyethanol (PE), over time [14].
- Sample Preparation: A paper disc containing the ink stroke is precisely punched and placed into a sealed headspace vial.
- Multiple Headspace Extraction (MHS-SPME):
- A Solid-Phase Microextraction (SPME) fiber is exposed to the vial's headspace for a controlled time and temperature to absorb volatile compounds.
- This extraction is performed consecutively (e.g., 7 times) on the same sample.
- The peak area (Ai) for the target solvent (e.g., PE) is recorded for each extraction step (i).
- Data Analysis:
- The natural logarithm of the peak areas (ln Ai) is plotted against the extraction number (i-1).
- The slope of the resulting linear plot is used to calculate the β parameter, which is characteristic of the analyte and changes as the ink matrix ages and hardens.
- The β parameter, or the ratio of the first to the last peak area (A1/A7), is used as an indicator of ink age by referencing established aging curves.
Protocol B: Nondestructive Screening of Crossed Ink Lines via Digital Image Analysis
This protocol provides a rapid, nondestructive initial assessment to determine if two intersecting ink lines were applied at different times [15].
- Image Acquisition: A digital image of the questioned document is captured using a smartphone or scanner under consistent and controlled lighting conditions.
- Region of Interest (ROI) Selection: Using image processing software (e.g., ColorGrab), color data is collected from three distinct regions:
- OPI: The suspected newer, overlapping pen ink.
- IPI: The suspected older, underlying pen ink.
- DPI: The original document pen ink away from the intersection.
- Color Channel Evaluation: The Red (R), Green (G), Blue (B), Hue (S), Saturation (S), and Value (V) channel values for each ROI are extracted.
- Chemometric Analysis: Principal Component Analysis (PCA) and k-means clustering are applied to the color data. The formation of distinct clusters for the OPI, IPI, and DPI regions indicates that the inks are chemically different, supporting the hypothesis of a later addition.
Protocol C: Multimodal Workflow for Comprehensive Ink and Substrate Analysis
This protocol employs a sequential, multimodal mass spectrometry imaging approach to maximize the chemical information obtained from a sample, moving from less to more destructive techniques [17].
- Sample Mounting: The document sample is secured to a microscope slide using double-sided conductive carbon tape.
- DESI-MSI Analysis (Negative Ion Mode):
- The sample is first analyzed by Desorption Electrospray Ionisation Mass Spectrometry Imaging (DESI-MSI) without any pre-treatment.
- A charged solvent spray (e.g., methanol-water-formic acid) desorbs and ionizes chemical species from the sample surface.
- This step maps the distribution of various compounds, such as additives and polymers, with minimal impact on the sample.
- MALDI-MSI Analysis (Positive Ion Mode):
- The same sample is then subjected to Matrix Assisted Laser Desorption Ionisation Mass Spectrometry Imaging (MALDI-MSI).
- A matrix (e.g., α-cyano-4-hydroxycinnamic acid - CHCA) is uniformly applied to the sample to assist in the desorption and ionization of larger molecules.
- This step targets different molecular species, such as dyes, providing complementary chemical images.
- Data Integration: Data from both DESI and MALDI imaging are combined and interrogated using statistical approaches to provide a comprehensive chemical profile of the ink and paper substrate for robust discrimination and forgery detection.
Workflow and Pathway Diagrams
Analytical Workflow for Document Authentication
TRL Progression of Capillary Electrophoresis
A Practical Workflow for CE-Based Ink Analysis: From Sample to Result
This application note details specialized extraction protocols for the forensic analysis of ballpoint pen inks using capillary electrophoresis (CE). The focus is on non-destructive and minimally-invasive techniques that preserve evidence integrity while enabling high-resolution chemical characterization of ink components. We provide comprehensive methodologies for sampling, sample preparation, and analysis tailored for questioned document examination, supporting the advancement of forensic science research and its applications in legal contexts.
The forensic analysis of ballpoint pen inks presents a significant challenge, requiring a balance between obtaining robust chemical data and preserving the physical integrity of documentary evidence. Traditional extraction methods often necessitate destructive sampling, which can compromise evidence for future examinations. This document establishes standardized protocols for non-destructive and minimally-invasive extraction techniques, specifically optimized for subsequent analysis by capillary electrophoresis. CE has proven to be a powerful tool for forensic ink analysis, offering complete automation, rapid method development, and the ability to obtain ultraviolet-visible spectra of each separated component, thereby facilitating the creation of searchable digital libraries of ink profiles [2]. The protocols herein are designed to enable reliable differentiation of ink formulations while adhering to the fundamental forensic principle of minimal evidence consumption.
Micro-Extraction Techniques for Ink Analysis
Micro-extraction techniques are cornerstone methods for non-destructive forensic ink analysis. They are characterized by minimal sample consumption (often involving a single stroke of ink, <1 cm in length), solvent-free or minimal solvent use, and short extraction times, making them ideal for preserving valuable evidence [18].
Solid-Phase Microextraction (SPME) for Volatile Organic Compounds (VOCs)
SPME is a solvent-free technique that involves the use of a fused-silica fiber coated with a stationary phase to extract volatile and semi-volatile compounds from the headspace above a sample.
Experimental Protocol: SPME-GC/MS/CE for Ink VOC Profiling
- Objective: To extract and identify volatile organic compounds (VOCs) from ballpoint pen inks for age estimation and source differentiation.
- Principle: An SPME fiber is exposed to the headspace above an ink sample. VOCs adsorb onto the fiber coating and are subsequently desorbed in the injection port of a Gas Chromatograph (GC) or introduced into a CE system for separation and detection [18] [19].
- Materials:
- SPME holder and fibers (e.g., Carboxen/Polydimethylsiloxane, Divinylbenzene/Carboxen/Polydimethylsiloxane)
- Gas Chromatograph-Mass Spectrometer (GC-MS) or CE with appropriate interface
- Heated sample chamber or block
- Document containing ink sample
- Procedure:
- Conditioning: Condition the SPME fiber in the GC injection port according to the manufacturer's specifications (typically 250-270°C for 5-60 minutes).
- Sample Equilibration: Place the document with the ink sample in a sealed, inert vial. Incubate the vial at a controlled temperature (e.g., 60-80°C) for 10-30 minutes to allow VOC equilibrium in the headspace.
- Extraction: Expose the conditioned SPME fiber to the headspace above the ink sample for 10-60 minutes, maintaining the incubation temperature [18].
- Desorption: Retract the fiber and immediately introduce it into the injection port of the GC (or CE interface) for thermal desorption (e.g., 250°C for 5 minutes) [19].
- Analysis: Analyze the desorbed compounds by GC-MS or CE. Data can be processed with machine learning algorithms for temporal pattern recognition and age prediction [19].
Minimal-Solvent Micro-Scale Liquid Extraction
This technique uses minute volumes of solvent to dissolve specific ink components directly from a paper substrate, resulting in a microscopic extraction area that is often undetectable by visual inspection.
Experimental Protocol: Micro-Scale Liquid Extraction for Dyes and Additives
- Objective: To extract cationic dyes and additives from blue ballpoint pen inks for differentiation by capillary electrophoresis.
- Principle: A tiny volume of solvent is applied to an ink line to dissolve specific components, which are then collected for analysis. This method addresses the disadvantages of traditional Thin-Layer Chromatography (TLC), such as poor reproducibility and unresolved spots [2].
- Materials:
- Fine-gauge micro-syringe or capillary pipette
- Suitable solvent (e.g., methanol, ethanol, pyridine, or mixed solvents optimized for target ink components)
- Micro-vials for sample collection
- Capillary Electrophoresis system with Photodiode Array (PDA) detector
- Background Electrolyte (e.g., 50 mM ammonium acetate / acetic acid in 30% acetonitrile, pH 4.6) [2]
- Procedure:
- Solvent Selection: Identify an optimal solvent system that effectively dissolves target dyes without excessive leaching of paper cellulose. Pure methanol or ethanol are common starting points.
- Extraction: Using a micro-syringe, place a single, minute droplet (0.5 - 1 µL) of solvent onto an ink line. Allow it to reside for 10-30 seconds.
- Collection: Swiftly withdraw the solvent droplet back into the syringe, now containing dissolved ink components.
- Dilution and Transfer: Expel the collected extract into a micro-vial containing 10-20 µL of CE background electrolyte. Rinse the syringe and add the rinsate to the vial.
- Analysis: Introduce the sample into the CE system. Separation conditions may include an applied voltage of 15-30 kV and detection at multiple wavelengths (e.g., 210 nm, 280 nm, 400 nm, 600 nm) to capture the unique UV-Vis spectra of each component [2].
Table 1: Comparison of Micro-Extraction Techniques for Forensic Ink Analysis
| Parameter | Solid-Phase Microextraction (SPME) | Micro-Scale Liquid Extraction |
|---|---|---|
| Extraction Principle | Adsorption of VOCs onto a coated fiber | Dissolution of analytes using miniaturized solvent application |
| Target Analytes | Volatile and semi-volatile organic compounds (VOCs) | Cationic dyes, pigments, and additives |
| Sample Consumption | Virtually non-destructive | Minimally-invasive (microscopic area) |
| Solvent Usage | Solvent-free | Minimal (≤ 1 µL) |
| Typical Extraction Time | 10 - 60 minutes | 1 - 5 minutes |
| Compatible Analysis | GC-IMS, GC-MS, CE | Capillary Electrophoresis, HPLC |
| Key Advantage | Excellent for ink aging studies via VOC profiling [19] | Direct extraction of key dye components for source differentiation [2] |
Advanced Sampling and Combination with Capillary Electrophoresis
The integration of advanced sampling with high-sensitivity CE is critical for modern forensic ink analysis. CE provides a powerful platform for separating complex ink formulations due to its high efficiency, small sample requirements, and ability to obtain spectroscopic data on each component.
Capillary Electrophoresis Analysis of Ink Extracts
- Principle: CE separates ionic analytes based on their electrophoretic mobility in a buffer-filled capillary under the influence of a high-voltage electric field. Ink dyes, being charged molecules, are ideal candidates for this technique.
- Procedure for Ink Analysis:
- Capillary Conditioning: Flush the capillary with background electrolyte (BGE) for 2-3 minutes.
- Sample Injection: Inject the ink extract hydrodynamically (e.g., 0.5 psi for 5-10 seconds) or electrokinetically.
- Separation: Apply a separation voltage (e.g., 15-30 kV). The cationic dyes will migrate towards the cathode and be separated based on their charge-to-size ratio [2].
- Detection: Use a PDA detector to capture UV-Vis spectra for each peak, which aids in compound identification. The result is an electropherogram, which serves as a chemical profile of the ink [2] [20].
- Data Analysis: Compare electropherogram peak patterns and retention times of unknown samples to those in a validated reference database.
The following workflow diagram illustrates the integrated process from non-destructive sampling to data analysis:
Workflow for Forensic Ink Analysis
Quantitative Data from Analytical Techniques
Advanced analytical combinations yield quantitative data crucial for objective comparisons.
Table 2: Characteristic Outputs from Combined Extraction and Analysis Techniques
| Analytical Technique | Measurable Output | Forensic Application & Interpretation |
|---|---|---|
| SPME-GC-IMS with ML | Temporal Prediction Accuracy (Test R² = 0.954) [19] | High-confidence estimation of ink age based on VOC evolution. |
| SPME-GC-IMS with ML | Stage Classification Accuracy (Up to 100%) [19] | Categorization of ink into aging stages (e.g., rapid evaporation, slow-release, stabilization). |
| CE with PDA Detection | Number of Distinct Peaks per Dye Channel | Differentiation of ink sources; identification of 5+ components (dyes/additives) is sufficient to distinguish most inks [2]. |
| CE with PDA Detection | UV-Vis Spectrum of Each Peak | Chemical identity confirmation and detection of co-migrating components not resolved by TLC. |
The Scientist's Toolkit: Research Reagent Solutions
The following table details essential materials and their functions for implementing these protocols.
Table 3: Key Research Reagents and Materials for Non-Destructive Ink Analysis
| Item | Function/Application |
|---|---|
| SPME Fibers (e.g., CAR/PDMS, DVB/CAR/PDMS) | Adsorptive extraction of volatile organic compounds (VOCs) from the headspace of ink samples for aging and source studies [18] [19]. |
| Micro-syringes/Capillary Pipettes | Precise application and retrieval of sub-microliter solvent volumes for localized, minimally-invasive extraction of ink dyes. |
| Background Electrolyte (BGE) | The conductive medium in CE that defines pH and ionic strength, critical for controlling separation efficiency and selectivity of ionic ink dyes [2]. |
| Capillary Electrophoresis System with PDA | High-resolution separation and ultraviolet-visible spectral characterization of extracted ink components, enabling automated and searchable analysis [2] [20]. |
| Machine Learning Algorithms (e.g., Categorical Boosting/CatBoost, Decision Tree Regression) | Advanced data analysis of complex GC-IMS or CE datasets for pattern recognition, classification of temporal stages, and prediction of ink age [19]. |
The non-destructive and minimally-invasive extraction techniques detailed in this application note—SPME and micro-scale liquid extraction—provide forensic scientists with robust tools for the analysis of ballpoint pen inks. When coupled with the high-separation power of capillary electrophoresis and advanced data analysis methods like machine learning, these protocols enable reliable ink differentiation and temporal evolution studies. This integrated approach significantly advances the field of forensic document examination by yielding conclusive chemical evidence while upholding the paramount importance of preserving the integrity of original evidence.
Capillary Zone Electrophoresis (CZE) represents a powerful analytical technique for the separation of ionic analytes, including synthetic dyes, based on their differential electrophoretic mobility in an electric field. Within forensic science, the analysis of writing inks—particularly ballpoint pen inks—is crucial for document dating and authentication. This application note details the selection, development, and validation of CZE methods for the separation of dyes encountered in forensic casework, supporting research at various Technology Readiness Levels (TRL).
The principle of CZE separation is grounded in the differential migration of charged species under the influence of an applied electric field. The electrophoretic mobility (µe) of an ion is described by the equation: µe = q / (6πηr), where q is the net charge, η is the viscosity of the buffer, and r is the Stokes radius of the ion [21]. In a standard setup, separation occurs within a fused-silica capillary filled with a Background Electrolyte (BGE). The resulting electroosmotic flow (EOF) provides a pump-like mechanism that transports all analytes, regardless of charge, towards the detector, enabling the separation of cations, anions, and neutral species in a single run [21].
The Scientist's Toolkit: Key Reagent Solutions
The following table catalogues essential reagents and materials required for developing a CZE method for dye analysis.
Table 1: Key Research Reagents and Materials for CZE Dye Analysis
| Reagent/Material | Function/Application | Exemplary Specifications |
|---|---|---|
| Background Electrolyte (BGE) Salts | Provides the conductive medium for separation; pH and ionic strength critically affect resolution. | Borate buffer (e.g., 100 mM stock, pH 8-10) [22]; Phosphate buffer (e.g., 75 mM, pH 9.0) [23] |
| Capillary | The separation channel. Fused silica is standard; internal diameter and effective length impact efficiency and sensitivity. | Fused silica, 25-75 μm internal diameter, 50-60 cm total length [22] [21] |
| Dynamic Coating Additives | Suppresses analyte adsorption to the capillary wall and modulates EOF to improve peak shape and reproducibility. | Triethylenetetramine (TETA) [24]; Hydroxypropyl Methyl Cellulose (HPMC) [24] |
| Selectivity Modifiers | Added to the BGE to enhance separation selectivity for specific analytes, such as neutral or chiral molecules. | Sodium dodecyl sulfate (SDS) for Micellar Electrokinetic Chromatography (MEKC) [25]; Cyclodextrins [25] |
| Internal Standard | A compound with known migration time used to correct for run-to-run variations in migration time and injection volume. | Mesityl oxide (MO) is commonly used [23] |
CZE Method Optimization for Dye Separation
Robust method development is a systematic process focusing on key parameters that govern separation efficiency, resolution, and analysis time. The following workflow outlines the critical steps and decision points.
Background Electrolyte Optimization
The composition of the BGE is the most critical factor in CZE separation.
- BGE pH: The pH of the running electrolyte determines the ionization state of both the capillary wall silanols and the analytes. For synthetic dyes, which are often acidic or anionic (e.g., containing sulfonic acid groups), a basic pH range (8-11) is typically chosen to ensure they are in their ionized, anionic form, facilitating separation as anions [22]. A study on food dyes found that migration times generally decreased with increasing pH from 8 to 10, with optimal resolution achieved at a specific pH (e.g., pH 9.8 for a dye mixture) [22].
- BGE Concentration: The ionic strength of the BGE, regulated by the concentration of the buffer salt, affects the electroosmotic flow, electrophoretic velocity, and the extent of Joule heating. Higher ionic strength can improve efficiency but may lead to excessive current and thermal band broadening. A systematic study using Central Composite Design (CCD) identified 75 mM sodium phosphate as optimal for separating pharmaceutical compounds, balancing resolution and analysis time [23].
Instrumental Parameter Optimization
- Applied Voltage: Higher voltages decrease analysis time and increase efficiency but simultaneously increase current and Joule heating. The maximum voltage is often determined by the current stability; a voltage that produces a stable current below 100 μA is typically sought to avoid excessive heat generation [22] [23].
- Capillary Temperature: Precise temperature control is essential for reproducible migrations. Increased temperature reduces buffer viscosity, leading to shorter migration times, but must be balanced against the risk of promoting thermal gradients within the capillary.
Table 2: Exemplary Optimized CZE Conditions for Dye Separation
| Parameter | Reported Optimal Conditions | Impact on Separation |
|---|---|---|
| BGE | 40-100 mM Borate or Phosphate | Provides buffering capacity and defines ionic strength. |
| pH | 9.0 - 10.0 | Governs analyte charge and EOF; critical for resolution of anions. |
| Applied Voltage | +10 kV to +30 kV | Drives electroosmotic flow and electrophoretic mobility. |
| Capillary Temperature | 20 °C - 25 °C | Controlled to ensure run-to-run reproducibility. |
| Detection Wavelength | 200 nm - 280 nm | UV detection, often at 214 nm or 254 nm for dyes. |
| Capillary Dimensions | 50-60 cm total length, 25-75 μm ID | Standard dimensions providing a balance of efficiency and sensitivity. |
Detailed Experimental Protocol: CZE of Ballpoint Pen Ink Dyes
Scope
This protocol describes a CZE method for the comparative analysis of dyes extracted from ballpoint pen inks for forensic purposes. The method is designed to separate a mixture of acidic and direct dyes commonly found in writing compositions.
Safety Considerations
- Standard laboratory safety procedures must be followed.
- Wear appropriate personal protective equipment (PPE) including a lab coat, safety glasses, and gloves.
- Consult safety data sheets (SDS) for all chemicals before use.
Materials and Equipment
- Capillary Electrophoresis System with UV-Vis or DAD detector.
- Fused-silica capillary: 50 μm internal diameter (ID), 50 cm total length (40 cm effective length to detector).
- Microcentrifuge tubes and vials compatible with the CE autosampler.
- Pipettes and tips for handling microliter volumes.
- Vortex mixer and ultrasonic bath.
- Chemicals: Sodium tetraborate (borate), sodium dihydrogen phosphate, disodium hydrogen phosphate, sodium hydroxide (NaOH), hydrochloric acid (HCl), organic solvents (e.g., methanol, ethanol), and purified water.
Step-by-Step Procedure
Background Electrolyte Preparation
- Prepare a 100 mM borate stock solution by dissolving the appropriate mass of sodium tetraborate in purified water.
- For the working BGE, dilute the stock solution to a concentration of 40 mM.
- Adjust the pH to 9.8 using a solution of NaOH or HCl.
- Filter the BGE through a 0.45 μm membrane filter and degas using an ultrasonic bath for 5 minutes before use.
Standard and Sample Preparation
- Ink Extraction: Cut a 1-2 mm segment of the ink stroke from the document. Place the segment in a microcentrifuge tube and add 100 μL of a 1:1 (v/v) mixture of ethanol and water.
- Sonicate the tube for 15 minutes and then vortex for 1 minute.
- Centrifuge at 10,000 rpm for 5 minutes to pellet any insoluble paper fibers or pigments.
- Carefully transfer the supernatant to a clean CE vial for analysis.
- Standard Solutions: Prepare individual stock solutions (e.g., 1 mg/mL) of reference dyes (e.g., Acid Blue, Basic Blue, etc.) in an appropriate solvent. Create a mixed standard by combining aliquots of individual stocks.
Capillary Conditioning and Equilibration
- Install a new capillary or begin a sequence with a initial conditioning rinse:
- 1.0 M NaOH for 10 minutes at high pressure (e.g., 50 psi).
- Purified water for 5 minutes at 50 psi.
- Background Electrolyte for 10 minutes at 50 psi.
- Between each run, perform a brief capillary reconditioning:
- 0.1 M NaOH for 1-2 minutes.
- Purified water for 1-2 minutes.
- Background Electrolyte for 2-3 minutes.
Instrument Operation and Data Acquisition
- Set the detector wavelength to 214 nm or 254 nm.
- Set the capillary temperature to 25 °C.
- Apply an injection pressure (e.g., 0.5 psi) for a short duration (e.g., 5-10 seconds) to introduce a narrow sample plug.
- Apply a separation voltage of +20 kV (positive polarity at the inlet).
- Allow the separation to proceed for 10-15 minutes.
- Acquire and store the electropherogram for subsequent data analysis.
Data Analysis and Interpretation
- Identify dye peaks in the sample electropherogram by comparing their migration times with those of the standard mixture.
- Use the internal standard (e.g., mesityl oxide) to normalize migration times and correct for minor run-to-run variations.
- For comparative forensic analysis, overlay the electropherograms of the questioned ink and a known reference ink. A match in the number of peaks, their migration times, and their relative peak areas/heights provides strong evidence for a common source.
Application in Forensic Analysis of Ink Traces
The analysis of single fibers and microtraces is a cornerstone of modern forensic science. Fibers and ink traces secured from a crime scene are often minuscule, with single fibers typically having a diameter of 15–25 μm and a length of 1–3 mm [26]. The small sample volume requirement of CZE makes it uniquely suited for such analyses. The primary challenge in analyzing dyes from a single fiber is the extremely low concentration of the target analytes, often requiring highly sensitive detection methods [26].
In the context of document examination, determining the age of handwritten inscriptions is a complex task. Writing inks are complex mixtures of dyes, solvents, resins, and other additives. Over time, these components undergo chemical changes, such as the degradation of dyes. CZE, as a separation method, has been identified as a potential technique for analyzing dye extracts from inks to assist in this dating process, though its application in this specific field is less widespread than chromatographic methods [27]. The technique's high resolution allows it to distinguish between closely related dye isomers and decomposition products that may serve as time-dependent markers.
The forensic analysis of ballpoint pen inks is a critical discipline within questioned document examination, aimed at determining the provenance of ink entries and authenticating legal, financial, and historical documents. Capillary Electrophoresis (CE) has emerged as a powerful separation technique for this purpose, offering superior resolution, minimal sample consumption, and high sensitivity. When coupled with a broad-spectrum Ultraviolet-Visible Photodiode Array (PDA) detector (190-600 nm), this technique transitions from simple component separation to comprehensive chemical identification. This hyphenated system, CE-PDA, provides a robust chemical fingerprint for inks by not only separating dye components based on their electrophoretic mobility but also capturing their characteristic absorption spectra [8]. This application note details the protocols and advantages of utilizing CE-PDA for the forensic analysis of ballpoint pen inks, providing a reliable methodology for researchers and forensic scientists.
The primary challenge in ink analysis is the complex chemical nature of ballpoint inks, which are sophisticated mixtures of colorants (dyes and pigments), vehicles (oils, resins), and additives (plasticizers, surfactants) formulated to achieve specific writing properties [8]. Thin-layer chromatography (TLC) has been the traditional workhorse for ink analysis. However, CE-PDA addresses several limitations of TLC: it is fully automated, enabling higher reproducibility; it offers faster analysis times; and it provides definitive spectral identification for each separated component, which is not inherent to TLC [2]. The ability to detect solvents and other non-dye additives concurrently with dye analysis further enhances the discriminating power of the technique [8].
Principles of Detection and Identification
The core strength of the CE-PDA system lies in its dual identification mechanism. The first is separation-based identification. In Capillary Zone Electrophoresis (CZE), charged molecules, such as the ionic dyes found in ballpoint inks, are separated based on their differential electrophoretic mobility in an applied electric field within a capillary filled with a conductive buffer [28]. Each dye component migrates at a characteristic velocity, resulting in a temporal separation that is recorded as an electropherogram.
The second, and more definitive, mechanism is spectrum-based identification. As each separated component passes through the detector flow cell, the photodiode array captures its full UV-Vis absorption spectrum across the 190-600 nm range [8]. This is a significant advantage over single-wavelength detectors. The captured spectrum serves as a unique chemical signature for that component. Identification is achieved by comparing the calculated electrophoretic mobility of the unknown peak and its characteristic spectrum against a library of known ink standards [8] [29]. This dual-parameter confirmation (mobility + spectrum) drastically reduces the risk of false positives, especially for inks composed of dyes with similar migration times but distinct chromophores.
Table 1: Key Advantages of CE-PDA over Traditional TLC for Ink Analysis
| Feature | Capillary Electrophoresis with PDA Detection | Thin-Layer Chromatography |
|---|---|---|
| Automation | Fully automated separation and detection [2] | Manual spotting and development |
| Data Obtained | Electropherogram, precise migration times, and UV-Vis spectra [8] | Retardation factor (Rf) and spot color |
| Sensitivity | Higher sensitivity for detecting trace components [8] | Lower sensitivity; faint spots can be difficult to visualize [2] |
| Resolution | High resolution, capable of separating co-migrating dyes with different spectra [8] | Can result in unresolved spots with nearly identical colors [2] |
| Data Storage & Sharing | Electronic data suitable for searchable libraries [2] | Physical plates requiring controlled storage |
Experimental Protocols
Sample Preparation
Two primary sampling methodologies are employed, with the direct sampling technique representing a significant recent advancement.
Traditional Indirect (Punch) Sampling: This method involves removing a small section of the inked paper.
- Punch: Using a hollow needle or punch, excise a 0.5-1 mm diameter sample from the written line.
- Extract: Transfer the paper punch to a microcentrifuge vial containing 10-20 µL of an appropriate extraction solvent (e.g., methanol, ethanol, or acetonitrile) [6].
- Sonicate: Sonicate the vial for 5-10 minutes to facilitate the extraction of ink components from the paper into the solvent.
- Centrifuge: Centrifuge the sample to sediment any insoluble paper fibers, preventing capillary blockage [6].
- Transfer: The resulting supernatant is transferred to a CE autosampler vial for analysis.
Novel Direct Sampling: This technique minimizes sample preparation and consumption, making it ideal for precious evidence.
- Punch: A small dot of ink on paper is punched out as in the traditional method.
- Mount: The punch is directly mounted onto a custom sampling device using double-sided tape [6].
- Direct Extraction and Injection: A minimal volume of background electrolyte (BGE) is deposited onto the ink-on-paper punch. The CE instrument's capillary then directly injects the extracted components from the paper substrate, bypassing the extraction, sonication, and centrifugation steps [6]. This method concentrates the sample and reduces total analysis time significantly.
Capillary Electrophoresis Separation
The following protocol is optimized for the separation of cationic dyes prevalent in blue and black ballpoint inks.
- Instrumentation: Standard CE system with a pressurized autosampler and a PDA detector.
- Capillary: Fused-silica capillary, 50 µm internal diameter, 50-60 cm total length.
- Background Electrolyte (BGE): Anionic CE buffer. A typical formulation is a 20-30 mM ammonium acetate/ammonium bicarbonate buffer at pH 9.0 [2]. This buffer composition effectively separates cationic dye components.
- Detection: PDA detection with continuous spectral acquisition from 190 nm to 600 nm. Specific wavelengths, such as 254 nm, 400 nm, 570 nm, and 600 nm, can be monitored simultaneously for creating extracted wavelength electropherograms [8] [29].
- Injection: Hydrodynamic injection, 0.5 psi for 5-10 seconds.
- Separation Voltage: Apply 20-25 kV, with the anode at the detector side to facilitate the migration of cationic dyes.
- Capillary Temperature: Maintained at 25°C.
The experimental workflow for both sampling methods is summarized below:
Data Analysis and Interpretation
- Peak Identification: Identify components in the electropherogram based on their migration time.
- Spectral Confirmation: For each peak, extract the UV-Vis spectrum from the PDA data. Compare this spectrum to a validated in-house library of ink dye spectra (e.g., Crystal Violet, Methyl Violet, Rhodamine B, Phthalocyanine derivatives) [8] [2].
- Calculate Electrophoretic Mobility: For definitive identification, calculate the electrophoretic mobility (µe) of each peak using the formula: µe = (Ld * Lt) / (V * tm), where Ld is the capillary length to the detector, Lt is the total capillary length, V is the applied voltage, and tm is the migration time. This normalized parameter is more reproducible than migration time alone.
- Library Matching: Use software tools to perform a library search, matching both the mobility and the spectral profile of the unknown to known standards. A high spectral match score (>95%) and consistent mobility strongly confirm the identity of a dye component.
Research Reagent Solutions and Essential Materials
A successful CE-PDA analysis relies on a set of specific reagents and materials.
Table 2: Essential Materials for CE-PDA Ink Analysis
| Item | Function / Description | Example / Note |
|---|---|---|
| Capillary | The separation channel. | Fused silica, 50 µm ID, 50-60 cm length [8]. |
| Background Electrolyte (BGE) | The conductive medium for separation. | 25 mM Ammonium Acetate/Ammonium Bicarbonate buffer, pH 9.0 [2]. |
| Extraction Solvents | To dissolve and extract ink components from paper. | Methanol, Ethanol, Acetonitrile [6]. |
| Standard Dyes | For library creation and method calibration. | Crystal Violet, Methyl Violet, Basic Blue etc. |
| Microcentrifuge Vials | For sample preparation in indirect methods. | Low-volume vials (0.5-2 mL) [6]. |
| Autosampler Vials | To hold prepared samples in the CE autosampler. | Compatible with specific CE instrument [6]. |
| PDA Detector | To acquire UV-Vis spectra of separated components. | Spectral range 190-600 nm [8]. |
Quantitative Data and Comparative Analysis
The quantitative performance of the CE-PDA method for ink analysis is demonstrated by its ability to differentiate a wide range of inks based on their chemical profiles. Research has shown that the identification of five or more components (dyes and additives) is typically sufficient to distinguish different blue ballpoint pen inks [2]. The following table summarizes key performance metrics and comparative data.
Table 3: Quantitative Performance and Validation Data
| Parameter | Performance Metric / Finding | Context / Reference |
|---|---|---|
| Spectral Range | 190 - 600 nm | Enables detection of dyes in UV and visible regions [8]. |
| Differentiating Power | 10+ blue ballpoint inks differentiated | Cationic CE method successfully distinguished 10 different inks [2]. |
| Minimum Components for Discrimination | 5 components | Dyes and additives sufficient for ink distinction [2]. |
| Comparison to TLC | Higher sensitivity & faster analysis | CE-PDA provides more definitive chemical ID than TLC [8]. |
| Sample Consumption | Minimal / "Micro-destructive" | Direct sampling consumes only a sub-millimeter punch [6]. |
Capillary Electrophoresis coupled with Photodiode Array Detection is a mature and highly effective technology for the forensic analysis of ballpoint pen inks. Its superior resolution, minimal sample requirements, and the powerful dual-parameter identification (electrophoretic mobility and UV-Vis spectrum) make it an indispensable tool for questioned document examiners. The advent of direct sampling protocols further enhances its forensic applicability by simplifying workflow and minimizing sample destruction. The methodology outlined in this application note provides a robust, reliable, and definitive framework for the detection and identification of ink dyes, enabling researchers to confidently address critical challenges in document authentication.
Within the domain of forensic document examination, the scientific analysis of ballpoint pen inks presents a significant challenge, necessitating precise and reliable analytical techniques. The determination of ink composition is crucial for verifying document authenticity and tracing materials back to their source. Capillary electrophoresis (CE) has emerged as a powerful separation tool for this purpose, offering high resolution, minimal sample consumption, and the ability to analyze complex mixtures of dyes and additives [4] [8]. The core quantitative parameter derived from CE analysis is the electrophoretic mobility (μ) of each separated component, which provides a reproducible fingerprint for identification. This application note details standardized protocols for calculating electrophoretic mobility and matching the resulting data against spectral libraries, specifically framed within the context of a broader thesis on Technology Readiness Level (TRL) research for forensic science.
Theoretical Foundations of Electrophoretic Mobility
Electrophoretic mobility is defined as the ratio of a particle's or molecule's steady-state velocity to the magnitude of the applied electric field. In the context of ink analysis, the "particles" are charged dye molecules and ionic additives. The fundamental relationship is given by:
μ = v / E
Where:
- μ is the electrophoretic mobility (typically in m²/V·s)
- v is the electrophoretic velocity (in m/s)
- E is the electric field strength (in V/m)
For a spherical colloidal particle, the mobility is governed by the properties of the particle and the surrounding electrolyte medium. A new analytical formulation for the electrophoretic mobility of a homogeneously charged colloidal sphere has been recently derived, which reduces to the well-known Henry's formulation for low surface potentials and performs well for a wide range of practical conditions [30]. The key dimensionless parameter in these models is the κa product, where κ is the inverse of the Debye length (representing the double layer thickness) and a is the radius of the particle [30]. For large κa (i.e., a thick double layer compared to the particle radius), the mobility can be directly related to the surface charge.
Table 1: Key Parameters in Electrophoretic Mobility Calculations
| Parameter | Symbol | Description | Typical Units |
|---|---|---|---|
| Electrophoretic Mobility | μ | Velocity per unit electric field | m²/V·s |
| Electric Field Strength | E | Voltage applied per unit capillary length | V/m |
| Electrophoretic Velocity | v | Observed velocity of analyte | m/s |
| Zeta Potential | ζ | Electric potential at the shear plane | V (mV) |
| Debye Length | κ⁻¹ | Characteristic thickness of the double layer | m (nm) |
| Kapa Product | κa | Ratio of particle radius to Debye length | Dimensionless |
The measured electrophoretic mobility can be used to calculate the zeta potential (ζ), which is the electric potential at the shear plane of the particle. This is a key indicator of surface charge. For forensic ink analysis, the absolute mobility value itself serves as a comparative identifier, as different dye molecules will have distinct and reproducible mobilities under standardized conditions [31] [8].
Experimental Protocols for CE-Based Ink Analysis
Sample Preparation Protocol
- Ink Extraction: Using a fine-point syringe or scalpel, carefully extract a micro-sample (approximately 0.5 mm²) of the ink stroke from the document. Alternatively, a non-destructive extraction can be performed by gently pressing a moistened (with extraction solvent) silica fiber onto the ink line.
- Dissolution: Transfer the sample to a micro-vial and add 100 µL of a 50:50 (v/v) methanol:water solution. Sonicate for 10 minutes to ensure complete dissolution of dye components.
- Filtration: Centrifuge the sample at 10,000 rpm for 5 minutes and carefully pipette the supernatant into a clean CE sample vial. Use a 0.2 µm syringe filter if necessary to remove particulate matter that could clog the capillary.
Capillary Electrophoresis Separation Protocol
- Instrument Setup: Install a fused-silica capillary (50 µm internal diameter, 50 cm total length, 40 cm to detector). Condition new capillaries by flushing with 1.0 M NaOH for 30 minutes, followed by deionized water for 15 minutes and run buffer for 15 minutes.
- Buffer Preparation: Prepare an anionic separation buffer consisting of 25 mM sodium tetraborate (borate) at pH 9.3. Filter through a 0.2 µm membrane and degas by sonication for 5 minutes before use.
- Instrumental Parameters:
- Separation Voltage: +20 kV (normal polarity)
- Temperature: 25 °C
- Detection: UV-Vis Photodiode Array (PDA), collecting data from 190 nm to 600 nm.
- Injection: Hydrodynamic injection at 50 mbar for 5 seconds.
- Daily Operation: Between runs, flush the capillary with run buffer for 2 minutes. To maintain reproducibility, at the end of each day, flush with 0.1 M NaOH for 10 minutes, followed by deionized water for 10 minutes. Store the capillary filled with deionized water.
Data Acquisition and Mobility Calculation Protocol
- Internal Standard: Add a known compound (e.g., mesityl oxide) to all samples and standards to correct for minor variations in injection and electroosmotic flow (EOF).
- Marker for Electroosmotic Flow (EOF): In a separate run, inject a neutral marker (e.g., acetone) to measure the EOF velocity, which is essential for calculating the true electrophoretic mobility.
- Calculation of Electrophoretic Mobility: a. Record the migration time (t) of each analyte and the neutral marker. b. Calculate the electrophoretic velocity: v = Ld / t, where Ld is the capillary length to the detector. c. Calculate the electroosmotic velocity: veo = Ld / teo, where teo is the migration time of the neutral marker. d. Calculate the effective electrophoretic velocity: veff = v - veo (for anions moving counter to the EOF). e. Calculate the electric field: E = V / Lt, where V is the applied voltage and Lt is the total capillary length. f. Finally, calculate the electrophoretic mobility: μ = v_eff / E.
Table 2: Example Calculation of Electrophoretic Mobility
| Parameter | Neutral Marker (EOF) | Dye Component A | Dye Component B |
|---|---|---|---|
| Migration Time (t) | 3.50 min | 4.15 min | 5.02 min |
| Velocity (v = L_d / t) | 1.90e-5 m/s | 1.60e-5 m/s | 1.32e-5 m/s |
| Effective Velocity (v_eff) | - | 0.30e-5 m/s* | 0.58e-5 m/s* |
| Electric Field (E = V / L_t) | 400 V/m | 400 V/m | 400 V/m |
| Electrophoretic Mobility (μ) | 0 m²/V·s | 7.5e-9 m²/V·s | 1.45e-8 m²/V·s |
*Example calculation for veff: veff(Component A) = veo - vcomponentA = (1.90e-5 - 1.60e-5) m/s = 0.30e-5 m/s. The sign indicates direction relative to the EOF.
Diagram 1: Experimental workflow for forensic ink analysis using CE.
Spectral Library Matching and Data Interpretation
Building and Accessing Spectral Libraries
The identification of unknown ink components relies on matching experimental data against reference libraries. Two primary approaches exist:
- Forward In Silico Libraries (Compound-to-Spectrum - C2MS): These are pre-generated libraries where spectra are computationally predicted from known chemical structures. The NORMAN Suspect List Exchange is a key knowledgebase containing over 120,000 compounds of environmental and forensic interest, for which in silico spectral libraries have been generated using tools like CFM-ID [32]. These libraries are freely available and can be directly integrated into software like MZmine or Compound Discoverer.
- Experimental Reference Libraries: These are built from the analysis of known, authentic standards under controlled conditions. Each entry contains the calculated electrophoretic mobility and the UV-Vis absorption spectrum.
Matching Protocol and Confidence Assessment
- Data Export: Export the list of detected features from your CE-PDA data, including the calculated electrophoretic mobility and the UV-Vis spectrum for each peak.
- Library Search: Import the experimental data into your data processing software and perform a search against the chosen in silico or experimental library.
- Multi-Dimensional Matching: A confident identification is based on matching two orthogonal data points:
- Electrophoretic Mobility: The calculated mobility must match the reference value within a defined tolerance (e.g., ±2%).
- Spectral Match: The UV-Vis spectrum of the unknown must closely match the reference spectrum, typically assessed via a cosine similarity score or other spectral comparison algorithms.
- Annotation Confidence: According to the Schymanski scale, an annotation matching both a precise mobility and a spectral profile from a confirmed standard can reach Level 1 (confirmed structure). An annotation based on a high-spectral similarity match to a robust in silico library can achieve Level 3 (tentative candidate) [32].
Diagram 2: Data analysis workflow for mobility calculation and library matching.
The Scientist's Toolkit: Research Reagent Solutions
Table 3: Essential Materials and Reagents for CE Ink Analysis
| Item | Function / Purpose | Example Specifications / Notes |
|---|---|---|
| Fused-Silica Capillary | The separation channel for analytes. | 50 µm ID, 365 µm OD, polyimide coated. Various lengths (40-60 cm common). |
| Sodium Tetraborate (Borate) | Anionic run buffer electrolyte. Maintains stable pH and current. | 25-50 mM concentration, pH 9.3. Ideal for separating anionic dyes. |
| Sodium Hydroxide (NaOH) | For capillary conditioning and regeneration. | 0.1 M - 1.0 M solutions. Critical for maintaining consistent electroosmotic flow. |
| Methanol & Water | Solvents for ink extraction and sample dissolution. | HPLC or LC-MS grade purity. 50:50 (v/v) mixture is typical. |
| Neutral Marker | To measure the electroosmotic flow (EOF). | Acetone or mesityl oxide. Detected by UV at low wavelengths. |
| Internal Standard | Corrects for injection volume and run variability. | A compound not found in inks, e.g., mesityl oxide. |
| In Silico Spectral Library | Database for compound identification via forward matching. | NORMAN SusDat library processed with CFM-ID [32]. |
| Micro-Sampling Tools | For collecting minute ink samples from documents. | Fine-gauge syringes, micromanipulators, or SPME fibers. |
Capillary Electrophoresis (CE) has emerged as a powerful analytical technique for the forensic analysis of ballpoint pen inks, enabling precise discrimination between ink formulations for forgery detection. This technique addresses significant limitations of traditional methods like Thin-Layer Chromatography (TLC), which suffers from poor reproducibility, difficulty in quantifying faint spots, and inability to resolve complex dye mixtures effectively [2]. Within the Technology Readiness Level (TRL) framework for forensic science, CE represents a mature analytical technology (TRL 7-9) that has been systematically validated for casework application, particularly for the examination of questioned documents [33].
The fundamental principle underlying CE for ink analysis involves the separation of ionic ink components based on their electrophoretic mobility in a capillary tube under the influence of an electric field. This technique provides exceptional resolution of dye components and additives found in ballpoint pen inks, enabling forensic examiners to perform both one-to-one comparisons (direct comparison between a questioned sample and a known specimen) and one-to-many comparisons (screening against spectral libraries for source identification) [2] [8]. The application of CE has been demonstrated for both blue and black ballpoint pen inks, with research extending to direct analysis from paper substrates without extensive sample preparation [34].
Comparative Analytical Techniques for Ink Analysis
Capillary Electrophoresis Versus Thin-Layer Chromatography
Table 1: Performance Comparison Between Capillary Electrophoresis and Thin-Layer Chromatography for Ink Analysis
| Parameter | Capillary Electrophoresis | Thin-Layer Chromatography |
|---|---|---|
| Automation Level | Fully automated | Manual processes dominate |
| Reproducibility | High (computer-controlled parameters) | Moderate to Low (user-dependent) |
| Sensitivity | High (detection of minor components) | Moderate (limited by visualization) |
| Sample Throughput | Rapid (multiple samples per hour) | Time-consuming (manual development) |
| Data Output | Electropherograms with UV-Vis spectra | Retardation factor (Rf) values |
| Chemical Identification | Definitive (characteristic UV-Vis spectra) | Presumptive (color comparison only) |
| Multi-component Resolution | Excellent (baseline separation) | Limited (unresolved spots with similar colors) |
| Quantitative Capability | Built-in (peak area/height integration) | Limited (requires densitometry) |
| Library Development | Searchable electronic databases | Physical reference collections |
The superiority of CE for forensic ink analysis is evident across multiple performance metrics. Traditional TLC methods require manual spotting and development, with measurement of retardation factor values that are difficult to reproduce between analysts and laboratories [2]. Furthermore, TLC provides limited spectroscopic data, and when ink samples contain multiple similar dyes, the technique often produces unresolved spots with nearly identical colors, necessitating multiple runs with different solvent systems—a process that is both time-consuming and inefficient for casework applications [2].
In contrast, CE offers complete automation with rapid method development. The incorporation of photodiode array detectors enables collection of ultraviolet-visible spectra (190-600 nm) for each separated component, providing definitive chemical identification beyond simple separation [2] [8]. Data are stored electronically, facilitating the development of automated, searchable libraries of electropherograms and UV-visible spectra while eliminating the need for environmentally controlled storage space required for physical reference collections [2].
Complementary Analytical Techniques in Document Examination
Table 2: Analytical Techniques for Forensic Document Examination
| Technique Category | Example Techniques | Primary Applications in Document Analysis |
|---|---|---|
| Separation Methods | Micellar Electrokinetic Capillary Chromatography (MECC), High Performance Liquid Chromatography (HPLC), Gas Chromatography Mass Spectrometry (GC/MS) | Dye separation, additive profiling, solvent analysis |
| Spectroscopic Methods | Raman spectroscopy, Fourier Transform Infrared (FTIR) spectroscopy, UV-Vis Spectroscopy, MicroSpectroPhotometry (MSP) | Non-destructive analysis, chemical group identification |
| Mass Spectrometry | Direct Analysis in Real Time Mass Spectrometry (DART-MS), ElectroSpray Ionization Mass Spectrometry (ESI-MS), Laser Ablation Inductively Coupled Plasma Mass Spectrometry (LA-ICP-MS) | Molecular weight determination, elemental analysis, structural elucidation |
| Microscopy & Imaging | Hyperspectral imaging, Fluorescence Microscopy, Atomic Force Microscopy (AFM) | Surface topography, indented writing, alterations |
The comprehensive array of analytical techniques available for document examination demonstrates the multi-method approach required for thorough forensic analysis. While CE provides exceptional capabilities for dye separation and identification, techniques such as Raman spectroscopy remain preferred for initial non-destructive analysis to minimize damage to evidentiary documents [33]. The integration of multiple analytical approaches strengthens the scientific validity of forensic conclusions regarding ink composition and document authenticity.
Experimental Protocols for Ink Analysis Using Capillary Electrophoresis
Sample Preparation Protocol
Objective: To extract ink components from paper substrates while minimizing destruction of evidentiary material.
Materials Required:
- Micro-punch or fine-gauge needle (0.5-1.0 mm diameter)
- Glass vials (0.5 mL volume)
- Micro-pipettes (1-10 μL range)
- Extraction solvent (methanol:acetonitrile:water, 50:30:20 v/v/v)
- Centrifuge (micro-volume capable)
- Ultrasonic bath (optional for improved extraction)
Procedure:
- Using a micro-punch or fine-gauge needle, carefully remove 1-2 mm of inked paper from the questioned document.
- Transfer the paper sample to a 0.5 mL glass vial.
- Add 20-50 μL of extraction solvent to completely submerge the paper sample.
- Allow the sample to extract for 10-15 minutes at room temperature with occasional agitation.
- For difficult-to-extract inks, employ brief (5-10 second) ultrasonic treatment.
- Centrifuge the sample at 10,000 rpm for 2 minutes to sediment paper fibers.
- Carefully transfer the supernatant to a clean vial for analysis.
- For direct analysis from paper, recent methodologies enable application of minimal solvent directly to the document with micro-extraction techniques [34].
Critical Considerations:
- Always perform extraction on non-evidentiary areas first when possible.
- Document the exact location of sampling for future reference.
- Use solvent blanks to confirm absence of contamination.
- For cross-line examinations (determining writing sequence), utilize minimal solvent volume to prevent diffusion artifacts.
Capillary Electrophoresis Analysis Protocol
Objective: To separate and identify dye components in ballpoint pen inks for comparative analysis.
Instrument Parameters:
- Capillary: Fused silica, 50 μm internal diameter, 40-60 cm length
- Buffer System:
- For cationic dye separation: 25 mM ammonium acetate, pH 4.6 (with 15% acetonitrile)
- For anionic dye separation: 25 mM borate buffer, pH 9.3
- Detection: UV-Vis photodiode array (190-600 nm)
- Injection: Hydrodynamic, 0.5-1.0 psi for 3-5 seconds
- Voltage: 15-25 kV (positive for cationic, negative for anionic separation)
- Temperature: 25°C controlled
- Run Time: 10-15 minutes per sample
Separation Procedure:
- Condition new capillaries with 1.0 M NaOH for 30 minutes, followed by deionized water for 15 minutes, and run buffer for 15 minutes.
- Between runs, flush capillary sequentially with methanol (1 minute), 0.1 M NaOH (2 minutes), deionized water (2 minutes), and run buffer (3 minutes).
- Inject standards for system suitability testing prior to case samples.
- Analyze extracted ink samples using optimized separation conditions.
- Employ bracketing standards every 5-10 samples to monitor system performance.
- For complex mixtures, utilize micellar electrokinetic chromatography (MEKC) with sodium dodecyl sulfate as micellar phase.
Data Analysis:
- Identify peak components by comparison with known dye standards.
- Calculate electrophoretic mobility for each peak: μ = LdLt / Vt, where Ld = detection length, Lt = total capillary length, V = voltage, t = migration time.
- Compare UV-Vis spectra of unknown peaks against library references.
- For one-to-one comparisons, evaluate both qualitative (peak presence/absence) and quantitative (peak area ratios) parameters.
- Document all data with appropriate metadata for forensic reporting.
CE Workflow for Forensic Ink Analysis
Research Reagent Solutions and Essential Materials
Table 3: Essential Research Reagents and Materials for CE Ink Analysis
| Item Category | Specific Examples | Function in Analysis |
|---|---|---|
| Separation Buffers | 25 mM Ammonium acetate (pH 4.6), 25 mM Borate buffer (pH 9.3), Micellar electrolytes (SDS) | Create electrophoretic environment for dye separation based on charge and size |
| Organic Modifiers | Acetonitrile, Methanol, Ethanol | Improve solubility of hydrophobic dyes, modify separation selectivity |
| Reference Dyes | Crystal Violet, Rhodamine B, Methyl Violet, Basic Blue, Acid Black | System suitability testing, migration time standardization, method validation |
| Capillary Types | Fused silica (50-75 μm ID), Coated capillaries (for reduced adsorption) | Separation channel with controlled electroosmotic flow, minimal sample adsorption |
| Detection Standards | UV-Vis calibration solutions, Wavelength standards | Verify detector performance, ensure spectral accuracy across UV-Vis range |
| Extraction Solvents | Methanol:acetonitrile:water mixtures, Pyridine:water (1:1), DMF | Selective extraction of dye components from paper matrix with minimal co-extraction |
| Quality Controls | Ink reference standards (ASTM, ENFSI), Process blanks | Monitor analytical performance, detect contamination, ensure result reliability |
The selection of appropriate reagents is critical for reproducible and reliable CE analysis of ballpoint pen inks. Buffer systems must be optimized for the specific class of dyes being analyzed—cationic buffers for basic dyes and anionic buffers for acid dyes commonly found in different ink formulations [2] [8]. The inclusion of organic modifiers like acetonitrile is essential for resolving hydrophobic dye components that might otherwise precipitate in aqueous buffers. Reference materials and quality controls aligned with international standards (ASTM, ENFSI) ensure that analytical results are forensically defensible and comparable across laboratories [33].
Data Interpretation and Forensic Application
One-to-One Comparison Methodology
Objective: To determine whether two ink samples originate from the same source.
Interpretation Protocol:
- Qualitative Assessment: Compare electropherogram profiles for presence/absence of peaks. A difference in even one peak component constitutes evidence of different sources.
- Quantitative Assessment: Calculate peak area ratios for major components. Statistically significant differences (typically >10-15% relative standard deviation) may indicate different sources.
- Spectral Verification: Compare UV-Vis spectra for corresponding peaks. Spectral match confirms chemical identity beyond migration time alone.
- Discrimination Power: Studies indicate that identification of five components (dyes and additives) is sufficient to distinguish most blue ballpoint pen inks [2].
Decision Criteria:
- Exclusion: Differences in one or more major components with no technical explanation.
- Inconclusive: Insufficient data quality or excessive background interference.
- Association: No significant differences in all detected components within method variability.
One-to-Many Library Searching
Objective: To identify potential sources of an unknown ink sample by searching against reference collections.
Library Development:
- Data Acquisition: Collect electropherograms and UV-Vis spectra from authenticated reference inks under standardized conditions.
- Feature Extraction: Record migration times, peak areas, and spectral characteristics for all detectable components.
- Database Population: Store data in searchable format with metadata including ink brand, manufacturer, production date, and chemical composition.
- Search Algorithm: Implement similarity scoring based on both migration patterns and spectral matches.
Practical Implementation:
- Initial screening by major dye components (3-5 dominant peaks)
- Secondary discrimination by minor components and additive profiles
- Confirmation by direct comparison with top candidate references
- Consideration of batch-to-batch variation in manufacturer formulations
Ink Comparison Methodology
Quality Assurance and Method Validation
Table 4: Quality Assurance Parameters for CE Ink Analysis
| Validation Parameter | Acceptance Criteria | Testing Frequency |
|---|---|---|
| Migration Time Precision | RSD < 1.5% for major peaks | Each sequence with standards |
| Peak Area Reproducibility | RSD < 5% for replicate injections | Daily system suitability |
| Detection Sensitivity | Signal-to-noise ratio > 10:1 for 0.1% dye standards | Quarterly performance check |
| Spectral Accuracy | >95% match to reference spectra | With each library addition |
| Discrimination Power | >90% differentiation of distinct inks | Method validation study |
| Limit of Detection | Clear identification at 0.5 mm ink line | Annual verification |
Robust quality assurance protocols are essential for maintaining the forensic integrity of CE ink analysis. Method validation must demonstrate that the analytical procedure consistently provides reliable discrimination between different ink sources while correctly associating samples from the same source. Ongoing quality control includes regular analysis of reference materials, participation in proficiency testing programs, and continuous monitoring of system performance parameters [2] [8]. Documentation should comprehensively address the entire analytical process from sample receipt to data interpretation, ensuring transparency and scientific rigor in forensic conclusions.
The implementation of capillary electrophoresis for ink analysis represents a significant advancement in forensic document examination, providing improved sensitivity, discrimination power, and operational efficiency compared to traditional chromatographic methods. As research continues to refine these methodologies, particularly through direct analysis from paper substrates and enhanced library search capabilities, the application of CE in casework will further strengthen the scientific foundation of forensic document examination.
Overcoming Challenges: Optimizing CE Protocols for Robust Ink Analysis
In forensic document analysis, the characterization of ballpoint pen inks directly from paper substrates presents a significant analytical challenge. The primary complication arises from co-extracted interferents from the paper itself, including lignins, fillers, optical brighteners, and sizing agents, which can compromise the resolution and sensitivity of capillary electrophoresis (CE) separations. This application note details standardized protocols to effectively manage this sample complexity, enabling clear, reproducible ink analysis for forensic applications at a high Technology Readiness Level (TRL).
Capillary electrophoresis has emerged as a powerful tool for forensic ink analysis due to its high separation efficiency, minimal sample consumption, and full automation [2]. Unlike thin-layer chromatography (TLC), CE provides electronic data storage, allowing for the development of searchable libraries of electropherograms and UV-visible spectra, thereby enhancing objective comparison and eliminating the need for specialized physical storage [2]. However, the achievement of these advantages is contingent upon effective sample preparation to isolate target ink components from a complex paper matrix.
The Scientist's Toolkit: Essential Research Reagents
The following table catalogues critical reagents and materials required for the effective analysis of ink extracts, with a specific focus on those that mitigate paper-derived interferences.
Table 1: Key Research Reagent Solutions for Ink Analysis via Capillary Electrophoresis
| Reagent/Material | Function/Application | Key Characteristics & Rationale |
|---|---|---|
| Volatile BGE Components (e.g., Ammonium formate/acetic acid buffers) | Form the background electrolyte for CE separation. | Volatility prevents contamination of the MS ion source; low UV-cutoff allows for sensitive UV-Vis detection [35]. |
| Methanol & Acetonitrile | Primary solvents for ink extraction from paper. | Effective at dissolving dye components while modulating the co-extraction of paper interferents. |
| Micellar Additives (e.g., SDS, Thesit) | Pseudostationary phase in Micellar Electrokinetic Chromatography (MEKC). | Enables separation of neutral analytes; can modify selectivity and reduce analyte adsorption to the capillary wall [36]. |
| Capillary Coating Reagents (e.g., Polyethylene glycol) | Dynamically or permanently coats the fused-silica capillary inner wall. | Suppresses electroosmotic flow and analyte-wall interactions, improving migration time reproducibility and peak shape for basic dyes [36]. |
| Solid-Phase Extraction (SPE) Cartridges (C8 or C18 phase) | Clean-up and preconcentration of ink extracts prior to CE. | Removes particulate matter and hydrophobic paper co-extractives like lignins, reducing capillary clogging and contamination [36] [35]. |
Electrophoretic Separation and Detection Strategies
Capillary Electrophoresis Method
The core separation leverages Capillary Zone Electrophoresis (CZE), which differentiates ionic ink components based on their charge-to-size ratio. A cationic method is typically employed, as many common ballpoint pen dyes (e.g., crystal violet, methyl violet) are positively charged.
- Background Electrolyte (BGE): A volatile buffer is essential, particularly for CE-MS applications. A common formulation is 20-50 mM ammonium formate (pH 3.0) adjusted with formic acid. This low pH ensures cationic dyes are fully protonated and suppresses the silanol ionization on the capillary wall, reducing analyte adsorption [35].
- Capillary: Bare or coated fused-silica capillary, 50-75 µm inner diameter, 50-60 cm total length.
- Separation Conditions: Apply +15 to +25 kV. Temperature maintained at 20-25°C.
- Injection: Hydrodynamic injection, typically 0.5-3.0 psi for 5-10 seconds, introducing a small plug of the extracted sample.
For more complex ink formulations containing neutral dyes or additives, Micellar Electrokinetic Chromatography (MEKC) is the mode of choice. MEKC incorporates a surfactant (e.g., SDS) into the BGE at a concentration above its critical micelle concentration, creating a pseudostationary phase that can separate neutral molecules based on their differential partitioning between the micelles and the aqueous buffer [36].
Detection and Data Analysis
Photodiode Array (PDA) detection is highly recommended. Collecting full UV-Vis spectra (e.g., from 200-600 nm) for each migrating peak is crucial for several reasons:
- Peak Purity Assessment: Confirms a single, clean dye peak versus a co-migrating mixture of ink dye and paper interferent.
- Component Identification: Provides a characteristic spectral fingerprint for each dye, which can be compared against a library of known standards [2].
- Enhanced Selectivity: The electropherogram can be extracted at a specific wavelength that maximizes the signal for the target dye while minimizing the response from interferents.
For unambiguous identification, CE can be coupled to Mass Spectrometry (CE-MS). The use of volatile BGEs is a prerequisite for this coupling. MS detection provides molecular weight and structural information, acting as a second dimension of separation and confirmation [35] [2].
Experimental Protocol: Direct Analysis of Ink on Paper
This protocol outlines a complete workflow, from sample preparation to data analysis, optimized for handling co-extracted paper interferences.
Sample Preparation and Clean-up
- Materials: Micro-punch (0.5-1 mm diameter), glass micro-vials, micropipettes, centrifugal filter units (0.45 µm pore size, compatible with organic solvents), SPE cartridges (C18, 1 mL capacity).
Reagents: Extraction solvent (Methanol:ACN:20 mM Ammonium Formate, pH 3.0 = 50:40:10, v/v/v), SPE conditioning solvents (Methanol, followed by the extraction solvent diluted 1:1 with water).
Procedure:
- Sampling: Using a micro-punch, excise 3-5 small (0.5 mm) segments of the inked paper. Take care to sample only the inked area. Critical Step: Also sample an adjacent, non-inked area of the same paper to serve as a procedural blank.
- Extraction: Place the paper segments into a micro-vial. Add 50-100 µL of the extraction solvent. Sonicate for 10 minutes at room temperature.
- Initial Clean-up: Centrifuge the vial at 10,000 x g for 5 minutes to pellet paper fibers and particulates.
- Solid-Phase Extraction (SPE): a. Condition the C18 SPE cartridge with 1 mL of methanol, then equilibrate with 1 mL of diluted extraction solvent. b. Apply the supernatant from step 3 to the cartridge. c. Wash with 1 mL of diluted extraction solvent to elute highly polar paper components. d. Elute the target ink dyes with 100 µL of pure methanol or a stronger solvent like methanol with 1% formic acid. This step effectively retains and concentrates the ink dyes while leaving many paper-derived interferents behind.
- Filtration: Pass the final eluent through a 0.45 µm centrifugal filter. The sample is now ready for CE analysis.
The following workflow diagram summarizes the complete analytical process and its logical progression.
Instrumental Analysis and Data Interpretation
CE Instrument Setup:
- BGE: 50 mM Ammonium Formate, pH 3.0. Filter (0.2 µm) and degas prior to use.
- Capillary: Bare fused-silica, 60 cm total length (50 cm to detector), 50 µm ID. Pre-condition with 0.1 M NaOH for 10 min, water for 5 min, and BGE for 10 min.
- Detection: PDA, 200-600 nm range. Monitor at 214 nm, 254 nm, and 580 nm for common violet and blue dyes.
- Injection: Hydrodynamic, 0.5 psi for 10 s.
- Voltage: +20 kV.
- Temperature: 25°C.
Data Analysis Workflow:
- Blank Subtraction: First, analyze the procedural blank (extract from clean paper). Use software features to subtract the blank electropherogram from the ink sample electropherogram. This step is critical for removing peaks originating from the paper or solvents.
- Peak Identification: Identify peaks in the blank-subtracted electropherogram. Check the peak purity using PDA spectra to ensure they are pure components.
- Library Comparison: Compare the migration times and UV-Vis spectra of the purified peaks against an in-house library of standard ink dyes. The successful differentiation of 10 blue ballpoint pen inks by identifying five components demonstrates the power of this approach [2].
Troubleshooting Common Interference Issues
Table 2: Troubleshooting Guide for Co-extracted Paper Interferences
| Problem | Potential Cause | Recommended Solution |
|---|---|---|
| High, noisy baseline in UV detection | Co-eluting, UV-absorbing paper components (lignins, optical brighteners). | Implement SPE clean-up; use a higher wavelength for detection (e.g., 580 nm for blue/violet dyes); optimize BGE pH to shift dye migration away from the interferent zone. |
| Broad or tailing peaks | Overloading of sample or adsorption of dyes/paper components to capillary wall. | Dilute the sample extract; use a coated capillary to suppress wall interactions; add a dynamic coating agent (e.g., a neutral polymer) to the BGE [36]. |
| Poor migration time reproducibility | Contamination of the capillary by paper co-extractives, altering the electroosmotic flow. | Implement more stringent capillary rinsing between runs (flush with 0.1 M NaOH, water, and BGE); use an internal standard; employ a capillary coating [36]. |
| Low signal for target dyes | Over-dilution from excessive clean-up or inefficient extraction. | Reduce the scale of SPE clean-up; test alternative extraction solvents (e.g., DMF for some dyes); employ an on-line preconcentration technique like field-amplified sample stacking [36]. |
Robust forensic analysis of ballpoint pen inks directly from paper requires a systematic approach to manage co-extracted interferents. The integrated strategy outlined in this application note—combining optimized solvent extraction, targeted SPE clean-up, and high-resolution CE separation with PDA detection—effectively mitigates the complexities introduced by the paper matrix. The implementation of a procedural blank is a non-negotiable step for accurate data interpretation. By following these protocols, forensic scientists can generate reliable, reproducible, and court-defensible data, advancing the TRL of CE-based ink analysis and strengthening the scientific foundation of document examination.
Within the discipline of forensic analytical chemistry, the analysis of questioned documents presents a significant challenge, requiring techniques that are both highly discriminating and minimally destructive. The characterization of ballpoint pen inks is a quintessential example, where the goal is to differentiate between complex mixtures of dyes and additives to link a document to a specific source or to establish authenticity. Capillary Electrophoresis (CE) has emerged as a powerful tool for this purpose, offering high separation efficiency, rapid analysis, and minimal sample consumption [28]. The core principle of CE, the differential migration of charged analytes in an electric field, makes the selection of the separation buffer and the capillary characteristics paramount. The resolution of diverse dye components—which can include cationic, anionic, and neutral species—is highly dependent on the careful optimization of these parameters. This application note details protocols and considerations for maximizing resolution in the CE analysis of ballpoint pen inks, providing a structured guide for forensic researchers and scientists.
Theoretical Background
The separation efficiency in CE is governed by the interplay between electrophoretic mobility and electroosmotic flow (EOF). Understanding these forces is critical for method development.
- Electrophoretic Mobility: This is the movement of charged ions in response to an applied electric field. The mobility of an ion is proportional to its charge and inversely proportional to its atomic radius and the viscosity of the medium [37]. In the context of ink analysis, dye molecules with different charge-to-size ratios will possess different electrophoretic mobilities, enabling their separation.
- Electroosmotic Flow (EOF): EOF is the bulk flow of the buffer solution through the capillary, generated when a voltage is applied to an electrolyte in a fused silica capillary. At a pH above approximately 3, the silanol groups (SiOH) on the capillary inner wall ionize to SiO⁻, creating a negatively charged surface. This attracts a layer of cations from the buffer, which move towards the cathode upon application of voltage, dragging the entire solution with them [37]. The EOF acts as a pump, carrying all analytes, regardless of charge, towards the detector. Its magnitude is strongly dependent on buffer pH and composition.
The selection of the CE separation mode is determined by the nature of the analytes. For ink analysis, two primary modes are most relevant:
- Capillary Zone Electrophoresis (CZE): This is the simplest mode, separating analytes based solely on their differential electrophoretic mobilities in a homogeneous buffer. It is highly effective for charged dye components [28] [4].
- Micellar Electrokinetic Chromatography (MEKC): This mode extends CE's capability to neutral compounds by incorporating a surfactant (e.g., sodium dodecyl sulfate) into the buffer above its critical micelle concentration. The resulting micelles act as a pseudo-stationary phase, allowing for the separation of neutral molecules based on their partitioning between the micelles and the aqueous buffer phase [28] [4]. This is crucial for resolving the full suite of components in a ballpoint pen ink.
The following workflow outlines the key decision points and procedures for developing an optimized CE method for ink analysis:
Experimental Protocols
Buffer Selection and Preparation
The buffer is the heart of any CE separation, controlling pH, ionic strength, and, in modes like MEKC, the chromatographic mechanism.
1. Selection Criteria:
- pKa: The buffering ion's pKa should be within ±1 unit of the desired operating pH for effective buffering capacity [38].
- Buffer Concentration: Higher ionic strengths can improve peak shape via sample stacking but also increase current and Joule heating. A compromise is necessary, often keeping currents below 100 μA for stability [38].
- Counter-Ions: The size and mobility of the buffer's counter-ion can significantly impact current, migration times, and even peak symmetry. For example, switching from a sodium phosphate to a tris-phosphate buffer can reduce current and alter selectivity [38].
Table 1: Commonly Used Buffers in Capillary Electrophoresis for Ink Analysis
| Buffer Name | Useful pH Range | Commonly Used Counter-Ions | Key Considerations for Ink Analysis |
|---|---|---|---|
| Phosphate | 1.1 – 3.1; 6.2 – 8.2 [38] | Sodium, Potassium | Good UV transparency; common for CZE of ionic dyes. |
| Borate | 8.5 – 10.0 [38] | Sodium | Useful for separations at high pH; complexes with diols. |
| "Biological" Buffers (e.g., TRIS, MES) | Varies by buffer (e.g., TRIS: 7.0-9.0) [38] | Often used as free base or with acid | Lower conductivity allows for higher concentrations; good buffering capacity. |
2. Detailed Buffer Preparation Protocol (25 mM Phosphate Buffer, pH 7.0 for CZE):
- Materials: Disodium hydrogen phosphate (Na₂HPO₄), Sodium dihydrogen phosphate (NaH₂PO₄), Deionized water, pH meter, Concentrated phosphoric acid (H₃PO₄) and/or 1 M sodium hydroxide (NaOH).
- Procedure:
- Prepare a 25 mM solution by dissolving the precise mass of the chosen phosphate salt (e.g., Na₂HPO₄) in deionized water.
- Standardize the pH meter with fresh calibration buffers bracketing pH 7.0.
- Under gentle stirring, carefully adjust the buffer pH to 7.00 ± 0.02 using a concentrated acid (e.g., H₃PO₄) or base (e.g., NaOH) as needed.
- Make the buffer up to the final volume with deionized water.
- Filter the buffer through a 0.2 μm or 0.45 μm membrane filter to remove particulate matter.
- Degas the buffer by sonication for 5-10 minutes to prevent bubble formation during electrophoresis.
Critical Note on Reproducibility: The description "25 mM phosphate pH 7.0" is ambiguous. For reproducible results, the standard operating procedure (SOP) must specify the exact salt used (e.g., disodium hydrogen phosphate) and the concentration and volume of the acid/base used for adjustment. Diluting a concentrated stock solution after pH adjustment is not recommended, as it can lead to a significant shift in the final pH [38].
3. MEKC Buffer Modification: To the base buffer (e.g., 25 mM borate, pH 9.0), add a surfactant such as Sodium Dodecyl Sulfate (SDS) to a concentration of 20-100 mM, which is well above its critical micelle concentration. This creates the pseudo-stationary phase necessary for separating neutral dye components [28] [4].
Capillary Selection and Conditioning
The capillary is the conduit for separation, and its properties directly influence the EOF and analyte-wall interactions.
- Dimensions: Standard fused silica capillaries with internal diameters of 25-75 μm and total lengths of 40-80 cm (effective length to detector: 5-10 cm shorter) are typical. Smaller diameters reduce current and Joule heating but may compromise detection sensitivity.
- Surface Modifications: Untreated fused silica is common, but dynamic or permanent coatings can be applied to suppress or reverse EOF, which is beneficial for controlling analysis time and improving reproducibility, particularly for basic analytes that may adsorb to the silanol groups.
New Capillary Conditioning Protocol:
- Flushing: Pressure-flush a new capillary with 1 M NaOH for 10-20 minutes to activate the silanol groups.
- Rinsing: Flush with deionized water for 10 minutes to remove excess NaOH.
- Equilibration: Flush with the run buffer for 10-20 minutes until current and baseline are stable. Daily/Pre-run Conditioning: A shorter flush sequence (e.g., 2-5 minutes each with NaOH, water, and run buffer) is recommended to ensure consistent capillary surface properties between runs. The capillary ends must never be allowed to dry out, as crystallized salts or urea can clog the capillary [39].
Forensic ink analysis demands minimally destructive techniques.
- Direct Sampling Method (Minimally Destructive):
- Using a hole punch or sharp blade, excise a small (∼0.5 mm) disc of paper containing the ink line.
- Affix this disc to a flat surface (e.g., using double-sided tape) inside a modified CE vial inlet.
- Deposit a small volume (∼1 µL) of background electrolyte (BGE) directly onto the ink dot.
- The injector end of the capillary and the electrode are then immersed in this droplet for hydrostatic or electrokinetic injection [6]. This method eliminates time-consuming extraction and centrifugation steps, concentrating the analytes in a tiny volume and making it ideal for precious forensic samples.
- Liquid Extraction Method (Traditional):
- A punch of the inked paper is placed in a microcentrifuge vial.
- A suitable solvent (e.g., methanol, ethanol, acetonitrile) is added.
- The vial is sonicated for several minutes to extract the dyes.
- The solution is centrifuged to pellet any paper fibers before the supernatant is transferred to an injection vial [6].
Results and Discussion
Impact of Buffer and Mode on Separation
The choice of separation mode and buffer system fundamentally alters the analytical output. A study comparing traditional liquid extraction with the novel direct sampling technique for blue, black, and red ballpoint pen inks demonstrated that the direct method not only reduces analysis time but also generates a more concentrated sample plug, leading to improved signal response [6]. Furthermore, the use of MEKC has been shown to successfully differentiate 10 blue ballpoint pen inks based on their dye and additive profiles, with identification of five components being sufficient for discrimination [2]. The ability to obtain ultraviolet-visible (UV-Vis) spectra for each peak via a photodiode array detector adds a powerful orthogonal identification dimension [2].
Table 2: Key Dye Classes in Ballpoint Inks and Corresponding CE Modes
| Dye Class | Typical Charge at Neutral/Basic pH | Recommended CE Mode | Separation Mechanism |
|---|---|---|---|
| Acid Dyes | Anionic [26] | CZE | Differential electrophoretic mobility based on charge/size. |
| Basic Dyes | Cationic [26] | CZE | Differential electrophoretic mobility based on charge/size. |
| Direct Dyes | Anionic [26] | CZE or MEKC | Mobility and/or partitioning into micelles. |
| Disperse Dyes | Neutral [26] | MEKC | Partitioning between the aqueous phase and micelles. |
Troubleshooting and Optimization
Achieving maximum resolution is an iterative process. Key parameters to adjust include:
- Buffer pH: A primary tool for optimization. Changing the pH alters the charge of ionizable analytes and the magnitude of the EOF, dramatically affecting migration times and selectivity [38] [37].
- Buffer Concentration: Increasing concentration can improve resolution by "stacking" the sample but must be balanced against increased current and heating.
- Additives: Organic modifiers (e.g., acetonitrile, methanol) can be added to the buffer (typically 5-20%) to modify selectivity, improve solubility of hydrophobic dyes, and reduce analyte-wall interactions.
The Scientist's Toolkit
Table 3: Essential Research Reagent Solutions for Forensic Ink CE
| Item | Function / Rationale |
|---|---|
| Fused Silica Capillary | The standard separation channel; typically 25-75 μm ID. Untreated for general use. |
| Phosphate & Borate Salts | For preparing background electrolytes for CZE separations of charged dyes. |
| SDS (Sodium Dodecyl Sulfate) | The most common surfactant for creating micelles in MEKC to separate neutral components. |
| Methanol & Acetonitrile | High-purity solvents for liquid extraction of inks and as buffer modifiers. |
| NaOH Solution (1.0 M & 0.1 M) | For capillary conditioning and activation of silanol groups on the capillary wall. |
| pH Standard Buffers | Fresh solutions for accurate calibration of the pH meter, crucial for reproducibility. |
| 0.2 μm Syringe Filters | For removing particulate matter from buffers and extracted samples to prevent capillary clogging. |
The resolution of diverse dye components in ballpoint pen inks via Capillary Electrophoresis is critically dependent on a methodical approach to buffer and capillary selection. The synergy between a well-buffered electrolyte at an optimized pH and an appropriate separation mode (CZE or MEKC) forms the foundation of a robust analytical method. The adoption of minimally destructive sampling techniques, such as direct extraction from paper, further enhances the value of CE in the forensic workflow, preserving precious evidence. By adhering to the detailed protocols for buffer preparation, capillary conditioning, and systematic optimization outlined in this application note, researchers can develop highly discriminating and reproducible methods that contribute significantly to the scientific and legal validity of forensic document analysis.
The forensic analysis of documentary evidence often hinges on the ability to characterize minute quantities of material, such as ballpoint pen inks, without compromising the integrity of the original document. Traditional analytical techniques like thin-layer chromatography (TLC) have served as fundamental tools for forensic document examiners, but they present significant limitations when dealing with micro-samples, including poor resolution, limited sensitivity, and difficulty in quantifying results [2]. The advancement of capillary electrophoresis (CE) has revolutionized this field by offering superior separation efficiency, minimal sample consumption, and enhanced sensitivity for forensic ink analysis.
Within the context of a broader thesis on capillary electrophoresis ballpoint pen ink analysis forensic Technology Readiness Level (TRL) research, this application note addresses the critical need for sensitivity enhancement methodologies. We present detailed protocols and data demonstrating how CE techniques can be optimized to extract maximum information from micro-samples, enabling definitive ink differentiation and characterization even when sample availability is severely constrained. These developments are particularly crucial for addressing the challenges posed by casework involving limited or partially destroyed documents.
Technical Background
Capillary Electrophoresis Fundamentals
Capillary electrophoresis separates analytes based on their differential migration in an electric field applied across a narrow-bore capillary, typically 25-100 μm in internal diameter. The separation mechanism relies on the electrophoretic mobility of charged species in a buffer solution, combined with the electroosmotic flow (EOF) generated at the capillary wall. This combination results in highly efficient separations with plate counts often exceeding 100,000-500,000, significantly higher than traditional chromatographic methods [4].
The forensic application of CE to ink analysis leverages its ability to separate complex mixtures of synthetic dyes, pigments, and additives found in writing instruments. Ballpoint pen inks are particularly challenging analytical targets as they contain multiple chemically similar components that must be resolved for definitive identification. The cationic dye CE method has proven effective for this application, successfully differentiating between 10 blue ballpoint pen inks extracted from mock forensic samples through identification of five key components (dyes and additives) [2].
Advantages Over Traditional Methods
When compared to TLC, the most widely used forensic technique for ballpoint pen ink examinations, CE addresses numerous disadvantages. TLC is not typically automated, making slide spotting and retardation factor measurements difficult to reproduce. Furthermore, TLC does not provide spectroscopic data, and spots are often faint and difficult to visualize, especially when ink samples contain two or more similar dyes with nearly identical colors that result in unresolved spots [2].
In contrast, CE offers complete automation, rapid method development, and the ability to obtain ultraviolet-visible spectra of each separated component via a photodiode array detector. Data can be stored electronically, facilitating the development of an automated, searchable library of electropherograms and UV-visible spectra while eliminating the need for environmentally controlled storage space [2]. The anionic CE buffer has been shown to effectively separate black ballpoint ink dye components with higher sensitivity, faster analysis time, and more definitive chemical identification than TLC procedures [8].
Research Reagent Solutions
The following table details essential materials and reagents required for implementing the capillary electrophoresis protocols for forensic ink analysis:
Table 1: Essential Research Reagents and Materials for CE-Based Ink Analysis
| Item | Function | Specification Notes |
|---|---|---|
| CE Instrument | Separation and detection | With UV-Vis/PDA detector; optional LIF detection |
| Fused Silica Capillaries | Separation channel | Typically 50-75µm ID, 365µm OD; various lengths |
| Borate Buffer | Separation electrolyte | 100 mM, pH 8.0 [40] |
| Methanol (HPLC Grade) | Organic modifier | 20% in borate buffer for improved separation [40] |
| Micro-extraction Tools | Sample collection | Micro-manipulators for sub-millimeter sample excision |
| Ultrasonic Bath | Sample extraction | For efficient extraction of dyes from paper matrix |
| PVDF Membrane Filters | Sample filtration | 0.45 µm for removing particulate matter post-extraction |
Enhanced Sensitivity Protocols
Micro-sample Collection and Extraction
Table 2: Micro-sample Collection and Processing Protocol
| Step | Procedure | Critical Parameters |
|---|---|---|
| 1. Sample Excission | Under microscope, excise 1-2 mm ink line segment using scalpel. | Minimize paper substrate collected with ink. |
| 2. Micro-extraction | Transfer segment to micro-vial; add 20-50 µL extraction solvent. | Solvent choice (e.g., methanol/water mixtures); volume minimization. |
| 3. Ultrasonic Agitation | Sonicate for 10-15 minutes at room temperature. | Controls extraction efficiency; avoids dye degradation. |
| 4. Concentration | Evaporate gently under nitrogen stream; reconstitute in 5-10 µL CE buffer. | Prevents sample loss; maximizes concentration factor. |
| 5. Filtration | Centrifuge or filter through PVDF membrane. | Removes particulates that could clog capillary. |
The sensitivity of the overall analytical process begins with efficient sample collection and preparation. For ink analysis on paper documents, a minimal invasive approach is paramount. The protocol detailed in Table 2 ensures maximum recovery of analytes while preserving the document's integrity. The critical parameter is the minimization of both the sample size and the extraction solvent volume to increase the final concentration of analytes injected into the CE system. Studies have confirmed that CE can effectively analyze inks extracted from paper, showing patterns distinctly different from each other, which is crucial for forensic comparison [40].
Capillary Electrophoresis Separation Method
Table 3: Optimized CE Separation Protocol for Ink Analysis
| Parameter | Specification | Purpose |
|---|---|---|
| Capillary | 50 µm ID, 60 cm total length (50 cm to detector) | Defines separation path and volume. |
| Buffer | 100 mM Borate, pH 8.0, with 20% Methanol [40] | Separation medium; methanol improves resolution. |
| Detection | UV-Vis DAD (190-600 nm) / LIF (if available) | Provides spectral data for component ID. |
| Injection | Pressure (e.g., 0.5 psi for 5-10 s) | Introduces nanoliter sample volume. |
| Voltage | +20 kV (normal polarity) | Drives electrokinetic separation. |
| Temperature | 25°C (controlled) | Ensures run-to-run reproducibility. |
The separation protocol outlined in Table 3 is optimized for the analysis of cationic dyes commonly found in blue and black ballpoint pen inks. The use of a borate buffer at alkaline pH ensures that dye components are ionized and thus separable based on their charge-to-size ratios. The incorporation of 20% methanol modifies the buffer properties to enhance the resolution of structurally similar dyes. This method has been demonstrated to effectively separate dye components with higher sensitivity, faster analysis time, and more definitive chemical identification than TLC procedures [8]. The photodiode array detector is critical for obtaining UV-visible spectra of each peak, enabling component identification based on spectral matching.
Data Analysis and Sensitivity Metrics
Quantitative Sensitivity Assessment
The transition to capillary electrophoresis from traditional methods represents a significant advancement in sensitivity for forensic ink analysis. The following table compares key performance metrics:
Table 4: Sensitivity and Performance Comparison: CE vs. TLC
| Performance Metric | Thin-Layer Chromatography (TLC) | Capillary Electrophoresis (CE) |
|---|---|---|
| Sample Requirement | Several mm of ink line | < 1 mm of ink line sufficient [2] [8] |
| Separation Efficiency | Low to moderate; ~100-1,000 theoretical plates | Very high; 100,000-500,000 theoretical plates [4] |
| Analysis Time | 30-60 minutes (plus drying/visualization) | 10-20 minutes per sample [8] |
| Detection Limit | Low (nanogram range) | High (picogram-femtogram range) [4] |
| Quantitative Ability | Limited (densitometry possible but challenging) | Excellent (direct UV-Vis detection with linear response) |
| Multi-component Resolution | Poor for similar dyes/colors | Excellent, even for structurally similar dyes [2] |
The data in Table 4 clearly demonstrates the superiority of CE for micro-sample analysis. The minimal sample consumption of CE—often in the picoliter injection volume range—is uniquely suited to the constraints of analyzing trace evidence on documents [4]. Furthermore, the technique's ability to handle complex mixtures with high resolution ensures that even inks composed of two or more similar dyes can be successfully differentiated, a scenario that presents significant challenges for TLC, often requiring multiple runs with different solvent systems [2].
Advanced Detection for Enhanced Sensitivity
While UV-Vis detection is robust and widely available, coupling CE with Laser-Induced Fluorescence (LIF) detection can increase sensitivity by several orders of magnitude for fluorescent ink components. Research has shown that fluorescence detection at different excitation and emission wavelengths provides superior sensitivity, though it may add complexity due to the excitation of co-extracted fluorescing paper components [40]. For non-fluorescent analytes, derivatization with fluorescent tags can be employed to leverage the benefits of LIF detection.
Experimental Workflow and Signaling Pathways
The following diagram illustrates the complete experimental workflow for the sensitivity-enhanced analysis of micro-samples from documents, from initial collection to data interpretation:
Figure 1: Experimental Workflow for Micro-sample Analysis
The protocols and data presented in this application note demonstrate that capillary electrophoresis represents a significant advancement in the forensic analysis of micro-samples from documents. The sensitivity enhancements achieved through optimized sample collection, preparation, and CE separation with advanced detection enable definitive characterization of ballpoint pen inks from sub-millimeter samples. This capability is crucial for maintaining the integrity of evidentiary documents while obtaining scientifically defensible results.
The ability to differentiate 10 blue ballpoint pen inks based on the identification of just five components highlights the power of this methodology [2]. Furthermore, the complete automation, electronic data storage, and potential for creating searchable libraries position CE as a superior alternative to traditional TLC for forensic ink analysis. As research in this field continues, further sensitivity improvements through nano-flow techniques and advanced detection methodologies will likely expand the boundaries of what is possible in the analysis of micro-samples from documents.
In forensic science, the analytical technique of capillary electrophoresis (CE) is prized for its high resolution, sensitivity, and minimal sample consumption, making it particularly suitable for analyzing trace evidence such as ballpoint pen inks [4]. However, for results to be admissible in legal proceedings, the methods used must be scientifically sound and reliable. Method validation provides the objective, documented evidence that a specific process consistently produces a result meeting its predetermined acceptance criteria, thereby establishing its fitness for purpose [41]. In the context of courtroom admissibility, recent amendments to Federal Rule of Evidence 702 have underscored the critical role of judicial gatekeeping. Courts must now explicitly determine that "the proponent demonstrates to the court that it is more likely than not that" the expert's testimony is based on sufficient facts or data, is the product of reliable principles and methods, and reflects a reliable application of those principles and methods to the case [42] [43]. This places a heightened emphasis on the need for robust, thoroughly validated methods where the factual basis and application of the methodology are scrutinized at the admissibility stage, not merely treated as a weight-of-evidence issue for the jury [42].
Core Principles of Analytical Method Validation
Validation of an analytical procedure provides assurance of its reliability during routine use. The International Council for Harmonisation (ICH) guidelines, particularly Q2(R2), provide a harmonized framework for validation, defining key characteristics that must be evaluated [41].
Key Validation Parameters
The following parameters are central to demonstrating that a CE method is suitable for forensic ink analysis.
- Specificity: The ability to unequivocally assess the analyte (e.g., a specific dye component in ink) in the presence of other components that may be expected to be present, such as other ink ingredients or paper co-extractants. For CE, this is demonstrated by the resolution of peaks in an electrophoretogram [41].
- Linearity and Range: Linearity is the ability of the method to obtain test results that are directly proportional to the concentration of the analyte within a given range. The range is the interval between the upper and lower concentrations for which linearity, accuracy, and precision have been demonstrated [41].
- Accuracy: The closeness of agreement between the value found and a value accepted as either a conventional true value or an accepted reference value. Accuracy is often established using spiked samples or certified reference materials [41].
- Precision: The closeness of agreement between a series of measurements from multiple sampling of the same homogeneous sample. Precision has three tiers:
- Repeatability: Precision under the same operating conditions over a short interval (intra-day).
- Intermediate Precision: Precision within-laboratory variations (e.g., different days, different analysts, different equipment).
- Reproducibility: Precision between laboratories (as in a collaborative study) [41].
- Detection and Quantitation Limits (LOD & LOQ): The LOD is the lowest amount of analyte that can be detected, but not necessarily quantitated. The LOQ is the lowest amount that can be quantitated with acceptable accuracy and precision [41].
- Robustness: A measure of the method's capacity to remain unaffected by small, deliberate variations in method parameters (e.g., buffer pH, temperature, capillary lot) and provides an indication of its reliability during normal usage [41].
Table 1: Summary of Core Validation Parameters and Typical Acceptance Criteria for a Quantitative CE Ink Method
| Validation Parameter | Objective | Typical Acceptance Criteria (Example) |
|---|---|---|
| Specificity | Resolve analyte from interferences | No interference at analyte peak; Resolution > 1.5 |
| Linearity | Linear relationship of response to concentration | Correlation coefficient (R²) > 0.999 |
| Accuracy | Closeness to true value | Mean recovery of 98–102% |
| Precision (Repeatability) | Agreement under same conditions | Relative Standard Deviation (RSD) ≤ 1.0% |
| Intermediate Precision | Agreement with varied conditions | RSD ≤ 1.5% |
| LOD / LOQ | Sensitivity threshold | Signal-to-Noise: LOD ≥ 3, LOQ ≥ 10 |
| Robustness | Resilience to parameter changes | Consistent results with deliberate, small parameter changes |
Capillary Electrophoresis Methodologies for Ink Analysis
Capillary electrophoresis separates ionic molecules based on their differential migration in an electric field applied across a narrow-bore capillary. The high separation efficiency is ideal for complex mixtures of dyes found in ballpoint inks [4] [5]. Several CE modes are applicable.
Capillary Zone Electrophoresis (CZE)
CZE, the simplest mode, separates charged analytes (e.g., ionic dyes) based on their electrophoretic mobility in a homogeneous buffer. The mobility depends on the analyte's charge-to-size ratio [4] [5]. This is highly effective for separating charged components.
Micellar Electrokinetic Chromatography (MEKC)
MEKC extends CE's utility to neutral molecules by incorporating a surfactant (like sodium dodecyl sulfate) into the buffer above its critical micelle concentration. The micelles act as a pseudo-stationary phase, allowing for the separation of neutral analytes based on their partitioning between the micelles and the aqueous buffer [4]. This is crucial for many dye components that may be neutral.
Diagram 1: MEKC Workflow for Ink Analysis
Experimental Protocol: Method Validation for CE Ink Analysis
This protocol outlines a step-by-step process for validating a CE method for the quantitative analysis of a specific dye in ballpoint pen ink.
Preliminary Method Setup
- Capillary Conditioning: For a new fused-silica capillary, flush with 1.0 M NaOH for 30 minutes, followed by deionized water for 10 minutes and run buffer for 20 minutes. Between runs, a standard rinse protocol (e.g., flush with run buffer for 2-3 minutes) ensures reproducibility [4] [44].
- Background Electrolyte (BGE) Selection: Prepare a borate buffer (e.g., 20-50 mM, pH 9.0-9.5) optimal for dye separation. For MEKC, add SDS to a concentration of 20-50 mM. Filter all buffers through a 0.45 µm or 0.22 µm membrane [4] [45].
- Instrument Parameters: Set the applied voltage to 15-30 kV. Control capillary temperature at 20-25°C. Use hydrodynamic injection (e.g., 3.5 kPa for 5 s). Detection is typically by UV-Vis Diode Array Detector (DAD), with the wavelength set to the maximum absorbance of the target dye (e.g., 580 nm for a blue dye) [4] [5].
Specificity and Separation Optimization
- Sample Preparation: Extract ink samples (e.g., from a written line on paper) with a suitable solvent (e.g., 100 µL of methanol:water (70:30 v/v)) in a micro-vial with sonication for 15 minutes. Centrifuge and transfer the supernatant to an CE autosampler vial [45].
- Run Samples: Individually inject extracts of known, single-dye reference standards and a blank solvent.
- Analyze Data: Confirm that the analyte peak is baseline-resolved from any other peaks and that the blank shows no interference at the same migration time. The resolution (Rs) between the closest eluting peak and the analyte should be >1.5 [41].
Linearity and Range
- Preparation of Standard Solutions: Prepare a minimum of 5 standard solutions of the target dye at different concentrations across the intended range (e.g., 1-50 µg/mL).
- Analysis and Calibration: Analyze each standard in triplicate. Plot the mean peak area versus concentration and perform linear regression analysis.
- Acceptance Criteria: The correlation coefficient (R²) should be greater than 0.999. The y-intercept should not be significantly different from zero [41].
Accuracy
- Spiked Sample Recovery: Spike a blank paper matrix with known quantities of the target dye at three concentration levels (e.g., 80%, 100%, 120% of the target concentration), with a minimum of three replicates per level.
- Calculation: Calculate the percentage recovery for each level: (Measured Concentration / Spiked Concentration) × 100%.
- Acceptance Criteria: Mean recovery should be within 98-102% [41].
Precision
- Repeatability: Using a homogeneous ink sample extract, perform six replicate analyses on the same day by the same analyst using the same instrument.
- Intermediate Precision: Perform the same analysis on a different day, with a different analyst or a different CE instrument (if available).
- Calculation: Calculate the Relative Standard Deviation (RSD%) for the migration time and the peak area (or concentration) for both sets of data.
- Acceptance Criteria: RSD for repeatability should be ≤ 1.0%; for intermediate precision, ≤ 1.5% [41].
Robustness
- Deliberate Variation: Intentionally vary method parameters one factor at a time (e.g., buffer pH by ±0.2 units, capillary temperature by ±2°C, injection time by ±1 s).
- System Suitability Test: For each varied condition, run a system suitability test (e.g., a standard mixture) and monitor key outcomes like migration time, peak area, and resolution.
- Evaluation: The method is considered robust if the system suitability criteria are met under all varied conditions, and the impact on results is minimal [41].
The Scientist's Toolkit: Key Reagents and Materials
Table 2: Essential Research Reagent Solutions for CE Ink Analysis
| Item | Function / Purpose |
|---|---|
| Fused-Silica Capillaries | The separation channel, typically 25-75 µm internal diameter. The polyimide coating provides mechanical strength [5]. |
| Buffer Components (e.g., Borate, Phosphate) | Form the background electrolyte (BGE) necessary for conducting current and controlling pH, which affects analyte charge and separation [45]. |
| Surfactants (e.g., SDS) | Forms micelles in MEKC mode, creating a pseudo-stationary phase for separating neutral molecules [4]. |
| Sodium Hydroxide (NaOH) Solution | For capillary conditioning and routine washing to maintain a consistent capillary surface and electroosmotic flow [44]. |
| Organic Solvents (e.g., Methanol, Acetonitrile) | For sample preparation (ink extraction) and potentially as modifiers in the BGE to alter selectivity [45]. |
| Dye Reference Standards | Certified materials required for method development, calibration, and positive identification of ink components [41]. |
Navigating the Legal Standard: From Validation to Admissibility
The ultimate goal of method validation in a forensic context is to generate evidence that is admissible in court. The 2023 amendment to Federal Rule of Evidence 702 makes the judge's role as a gatekeeper more explicit [42]. The following diagram and framework illustrate how technical validation supports legal admissibility.
Diagram 2: Linking Validation to Legal Admissibility
A validated method directly supports the proponent's burden to demonstrate admissibility by a preponderance of the evidence [43]:
- Sufficient Facts or Data (Rule 702(b)): The validation parameters of accuracy, specificity, and LOD/LOQ demonstrate that the method reliably produces data sufficient to support the expert's opinion.
- Reliable Principles and Methods (Rule 702(c)): The established scientific principles of CE and the optimized, documented methodology constitute a reliable principle and method. Precision data (repeatability, intermediate precision) directly supports its reliability.
- Reliable Application (Rule 702(d)): The robustness study and adherence to the validated method during casework analysis show that the expert has reliably applied the principles and methods to the facts of the case. This is the precise issue the 2023 amendment was designed to emphasize—courts must examine whether the application is reliable, not just the underlying methodology [42].
For forensic researchers analyzing ballpoint pen inks with capillary electrophoresis, a comprehensive method validation is not merely a technical exercise but a foundational pillar for credible and admissible scientific evidence. By systematically addressing the core parameters of specificity, accuracy, precision, linearity, and robustness, scientists build an incontrovertible case for their method's reproducibility and reliability. This technical rigor, meticulously documented, is the most effective means of satisfying the heightened scrutiny of the modern courtroom, ensuring that expert testimony based on CE analysis meets the demanding standards of Federal Rule of Evidence 702 and withstands challenges to its scientific validity.
Within forensic document examination, the chemical analysis of ballpoint pen inks provides critical evidence for determining document authenticity and origin. The integration of capillary electrophoresis (CE) data with digital ink libraries represents a transformative advancement, creating searchable, standardized repositories for forensic ink comparison and identification [2]. This paradigm shift addresses significant limitations of traditional techniques like thin-layer chromatography (TLC), which lacks automation, produces difficult-to-reproduce results, and provides limited spectroscopic data [2]. By implementing standardized CE methodologies with digital library integration, forensic laboratories can achieve unprecedented levels of efficiency, accuracy, and data sharing capabilities in ink analysis.
Capillary Electrophoresis Advantages in Forensic Ink Analysis
Comparative Analysis: CE vs. Traditional Methods
Table 1: Comparison of Ink Analysis Techniques in Forensic Document Examination
| Analytical Characteristic | Thin-Layer Chromatography (TLC) | Capillary Electrophoresis with UV-Vis Detection |
|---|---|---|
| Analysis Time | Slow, multiple runs often required | Rapid analysis with complete automation [8] |
| Sensitivity | Moderate, with faint spots often difficult to visualize | Higher sensitivity for dye components [8] |
| Data Output | Retardation factor values with visual spot comparison | Electropherograms with UV-Vis spectra for each component [2] |
| Sample Preparation | Complex manual spotting | Streamlined, minimal preparation required [8] |
| Compound Identification | Limited to visual comparison unless combined with other techniques | Chemical identification via electrophoretic mobility and characteristic UV-Vis spectra [8] |
| Multi-component Detection | Poor resolution for similar dyes | Effective separation of dyes, solvents, and additives in single experiment [8] |
| Data Storage & Sharing | Physical plates requiring controlled storage | Electronic data compatible with digital libraries [2] |
Technical Foundations of CE-Based Ink Analysis
Capillary electrophoresis separates ink components based on their electrophoretic mobility under the influence of an applied voltage, with detection achieved through UV-visible photodiode array detection (190-600 nm) [8]. This analytical approach enables simultaneous detection of various dye compounds alongside solvents and other ink additives that traditional methods might miss [8]. The resulting data combines both separation profiles (electropherograms) and characteristic spectra for each component, providing two independent parameters for compound identification and discrimination.
For forensic applications, this technical approach has demonstrated exceptional utility in differentiating both blue and black ballpoint pen inks. Research has confirmed that the identification of five components (dyes and additives) proves sufficient to distinguish among 10 blue ballpoint pen inks extracted from mock forensic samples [2]. Similar success has been reported with black ballpoint inks, where CE effectively separates dye components with higher sensitivity and more definitive chemical identification than TLC procedures [8].
Experimental Protocol: CE Analysis of Ballpoint Pen Inks
Sample Collection and Preparation
Materials Required:
- Fine-point micro-tweezers or surgical scalpel
- Micro-extraction vials (200 µL)
- Appropriate extraction solvent (e.g., methanol, ethanol, or DMF)
- Centrifuge for micro-volume processing
- Filtration units (0.45 µm) compatible with organic solvents
- CE autosampler vials
Protocol:
- Using fine-point micro-tweezers or a surgical scalpel, carefully excise a 1-2 mm segment of inked paper containing the writing sample.
- Transfer the paper segment to a micro-extraction vial containing 100-200 µL of appropriate extraction solvent.
- Sonicate the sample for 10-15 minutes to facilitate complete dye extraction.
- Centrifuge the extraction vial at 10,000 rpm for 5 minutes to sediment any particulate matter or paper fibers.
- Transfer the supernatant to a CE autosampler vial through a 0.45 µm filter to prevent capillary blockage.
- For direct paper analysis, recent methodologies enable analysis of ink directly from paper substrates without extensive extraction procedures [34].
Capillary Electrophoresis Analysis Parameters
Table 2: Standardized CE Operational Parameters for Ink Analysis
| Parameter | Cationic Dye Analysis (Blue Inks) | Anionic Dye Analysis (Black Inks) |
|---|---|---|
| Capillary Type | Fused silica, 50 µm internal diameter | Fused silica, 50 µm internal diameter |
| Capillary Length | 50-60 cm total length (40-50 cm to detector) | 50-60 cm total length (40-50 cm to detector) |
| Background Electrolyte | Cationic buffer system (pH 4.5-5.5) | Anionic buffer system (pH 8.5-9.5) [8] |
| Separation Voltage | +15 to +20 kV | -15 to -20 kV |
| Temperature Control | 20-25°C | 20-25°C |
| Detection Method | UV-Vis photodiode array (190-600 nm) | UV-Vis photodiode array (190-600 nm) [8] |
| Injection Parameters | Pressure injection: 5-10 mbar for 5-10 s | Pressure injection: 5-10 mbar for 5-10 s |
| Data Collection Rate | 4-8 Hz | 4-8 Hz |
System Suitability Testing and Quality Control
Quality Control Measures:
- Migration Time Stability: Analyze standard dye mixtures at the beginning of each sequence and after every 10 samples to monitor capillary performance. Acceptance criterion: ≤2% RSD for migration times.
- Resolution Check: Ensure baseline separation of critical dye pairs in standard mixtures.
- Carryover Assessment: Run blank injections (extraction solvent) between samples to confirm absence of cross-contamination.
- Signal-to-Noise Verification: Confirm detector sensitivity meets minimum requirements (typically S/N >10 for target analytes).
Database Integration Framework
Data Standardization and Digital Library Architecture
The integration of CE data with digital ink libraries requires systematic standardization of data formats, metadata requirements, and search algorithms. The fundamental architecture consists of three integrated components: (1) standardized CE instrumentation parameters, (2) validated data processing protocols, and (3) searchable library structures with compatibility for inter-laboratory data exchange.
Metadata Requirements for Library Entries
Each entry in a digital ink library must contain comprehensive metadata to ensure forensic utility and scientific validity:
- Sample Information: Ink manufacturer, production batch, purchase date, pen type
- CE Analysis Parameters: Buffer composition, pH, capillary dimensions, applied voltage, temperature
- Instrumentation Details: Detector specifications, data collection software version
- Quality Metrics: Migration time stability, detection limits, reference standard performance
- Forensic Context: Known associations with document fraud cases, inter-laboratory validation status
Essential Research Reagent Solutions
Table 3: Essential Research Reagents and Materials for CE-Based Ink Analysis
| Reagent/Material | Specification | Forensic Application |
|---|---|---|
| Background Electrolyte Buffers | Anionic and cationic buffer systems at various pH | Separation of dye components based on charge characteristics [8] [2] |
| Reference Dye Standards | Certified purity, documented spectral properties | System suitability testing and migration time normalization |
| Capillary Conditioning Solutions | High purity NaOH, HCl, and ultrapure water | Capillary surface maintenance between analyses |
| Extraction Solvents | HPLC-grade methanol, ethanol, DMF, and acetonitrile | Controlled extraction of ink components from paper substrates [34] |
| Internal Standards | Compounds with defined mobility and detection properties | Quantitative analysis and method validation |
| Quality Control Materials | Certified reference ink samples with documented profiles | Ongoing method verification and inter-laboratory comparison |
Implementation Considerations for Forensic Laboratories
Validation Requirements
Implementation of CE with digital ink libraries requires comprehensive validation including:
- Repeatability and Reproducibility Studies: Determining precision of migration times and peak areas across multiple analyses, instruments, and operators
- Discrimination Power Assessment: Establishing the method's capability to differentiate inks from different sources
- Detection Limit Determination: Identifying minimum sample quantities for reliable analysis
- Robustness Testing: Evaluating method resilience to minor variations in operational parameters
Data Interpretation Guidelines
Standardized interpretation protocols must address:
- Match Criteria Definition: Establishing scientifically-defensible thresholds for positive identification
- Statistical Assessment: Implementing probabilistic approaches to express evidentiary value
- Uncertainty Quantification: Accounting for analytical and sampling uncertainties in conclusions
- Report Writing Standards: Ensuring technical findings are communicated effectively to legal stakeholders
The integration of capillary electrophoresis data with digital ink libraries represents a significant advancement in forensic document examination. This approach leverages the analytical power of CE—with its superior sensitivity, resolution, and chemical specificity—combined with the archival and comparative capabilities of standardized digital libraries [8] [2]. As forensic science continues to embrace digital transformation, this integrated methodology provides a robust, scientifically-defensible framework for ink analysis that surpasses traditional techniques in discrimination power, efficiency, and data sharing capabilities. Implementation of these protocols positions forensic laboratories to more effectively address the challenges of document authentication in legal proceedings while establishing foundations for future advancements through accumulated standardized data.
Benchmarking CE Performance Against Established and Emerging Techniques
Within the field of forensic document examination, determining the origin and age of ink is a critical task for investigating questioned documents. This application note provides a direct comparison of Capillary Electrophoresis (CE) and Thin Layer Chromatography (TLC) for the forensic analysis of ballpoint pen inks. The content is framed within a broader research thesis on the Technology Readiness Level (TRL) of analytical methods for ink dating. We summarize experimental protocols, present quantitative performance data, and visualize analytical workflows to guide researchers in selecting the appropriate technique based on discriminatory power, speed, and cost-effectiveness.
Fundamental Principles and Comparison of Techniques
The core separation mechanisms of CE and TLC are fundamentally different, leading to significant variations in their performance and application suitability.
Thin Layer Chromatography (TLC) and its advanced form, High-Performance TLC (HPTLC), separate ink components based on their differential partitioning between a stationary phase (a silica gel plate) and a mobile phase (a developing solvent) [3]. The separation is driven by capillary action, and components are visualized as colored spots with a characteristic Retention Factor (Rf). HPTLC offers improved resolution and sensitivity over traditional TLC [3].
Capillary Electrophoresis (CE) separates ionic and charged analytes based on their charge-to-size ratio under the influence of a high-voltage electric field within a narrow-bore capillary [46]. The resulting electroosmotic flow provides a flat, "plug-like" profile, minimizing band broadening and granting CE a superior theoretical plate count (often >100,000) compared to pressure-driven chromatographic techniques [46].
Table 1: Fundamental Comparison of TLC/HPTLC and CE Techniques.
| Characteristic | TLC/HPTLC | Capillary Electrophoresis (CE) |
|---|---|---|
| Separation Mechanism | Partitioning between stationary and mobile phases [3] | Electrophoretic mobility (charge-to-size ratio) [46] |
| Driving Force | Capillary action [3] | High-voltage electric field [46] |
| Typical Analysis Time | 30-60 minutes (including development and drying) [3] | Under 15 minutes [46] |
| Flow Profile | Parabolic (laminar) | Flat, "plug-like" (uniform) [46] |
| Theoretical Plates (N) | Lower | High (100,000 to >1,000,000) [46] |
| Sample Consumption | Microliter range | Nanoliter or picoliter range [46] |
| Primary Application in Ink Analysis | Dye component separation and relative aging [3] | High-resolution separation of ionic dye components and additives |
Experimental Protocols
HPTLC Protocol for Ink Analysis
This protocol is adapted from a published forensic case study for the relative dating of ballpoint pen inks [3].
Objective: To separate and compare dye components from questioned and reference ink entries for differentiation and relative age estimation.
Materials & Reagents:
- Stationary Phase: Silica gel 60 F₂₅₄ HPTLC plates (Merck, Germany) [3].
- Developing Solvents: Two solvent systems are recommended:
- Extraction Solvent: A suitable solvent such as ethanol or a mixed solvent system.
- Sample Preparation Tool: Hypodermic needle (e.g., 18G) or micro-puncher to obtain paper microdots (0.9 mm diameter) from ink lines [3].
Procedure:
- Sample Preparation: Punch ~20 microdots from the center of the ink line into a microcentrifuge tube. Extract the dyes with 20 µL of solvent for 30 minutes [3].
- Spotting: Using a microcapillary tube (e.g., Brauband intraMark), spot 1-2 µL of the extracted solution onto the HPTLC plate.
- Development: Place the spotted plate in a saturated developing chamber containing the chosen mobile phase. Allow the solvent front to migrate an appropriate distance (e.g., 70-80 mm).
- Drying & Visualization: Remove the plate from the chamber, air-dry, and observe under visible and UV light. Document the color and position of all spots.
- Data Analysis: Calculate the Retention Factor (Rf) for each spot: *Rf* = (Distance traveled by solute) / (Distance traveled by solvent front) [3]. Compare Rf* values and spot color intensity between questioned and reference samples.
Capillary Electrophoresis Protocol for Ink Analysis
This protocol outlines a generic CE method suitable for the analysis of ionic components in ballpoint inks.
Objective: To achieve high-resolution separation of ionic dyes and additives in ink formulations for precise differentiation.
Materials & Reagents:
- CE Instrument: System equipped with a UV-Vis or Diode Array Detector (DAD).
- Capillary: Fused-silica capillary (e.g., 50 µm internal diameter, 40-60 cm total length).
- Background Electrolyte (BGE): An alkaline buffer (e.g., borate or phosphate, pH 8-10) suitable for separating anionic dyes. Optimal composition requires experimental determination.
- Sample Solvent: Aqueous solvent compatible with the BGE.
Procedure:
- Sample Preparation: Extract ink from a paper substrate using a minimal volume of a suitable solvent (e.g., water, methanol, or mixed solvent). Centrifuge and transfer the supernatant to a CE vial.
- Capillary Conditioning: Before first use, condition the capillary by flushing with 1M NaOH, followed by deionized water, and then the BGE.
- Instrumental Parameters:
- Injection: Hydrodynamic or electrokinetic injection (e.g., 5 kV for 5 s).
- Separation Voltage: Apply high voltage (e.g., 20-30 kV).
- Detection: UV-Vis detection at a wavelength appropriate for the dyes (e.g., 230 nm, 260 nm, or 580-610 nm for crystal violet) [47] [3].
- Temperature: Thermostat the capillary cartridge (e.g., 25°C).
- Data Analysis: Identify analytes based on their migration time. Compare electropherograms of different inks to identify characteristic peak patterns for discrimination.
Results, Data Analysis, and Visualization
Visual Workflows
The following diagrams illustrate the logical workflow for ink analysis using HPTLC and CE, highlighting the procedural steps from sample to result.
HPTLC Ink Analysis Workflow
CE Ink Analysis Workflow
Performance Metrics and Discriminatory Power
Quantitative data from forensic studies and analytical comparisons demonstrate the relative strengths and weaknesses of each technique.
Table 2: Quantitative Performance Comparison of HPTLC and CE.
| Performance Metric | HPTLC | Capillary Electrophoresis (CE) |
|---|---|---|
| Theoretical Plates | Lower | >100,000 [46] |
| Analysis Time | ~60 minutes (including development) [3] | < 15 minutes [46] |
| Sample Volume | Microliters (20 µL extract) [3] | Nanoliters [46] |
| Consumable Cost | Moderate (HPTLC plates, solvents) | Low (inexpensive capillaries, aqueous buffers) [46] |
| Detection Sensitivity | Moderate | Can be limited due to small injection volume [46] |
| Resolution | Good with HPTLC | Very High [46] |
| Greenness / Waste | Moderate organic solvent use | Minimal waste (aqueous buffers) [46] |
| Key Forensic Finding | Effective for relative ink dating via dye degradation tracking [3] | Unparalleled efficiency for charged molecules; superior for differentiating inks with similar dyes but different ionic additives. |
The data shows that CE offers significant advantages in speed, resolution, and operational cost, while HPTLC remains a robust and widely adopted method for specific applications like relative ink aging.
The Scientist's Toolkit: Essential Research Reagents & Materials
Table 3: Key reagents and materials for HPTLC and CE experiments in forensic ink analysis.
| Item | Function/Application | Example/Specification |
|---|---|---|
| Silica Gel 60 F₂₅₄ HPTLC Plates | Stationary phase for the separation of dye components in TLC/HPTLC [3]. | Merck, Germany |
| Micro-Puncher | To obtain standardized paper microdots from ink lines for extraction, minimizing substrate damage [3]. | Hypodermic 18G needle tip |
| Developing Solvents | Mobile phase for developing TLC/HPTLC plates. Different compositions aid in resolving various dye mixtures [3]. | Butanol, Ethyl Acetate, Ethanol, Water |
| Fused-Silica Capillary | The separation channel for CE, where electrophoresis occurs. Different internal diameters and lengths optimize resolution [46]. | 50 µm internal diameter, 40-60 cm length |
| Background Electrolyte (BGE) | The running buffer in CE that conducts current and defines the separation environment (pH, ionic strength) [46]. | Alkaline Borate or Phosphate Buffer (pH 9-10) |
| Crystal Violet (Basic Violet 3) | A common dye in black and blue ballpoint inks; used as a target analyte for absolute dating models using Raman spectroscopy and other techniques [3]. | BDH, UK |
This application note provides a direct comparison of TLC/HPTLC and CE for the forensic analysis of ballpoint pen inks. HPTLC is a well-established, accessible method highly effective for dye-based profiling and relative age estimation through protocols like tracking dye degradation. In contrast, Capillary Electrophoresis emerges as a complementary, high-tech tool offering superior resolution, speed, and green credentials.
For researchers advancing the TRL of forensic ink analysis, the choice of technique depends on the specific question. HPTLC is invaluable for relative dating studies, while CE's high discriminatory power is ideal for differentiating complex ink formulations with subtle compositional differences. A combined approach, leveraging the strengths of both techniques, represents the most robust strategy for modern forensic document examination.
The forensic examination of ballpoint pen inks presents a significant analytical challenge, requiring the precise discrimination of chemically similar materials. While capillary electrophoresis (CE) provides excellent separation and quantification of ink components, spectroscopic techniques like Microspectrophotometry (MSP) and Raman spectroscopy deliver complementary vibrational and electronic information for a more conclusive chemical identification [48] [2]. This application note details the integrated use of these methods, framing them within a research program aimed at advancing the Technology Readiness Level (TRL) of forensic ink analysis. The protocols herein are designed for researchers and scientists seeking to implement a robust, multi-technical approach for the characterization of complex forensic evidence.
Comparative Technical Profiles: CE, MSP, and Raman
The analytical power of this multi-method approach stems from the distinct yet complementary data provided by each technique. The following table summarizes their core capabilities and operational parameters.
Table 1: Technical comparison of Capillary Electrophoresis, Microspectrophotometry, and Raman Spectroscopy for ink analysis.
| Analytical Technique | Principle of Operation | Key Information Obtained | Sample Throughput | Key Forensic Strengths |
|---|---|---|---|---|
| Capillary Electrophoresis (CE) | Separation of ionic/components in a capillary under an electric field [2]. | Number of components, relative concentrations, UV-Vis spectra of individual dyes [2]. | High (automated, rapid method development) [2]. | High sensitivity; automated operation; creates searchable libraries [2]. |
| Microspectrophotometry (MSP) | Measurement of absorption/fluorescence spectra from a microscopic sample area [49] [48]. | Electronic absorption spectrum of the dye mixture; color measurement [48]. | Moderate | Non-destructive; direct measurement on mounted fibres/in situ; provides a "fingerprint" of the dye's color [48]. |
| Raman Spectroscopy | Inelastic scattering of monochromatic light, measuring molecular vibrational modes [48] [50]. | Molecular vibrational fingerprint; chemical structure of dyes and pigments [48] [51]. | Moderate to High (fast spectral acquisition) [48]. | Non-destructive; minimal sample preparation; highly specific dye identification [48]. |
The Scientist's Toolkit: Essential Reagents and Materials
Successful implementation of these protocols requires specific reagents and instrumentation. The following table lists the essential materials for the featured experiments.
Table 2: Key Research Reagent Solutions and Essential Materials.
| Item Name | Function/Application | Specific Example/Note |
|---|---|---|
| Nonaqueous CE Run Buffer | Medium for electrophoretic separation of ink components. | Methanol or acetonitrile-based buffers with additives for selectivity. |
| Histomount Mounting Medium | Synthetic resin for mounting fibre and ink samples on glass slides for MSP/Raman [48]. | Provides a clear, stable medium for microscopic examination without significant spectral interference [48]. |
| GaSe Nonlinear Crystal | Generates mid-infrared pulses via Intra-pulse Difference-Frequency Generation (IDFG) for advanced complementary vibrational spectroscopy [51]. | Used in a 30-µm crystal for broadband coverage of the molecular fingerprint region (790–1800 cm⁻¹) [51]. |
| Ultrashort Pulsed Laser | A single light source for simultaneous IR and Raman spectroscopy (CVS) [51]. | e.g., 10-fs Ti:Sapphire mode-locked laser (75 MHz); enables FT-CARS and IDFG. |
| HgCdTe (MCT) Photodetector | Detection of mid-infrared light for CVS-IR measurements [51]. | Essential for high-sensitivity detection in the fingerprint IR region. |
| Silicon Avalanche Photodetector (APD) | Detection of near-infrared light for CVS-Raman (FT-CARS) measurements [51]. | Used with an optical short-pass filter to detect only the blue-shifted anti-Stokes Raman signal. |
Experimental Protocols
Protocol 1: Analysis of Ballpoint Pen Inks via Capillary Electrophoresis
This protocol is adapted from established forensic methods for the analysis of blue ballpoint pen inks [2].
I. Sample Preparation
- Ink Extraction: Extract a small segment of an inked paper line (approx. 2-5 mm) using a micro-punch. Place the segment into a micro-vial.
- Solvent Extraction: Add 20 µL of a suitable solvent (e.g., methanol, pyridine/water/ethanol mixture) to the vial. Agitate for 10-15 minutes to dissolve ink dyes.
- Sample Dilution: Prior to injection, dilute the extract with an equal volume of the CE run buffer to ensure compatibility with the separation conditions.
II. Instrumental Configuration
- Capillary: Fused silica, 50 µm inner diameter, 50-60 cm total length.
- Detection: Photodiode Array (PDA) detector collecting full UV-Vis spectra (e.g., 200-600 nm).
- Run Buffer: Cationic dye separation buffer, typically a nonaqueous medium such as methanol with additives [2] [34].
- Injection: Hydrodynamic injection, 0.5-1.0 psi for 3-5 seconds.
- Voltage: Apply 20-30 kV for separation.
- Temperature: Maintain a constant temperature (e.g., 25°C).
III. Data Analysis
- Identify components based on their migration times and their characteristic UV-Vis absorption spectra.
- Differentiate inks by the number of components and their relative peak areas. Identification of five components (dyes and additives) is typically sufficient to distinguish inks [2].
Protocol 2: Complementary Spectral Analysis via MSP and Raman
This protocol outlines the non-destructive spectral analysis of ink on paper or mounted fibres, to be performed prior to any destructive extraction for CE [48].
I. Sample Preparation for MSP and Raman
- Direct Measurement: For non-destructive analysis, place the paper sample directly on the microscope stage.
- Mounted Measurement (for fibres): For fibre analysis, tape-lifted fibres can be mounted on a standard glass slide using a synthetic mounting resin like Histomount and covered with a cover slip. This preparation is suitable for both MSP and subsequent Raman analysis without remounting [48].
II. Microspectrophotometry (MSP) Workflow
- Microscopy: First, examine the sample using optical microscopy (bright field and fluorescence) to locate the target fibre or ink line.
- Spectral Acquisition: Position the measurement spot (e.g., 5 µm x 5 µm) directly on the sample.
- Acquire the absorption spectrum across the visible range (e.g., 400-800 nm). This provides a characteristic "fingerprint" of the dye's color.
- Data Interpretation: Compare the absorption maxima and spectral shape to reference libraries. MSP can suggest that fibres "come from a same fibre source" based on highly similar spectra [48].
III. Raman Spectroscopy Workflow
- Follow-on Analysis: Perform Raman analysis directly on the same mounted sample or paper used for MSP.
- Laser Excitation: Select an appropriate laser wavelength (e.g., 785 nm NIR laser) to minimize fluorescence from the ink or paper [48] [50].
- Spectral Acquisition: Focus the laser on the sample and collect the inelastically scattered light. Acquisition times can be very fast (seconds).
- Data Interpretation: The resulting spectrum provides a vibrational fingerprint. The high specificity of Raman allows for "a higher degree of confidence" in identification, as it provides "much more detailed dye spectrum" compared to MSP alone [48].
The logical relationship and workflow for integrating these techniques are illustrated below.
Advanced Methodology: Simultaneous Complementary Vibrational Spectroscopy (CVS)
Emerging technologies are pushing the boundaries of conventional spectroscopy. Complementary Vibrational Spectroscopy (CVS) is a dual-modal Fourier-transform technique that allows for the simultaneous acquisition of IR absorption and Raman scattering spectra from the same sample spot, using a single instrument and a shared ultrashort-pulsed laser source [51].
I. Principle of Operation The system is based on a Michelson interferometer with a near-infrared (NIR) femtosecond laser.
- CVS-IR (FT-IR): The NIR pulses generate mid-infrared (MIR) pulses via intra-pulse difference-frequency generation (IDFG) in a nonlinear crystal (e.g., GaSe). The MIR double pulses are modulated by IR-active molecular absorptions in the sample [51].
- CVS-Raman (FT-CARS): The same NIR double pulses are used for Fourier-transform coherent anti-Stokes Raman scattering. The first pulse vibrationally excites the sample, and the second probes it, generating a blue-shifted signal that is detected [51].
II. Key Instrumental Parameters for CVS [51]
- Laser Source: 10-fs Ti:Sapphire mode-locked laser (75 MHz).
- NIR Spectrum: 10,870–14,490 cm⁻¹ (690–920 nm).
- MIR Spectrum: 790–1800 cm⁻¹ (covers molecular fingerprint region).
- Spectral Resolution: ~3.5 cm⁻¹ for IR, ~5.5 cm⁻¹ for Raman.
- Detectors: HgCdTe (MCT) photodetector for MIR (CVS-IR); Silicon Avalanche Photodetector (APD) for NIR (CVS-Raman).
The advanced configuration of a CVS system, demonstrating the shared optical path for dual-modal detection, is shown in the following diagram.
The integration of capillary electrophoresis with spectroscopic methods like MSP and Raman creates a powerful, orthogonal framework for forensic ink analysis. CE provides high-resolution component separation, while MSP and Raman offer rapid, non-destructive screening and highly specific chemical identification. The continued development of integrated techniques, such as simultaneous CVS, promises to further enhance the precision, speed, and evidential weight of forensic science research, thereby elevating the overall Technology Readiness Level of analytical protocols in the field.
In forensic science, the analysis of physical evidence relies on a spectrum of analytical techniques, broadly categorized as either destructive or non-destructive. Non-destructive testing (NDT) encompasses methods that evaluate material properties and component integrity without causing any damage to the specimen, preserving the evidence for future examination or court proceedings [52] [53]. Conversely, destructive testing involves sacrificing the sample to understand its performance or behavior by determining its exact point of failure [52]. This distinction is critically important in forensic contexts, where evidence integrity is paramount.
The analysis of ballpoint pen inks on questioned documents presents a classic forensic challenge, requiring techniques that can differentiate between ink formulations with high specificity. This application note examines the roles of Capillary Electrophoresis (CE) and Mass Spectrometry (MS) within this framework, framing them against the destructive/ non-destructive paradigm and providing detailed protocols for their application in forensic research and development.
Technical Comparison: Capillary Electrophoresis vs. Mass Spectrometry
Fundamental Principles and Analytical Characteristics
Capillary Electrophoresis (CE) is a separation technique that resolves ionic and charged species based on their electrophoretic mobility in a buffer-filled capillary under the influence of a high-voltage electric field [54]. When applied to ink analysis, it separates the various dye components. Mass Spectrometry (MS) is an analytical technique that identifies compounds based on their mass-to-charge ratio ((m/z)) after ionization. It can provide definitive identification of ink components [2]. The hyphenated technique, CE-MS, combines the high-resolution separation of CE with the powerful identification capabilities of MS [54] [55].
Table 1: Core Characteristics of CE and MS Techniques
| Feature | Capillary Electrophoresis (CE) | Mass Spectrometry (MS) | Hyphenated CE-MS |
|---|---|---|---|
| Analytical Principle | Separation based on charge and size in an electric field [54]. | Identification based on mass-to-charge ((m/z)) ratio [2]. | Sequential separation then mass-based identification [54]. |
| Destructive Nature | Minimally destructive/destructive. Often requires a small punch sample from the document, though direct sampling methods are emerging [6]. | Typically destructive. Sample is consumed during the ionization process. | Destructive. Involves sample consumption for separation and detection. |
| Sample Throughput | High; fast separation times (minutes) [54]. | Varies; can be very fast with direct analysis. | Moderate; includes separation time prior to detection. |
| Information Provided | Qualitative and semi-quantitative profile of dye components [6] [2]. | Molecular weight and structural information for definitive identification [2]. | Both separation profile and molecular identity for each component [54]. |
| Forensic Utility | Excellent for comparative analysis of ink dye profiles [2]. | Powerful for identifying specific dyes and additives [2]. | Comprehensive characterization of complex ink mixtures [54]. |
Advantages and Disadvantages in Forensic Context
Capillary Electrophoresis (CE):
- Advantages: The technique is fully automated, requires low solvent consumption, generates almost no waste, and is considered minimally destructive due to very low sample consumption [6] [2]. It provides high-resolution separation of complex dye mixtures and can be coupled with a photodiode array detector to obtain UV-Vis spectra for each component [2].
- Disadvantages: Traditional CE with absorbance detection (CE-UV) may lack the specificity for unambiguous identification of unknown dyes and can have lower selectivity compared to liquid chromatography (LC) [54] [2].
Mass Spectrometry (MS), particularly standalone ambient techniques like DART-MS:
- Advantages: Offers high specificity and sensitivity, enabling the direct detection of chemical compounds on complex surfaces with minimal or no sample preparation [56]. It provides rapid analysis and is excellent for targeted compound identification.
- Disadvantages: Can be destructive and may suffer from ion suppression in complex mixtures, where the presence of one analyte suppresses the ionization of another [56].
Hyphenated CE-MS:
- Advantages: This technique combines the high-resolution separation of CE with the unmatched identification power of MS, mitigating ion suppression and providing a comprehensive analysis of all ink components [54]. It is highly sensitive and can be used for the discovery of unknown components.
- Disadvantages: The coupling presents technical challenges, requires optimization of the interface, and is a destructive technique. The instrumentation is more complex and costly than standalone CE or MS [54] [55].
Table 2: Comparative Analysis of Destructive vs. Non-Destructive Aspects
| Aspect | Non-Destructive Testing (NDT) Concept | Destructive Testing Reality (CE & MS) |
|---|---|---|
| Evidence Preservation | The original evidence is kept completely intact for future re-examination [52] [53]. | A portion of the evidence is consumed and cannot be recovered. |
| Cost & Resources | Generally more cost-effective as the component remains usable [53]. | Incurs costs from the destruction of evidence and potential need for re-sampling. |
| Analysis Objective | Ideal for initial screening, verification, and surface-level flaw detection [57]. | Necessary for in-depth chemical characterization and definitive identification. |
| Forensic Workflow | Used when the same evidence must be analyzed by multiple techniques or parties. | Often the final analytical step due to the consumption of the sample. |
Experimental Protocols for Ink Analysis
Protocol 1: Conventional CE Analysis of Ballpoint Pen Inks
This protocol is adapted from established forensic methods for the comparative analysis of ink dyes [2] [6].
1. Principle: Dye components are extracted from a small section of inked paper and separated by CE based on their electrophoretic mobility under an applied voltage, followed by UV-Vis detection.
2. Research Reagent Solutions & Materials:
- Sample Vials: Universal plastic vials or microcentrifuge vials.
- Extraction Solvent: Methanol, ethanol, or acetonitrile (HPLC grade).
- Background Electrolyte (BGE): Optimized buffer solution, e.g., containing ammonium acetate [6].
- Capillary: Fused silica capillary, typically 50-100 cm length, 50 µm internal diameter.
- Reference Material: Ballpoint pen ink samples of known origin for database building.
3. Procedure: 1. Sampling: Using a precision punch, remove a 1-2 mm diameter core from an inked line on the document. 2. Extraction: Place the paper punch into a microcentrifuge vial containing 50-100 µL of extraction solvent (e.g., methanol). Sonicate for 5-10 minutes. 3. Centrifugation: Centrifuge the sample at high speed (e.g., 10,000 rpm) for 2-5 minutes to sediment paper fibers and particulate matter. 4. Instrument Setup: * Install the fused silica capillary. * Fill the capillary and electrode reservoirs with the selected BGE. * Set the detector to an appropriate wavelength (e.g., 580 nm for blue inks, 490 nm for red inks). 5. Injection: Introduce the purified extract into the capillary via pressure or electrokinetic injection. 6. Separation: Apply a separation voltage (e.g., +25 kV to -25 kV, depending on analyte charge) [6]. 7. Data Analysis: Compare the electropherogram (a plot of detector response vs. migration time) of the questioned sample against known reference samples.
Diagram 1: CE Ink Analysis Workflow
Protocol 2: Direct Sampling CE Analysis of Ballpoint Pen Inks
This novel protocol reduces sample preparation time and is minimally destructive [6].
1. Principle: Ink dyes are extracted and injected directly from a small paper punch placed within the CE instrument, eliminating the separate extraction, centrifugation, and vial transfer steps.
2. Research Reagent Solutions & Materials:
- Background Electrolyte (BGE): As in Protocol 1.
- Specialized Vial/Lid: A vial or sampling device that can hold a small paper punch stationary.
- Double-Sided Tape: To secure the paper punch.
3. Procedure: 1. Sampling: As in Protocol 1, obtain a small paper punch from the inked line. 2. Sample Loading: Secure the paper punch onto the sampling device using double-sided tape. 3. Direct Extraction/Injection: * Position the sampling device in the CE autosampler. * The CE instrument's robotic arm positions the capillary inlet over the paper punch. * A small volume of BGE is deposited onto the punch to dissolve the ink. * The dissolved ink is then directly injected into the capillary via pressure or vacuum. 4. Separation & Detection: Identical to steps 6 and 7 in Protocol 1.
Protocol 3: CE-MS for Biomarker-Level Ink Characterization
For a comprehensive analysis, CE can be coupled to MS. This protocol is adapted from general CE-MS principles used in proteomics and metabolomics [54] [55].
1. Principle: Separated ink components from the CE capillary are introduced into a mass spectrometer via an electrospray ionization (ESI) interface for accurate mass determination and structural analysis.
2. Research Reagent Solutions & Materials:
- All materials from Protocol 1.
- Sheath Liquid: For sheath-flow interfaces, a compatible solvent mixture (e.g., isopropanol:water 50:50 v/v with 0.1% formic acid) is required [55].
- CE-MS Interface: A commercial ESI source designed for CE-MS coupling.
3. Procedure: 1. Sample Preparation: Follow steps 1-3 from Protocol 1. 2. CE-MS Interface Setup: * Install the CE-MS interface according to the manufacturer's instructions. * Connect the CE capillary to the ESI emitter. * For sheath-flow interfaces, set the sheath liquid flow rate to the recommended value (e.g., a few µL/min). 3. MS Parameter Tuning: * Set the mass spectrometer to positive or negative ion mode, depending on the target dyes. * Optimize ion source parameters (e.g., capillary voltage, cone voltage, desolvation temperature). 4. Data Acquisition: Run the sample and acquire data in full-scan MS or MS/MS mode for structural elucidation.
Diagram 2: CE-MS Analysis Workflow
The Scientist's Toolkit
Table 3: Essential Research Reagent Solutions for Forensic Ink Analysis by CE and MS
| Item | Function/Application | Technical Notes |
|---|---|---|
| Fused Silica Capillaries | The separation channel for CE. | Cost-effective, mechanically strong; may require coating to prevent analyte adsorption [55]. |
| Background Electrolyte (BGE) | The conductive medium that transports analytes through the capillary. | Composition (e.g., ammonium acetate buffer, pH) is critical for separation efficiency and MS compatibility [54] [55]. |
| Sheath Liquid | Enables stable electrical contact and spray formation in sheath-flow CE-MS interfaces. | Typically a mixture of water and organic solvent (e.g., isopropanol) with a volatile acid or base [55]. |
| Extraction Solvents (e.g., Methanol) | To dissolve and extract dye components from the paper matrix. | Must be high purity to avoid introducing contaminants; sonication improves extraction yield [6]. |
| Calibration Standard | For mass accuracy calibration of the MS instrument. | A solution of known compounds with masses spanning the expected range of ink components. |
In the field of forensic document examination, the analysis of ballpoint pen inks presents a significant challenge that necessitates precise and reliable analytical techniques. For decades, Thin-Layer Chromatography (TLC) has been the predominant method for forensic ink analysis, yet it suffers from limitations in reproducibility, automation, and resolution [2]. The advent of Capillary Electrophoresis (CE) offers a powerful alternative, addressing many of TLC's disadvantages while providing superior sensitivity and automation capabilities [2]. This application note explores the strategic integration of CE within a comprehensive multi-modal analytical workflow, demonstrating how the combination of complementary techniques maximizes the intelligence gained from limited forensic samples while preserving evidence integrity.
Capillary Electrophoresis vs. Traditional Chromatography: A Technical Comparison
Capillary Electrophoresis separates ionic compounds based on their electrophoretic mobility under the influence of an electric field, providing exceptional resolution for the dyes and additives present in ballpoint pen inks. When compared against Traditional Thin-Layer Chromatography, the advantages of CE become quantitatively clear as detailed in Table 1.
Table 1: Comparative Analysis of Capillary Electrophoresis versus Thin-Layer Chromatography for Ink Analysis
| Analytical Feature | Capillary Electrophoresis (CE) | Thin-Layer Chromatography (TLC) |
|---|---|---|
| Automation Level | Fully automated | Manual process |
| Method Development | Rapid | Time-consuming |
| Reproducibility | High | Difficult to reproduce |
| Data Output | Electronic (electropherograms, UV-Vis spectra) | Physical plate (visual spots) |
| Spectral Data | UV-Visible spectra via photodiode array | Not typically available |
| Component Resolution | High-resolution separation | Potential for unresolved spots |
| Sample Library | Automated, searchable library possible | Not feasible |
The implementation of CE in a forensic laboratory addresses numerous TLC limitations. CE is completely automated, and method development is rapid. Furthermore, a photodiode array detector can be used to obtain ultraviolet-visible spectra of each separated component [2]. This data can be stored electronically, facilitating the development of an automated, searchable library of electropherograms and ultraviolet-visible spectra, thereby eliminating the need for extensive physical storage space [2].
The Multi-Modal Workflow: CE as a Central Pillar
A robust forensic analysis rarely relies on a single technique. A multi-modal approach leverages the strengths of various analytical tools to build a more compelling and defensible profile of the evidence. Capillary Electrophoresis serves as a central pillar in this workflow, complemented by spectroscopic and mass spectrometric techniques as shown in Figure 1.
Figure 1: A multi-modal workflow for forensic ink analysis, showcasing the integration of non-destructive, separation, and confirmatory techniques. CE provides a crucial link between initial screening and advanced structural analysis.
This workflow aligns with the broader trend in analytical science where multi-modal approaches provide a more comprehensive understanding than any single data stream could achieve alone [58]. In this context, CE acts as a high-resolution separation technique that can be directly informed by non-destructive tests and can subsequently guide more targeted mass spectrometric analysis.
Essential Research Reagent Solutions
The successful application of CE for ink analysis relies on a suite of specific reagents and materials. Table 2 details the key components of the required research toolkit.
Table 2: Key Research Reagent Solutions for CE-based Ink Analysis
| Reagent / Material | Function / Purpose |
|---|---|
| Running Buffer (e.g., Alkaline Borate) | Provides the conductive medium and pH control for separation of ionic dye components. |
| Methanol or Ethanol (HPLC Grade) | Primary solvent for efficient extraction of dyes from ballpoint ink lines on paper. |
| Deionized Water | Dilution and preparation of aqueous solutions; capillary rinsing. |
| Fused Silica Capillaries | The separation channel where electrophoretic migration occurs. |
| Standard Cationic Dye Mixtures | System suitability testing and quality control; calibration of migration times. |
| NaOH Solution | Capillary conditioning and cleaning between runs to maintain performance. |
Detailed Experimental Protocols
Protocol: Ink Sample Preparation for CE Analysis
Principle: To efficiently extract the dye components from a paper substrate with minimal contamination and maximal recovery.
Materials:
- Sample paper containing a ~2-3 mm segment of ink line.
- Micro-tweezers and scalpel.
- 100 µL micro-insert vials.
- Methanol (HPLC grade).
- Micropipettes.
- Ultrasonic bath.
Procedure:
- Excise Sample: Using a scalpel, carefully excise a 2-3 mm segment of the ink line.
- Transfer to Vial: With micro-tweezers, place the excised paper segment into a 100 µL micro-insert vial.
- Solvent Addition: Pipette 50 µL of HPLC-grade methanol into the vial, ensuring the paper segment is fully submerged.
- Extraction: Place the vial in an ultrasonic bath for 10 minutes to facilitate dye extraction.
- Centrifuge: Briefly centrifuge the vial to concentrate the extract at the bottom.
- Transfer: The supernatant is now ready for direct injection into the CE system. If necessary, the extract can be diluted with the CE running buffer.
Protocol: Cationic Dye Separation via Capillary Electrophoresis
Principle: To separate and identify the cationic (basic) dyes present in ballpoint pen inks based on their differential electrophoretic mobility in an alkaline buffer.
Materials:
- Capillary Electrophoresis system with Photodiode Array (PDA) detector.
- Fused silica capillary (e.g., 50 µm inner diameter, 50 cm effective length).
- Alkaline borate buffer (e.g., 20-50 mM, pH ~9.0).
- Standard dye solutions for migration time calibration.
Procedure:
- Capillary Conditioning: Before first use, flush the new capillary with 1M NaOH for 30 minutes, followed by deionized water for 15 minutes and running buffer for 20 minutes.
- System Setup: Set the detector wavelength to a broad range (e.g., 200-600 nm) for full spectral collection. Apply a separation voltage of 15-30 kV. Temperature should be controlled (e.g., 25°C).
- Injection: Hydrodynamically inject the sample for a specified period (e.g., 5-10 seconds at 0.5 psi).
- Separation: Run the method for 10-15 minutes, monitoring the electropherogram and collecting full UV-Vis spectra for each migrating peak.
- Data Analysis: Identify components based on their migration times relative to standards and their characteristic UV-Vis spectra. The identification of five components (dyes and additives) is typically sufficient to distinguish different inks [2].
Protocol: Integration with Direct Analysis in Real Time Mass Spectrometry (DART-MS)
Principle: To confirm the molecular identity of the separated components observed in the CE analysis.
Procedure:
- CE Guidance: Use the CE electropherogram and UV-Vis spectra to identify target dyes of interest.
- Direct Analysis: A separate, non-extracted ink sample on paper can be analyzed directly using DART-MS [33].
- Data Correlation: Correlate the ionic masses obtained from DART-MS with the migration times and spectral data from CE. This multi-modal correlation provides a higher level of confidence in compound identification than any single technique alone. Direct infusion electrospray ionization mass spectrometry (ESI-MS) can also be used for this confirmatory role [2].
Workflow Integration and Data Synthesis Logic
The power of a multi-modal workflow lies in the intelligent synthesis of data from each analytical step. The logical pathway for integrating results from CE and complementary techniques to reach a definitive conclusion is illustrated in Figure 2.
Figure 2: The logical relationship for data synthesis in a multi-modal workflow. Data from complementary techniques are fused to form a definitive conclusion.
This integrated approach is critical for avoiding the pitfalls of relying on a single data perspective, which can lead to misinformation or incomplete intelligence [59]. By cross-validating results across multiple techniques, the forensic scientist can build a robust and legally defensible case.
Capillary Electrophoresis represents a significant advancement in the forensic analysis of ballpoint pen inks, offering automation, high resolution, and rich spectral data. However, its true potential is unlocked when it is deployed as part of a carefully designed multi-modal workflow. The protocols and workflow detailed in this application note provide a framework for leveraging CE in concert with other spectroscopic and spectrometric techniques. This holistic approach maximizes the informational yield from precious forensic evidence, ensuring accurate, reliable, and defensible intelligence for the questioned document examiner.
Within the modern forensic laboratory, the analysis of questioned documents, particularly ballpoint pen inks, presents a significant challenge requiring highly discriminatory and reliable techniques. This application note details the established role of Capillary Electrophoresis (CE) for the forensic analysis of ballpoint pen inks, framing its utility within a Technology Readiness Level (TRL) assessment. TRL is a systematic metric used to assess the maturity of a particular technology, with levels ranging from 1 (basic principles observed) to 9 (actual system proven in operational environment) [60]. The evidence demonstrates that CE for ink analysis has progressed beyond fundamental research and validation, achieving a high TRL indicative of a proven, operational technology within the forensic toolkit [2] [33]. We provide herein a detailed protocol and supporting data to guide laboratory scientists in the implementation of this robust methodology.
Technology Readiness Assessment
Based on its documented development and application, Capillary Electrophoresis for forensic ink analysis can be classified at TRL 8, defined as a system that is complete, qualified, and ready for implementation [60]. The technology has been successfully demonstrated in a forensic operational environment.
Table 1: TRL Assessment of Capillary Electrophoresis for Forensic Ink Analysis
| TRL Level | Description | Status of Capillary Electrophoresis for Ink Analysis |
|---|---|---|
| TRL 1 | Basic principles observed and reported | Basic principles of CE separation of dyes established. |
| TRL 2 | Technology concept formulated | Application of CE to ink analysis proposed. |
| TRL 3 | Experimental proof of concept | First analytical studies published demonstrating ink differentiation. |
| TRL 4 | Technology validated in lab | Component pieces (e.g., separation capillary, detector) tested in lab environment. |
| TRL 5 | Technology validated in relevant environment | Fidelity of model tested in simulated forensic conditions. |
| TRL 6 | Technology demonstrated in relevant environment | A fully functional prototype/system demonstrated. |
| TRL 7 | System prototype demonstration in operational environment | Working model demonstrated in a forensic lab. |
| TRL 8 | System complete and qualified | CE system has been tested and "flight qualified" and is ready for implementation [60] [2]. |
| TRL 9 | Actual system proven in operational environment | Proven through successful mission operations [60]. |
Quantitative Performance Data
CE offers a high-performance alternative to traditional methods like Thin-Layer Chromatography (TLC). The following data, derived from validated studies, summarizes its key performance metrics for blue ballpoint pen ink analysis.
Table 2: Performance Comparison: CE vs. Thin-Layer Chromatography (TLC)
| Feature | Capillary Electrophoresis (CE) | Thin-Layer Chromatography (TLC) |
|---|---|---|
| Automation | Fully automated; minimal manual intervention [2] | Manual spotting and development; difficult to reproduce [2] |
| Data Output | Electropherogram with UV-Vis spectra for each component; electronically stored [2] | Retardation factor (Rf) values; spots may be faint and difficult to visualize [2] |
| Spectral Data | UV-Vis spectra obtained via photodiode array detector for component identification [2] | No spectroscopic data obtained; densitometry requires known standards [2] |
| Resolution | High; can separate dyes with similar structures [44] [2] | Moderate; unresolved spots with nearly identical colors may occur [2] |
| Analysis Time | Rapid method development and analysis [2] | Time-consuming, especially if multiple solvent systems are needed [2] |
| Sensitivity | Successfully differentiated 10 blue ballpoint pen inks from mock forensic samples [2] | Limited by visual detection of spots |
Experimental Protocol: Cationic Dye Analysis of Ballpoint Pen Inks by CE
Principle
This method separates and identifies the cationic (basic) dyes and additives present in ballpoint pen inks based on their differential migration in an electrical field within a fused-silica capillary. The resulting electropherogram serves as a chemical fingerprint for ink discrimination and comparison [2].
The Scientist's Toolkit: Research Reagent Solutions
Table 3: Essential Reagents and Materials
| Item | Function / Specification |
|---|---|
| Capillary Electrophoresis System | Instrument equipped with a photodiode array (PDA) or UV-Vis detector. |
| Fused-Silica Capillary | Standard capillary with an internal diameter of 50-75 µm. |
| Background Electrolyte (BGE) | Aqueous buffer, typically ammonium acetate/ammonium nitrate, pH ~4.5. |
| Extraction Solvent | Methanol or a mixture of methanol and water for dissolving ink samples from paper. |
| Standard Solutions | Solutions of known cationic dyes (e.g., Crystal Violet, Methyl Violet, Rhodamine) for peak identification and method calibration. |
| Syringe Filters | 0.45 µm filters for purifying extracted ink samples prior to injection. |
Workflow Diagram
The following diagram outlines the logical workflow for the forensic analysis of ballpoint pen inks using Capillary Electrophoresis.
Step-by-Step Procedure
Sample Preparation:
- Using a fine needle or scalpel, carefully excise a 1-2 mm segment of an inked paper line.
- Place the paper segment into a micro-centrifuge tube.
- Add 50 µL of extraction solvent (e.g., methanol).
- Sonicate the sample for 15 minutes to facilitate ink extraction.
- Centrifuge the sample at high speed for 5 minutes to pellet the paper debris.
- Transfer the supernatant to a CE sample vial [2].
Instrument Setup:
- Install a fused-silica capillary of appropriate length (e.g., 50-60 cm effective length) into the CE instrument.
- Set the detector wavelength(s); a common setting is 210 nm for cationic dyes, though a PDA detector is preferred for full spectral collection.
- Set the capillary temperature (e.g., 25°C).
- Fill the capillary and buffer vials with the chosen Background Electrolyte (BGE).
Capillary Electrophoresis:
- Injection: Inject the sample hydrodynamically (e.g., 0.5 psi for 5-10 seconds).
- Separation: Apply a separation voltage (e.g., 20-30 kV with reversed polarity, cathode at the detection side) to initiate the run. The cationic dyes will migrate towards the cathode and be separated based on their charge and size [44] [2].
- Detection: As separated components pass the detector, the data system records the signal, generating an electropherogram.
Data Analysis:
- Identify the migration times and peak areas of the detected components.
- Use the PDA data to obtain the UV-Vis spectrum for each peak, aiding in dye identification by comparison with known standards.
- Compare the electropherogram of the unknown ink to those in a laboratory library or to a known reference sample. The presence of five or more components (dyes and additives) is typically sufficient to distinguish between different inks [2].
Analytical Pathway for Ink Differentiation
The core strength of CE lies in its ability to separate complex mixtures into individual components for definitive identification. The following diagram illustrates the analytical decision pathway for ink differentiation.
Capillary Electrophoresis is a mature and highly effective technology (TRL 8) for the forensic analysis of ballpoint pen inks. Its advantages in automation, resolution, and the ability to gather spectral data directly from components make it a superior choice for modern laboratories moving beyond traditional TLC. The protocol outlined herein provides a reliable framework for implementing this technology to achieve definitive ink discrimination in questioned document examination.
Conclusion
Capillary electrophoresis stands as a mature, robust, and highly effective technology for the forensic analysis of ballpoint pen inks, offering a unique combination of high resolution, sensitivity, and chemical specificity. Its proven superiority over traditional methods like TLC and its complementary role alongside advanced techniques like mass spectrometry solidify its place in the questioned document examiner's toolkit. Future directions point toward greater automation, the expansion of comprehensive digital ink libraries referenced by CE data, and the continued integration of CE into standardized, multi-modal analytical workflows. This progression will further enhance the objective, scientific foundation of forensic document examination, enabling more definitive conclusions in legal proceedings.
References
- 1. Protocol for Capillary Electrophoresis [https://www.creative-proteomics.com/resource/protocol-for-capillary-electrophoresis.htm]
- 2. Forensic Analysis of Blue Ballpoint Pen Inks Using ... [https://www.ojp.gov/ncjrs/virtual-library/abstracts/forensic-analysis-blue-ballpoint-pen-inks-using-capillary]
- 3. A Case Study of Ballpoint Pen Ink Dating in Vietnam - PMC [https://pmc.ncbi.nlm.nih.gov/articles/PMC8143886/]
- 4. Applications of Capillary Electrophoresis in Forensic Science [https://www.labx.com/resources/applications-of-capillary-electrophoresis-in-forensic-science/5644]
- 5. A brief introduction to capillary electrophoresis [https://www.sciencedirect.com/science/article/abs/pii/S0379073898000103]
- 6. Analysis of ballpoint pen inks directly from paper using ... [https://www.sciencedirect.com/science/article/abs/pii/S2468170918300894]
- 7. Amplified DNA Product Separation for Forensic Analysts [https://nij.ojp.gov/nij-hosted-online-training-courses/amplified-dna-product-separation-forensic-analysts/capillary-electrophoresis/principles]
- 8. Forensic Analysis of Black Ballpoint Pen Inks Using ... [https://www.ojp.gov/ncjrs/virtual-library/abstracts/forensic-analysis-black-ballpoint-pen-inks-using-capillary]
- 9. Strategies to improve the sensitivity in capillary ... [https://pubmed.ncbi.nlm.nih.gov/10733208/]
- 10. Forensic Drugs Analysis: A Review of Miniaturized ... [https://www.chromatographyonline.com/view/forensic-drugs-analysis-review-miniaturized-separation-techniques]
- 11. Assessment and Comparison of the Overall Analytical ... [https://link.springer.com/article/10.1007/s10337-020-03933-9]
- 12. in clinical and Capillary : recent... electrophoresis forensic analysis [https://pubmed.ncbi.nlm.nih.gov/10596826/]
- 13. Investigation and Discrimination of Ballpoint Pen Inks by ... [https://pmc.ncbi.nlm.nih.gov/articles/PMC9391124/]
- 14. An effective methodology for ballpoint pen ink dating in ... [https://www.sciencedirect.com/science/article/abs/pii/S0003267015010478]
- 15. A fast, low-cost, and nondestructive method using digital ... [https://www.sciencedirect.com/science/article/abs/pii/S1355030625000383]
- 16. Forensic Analysis of Commercial Inks by Laser-Induced ... [https://pmc.ncbi.nlm.nih.gov/articles/PMC7374342/]
- 17. A multimodal mass spectrometry imaging workflow for ballpoint ... pen [https://pubs.rsc.org/en/content/articlehtml/2025/an/d5an00217f]
- 18. Advanced sampling, sample preparation and combination ... [https://www.sciencedirect.com/science/article/abs/pii/S1296207422000838]
- 19. Researchers Explore Gas Chromatography to Improve ... [https://www.chromatographyonline.com/view/researchers-explore-gas-chromatography-to-improve-forensic-ink-analysis]
- 20. Capillary Electrophoresis (CE) for Forensic DNA Analysis [https://www.promega.com/products/forensic-dna-analysis-ce/]
- 21. Lab 6: Capillary Electrophoresis [https://chem.libretexts.org/Courses/University_of_California_Davis/CHE_115%3A_Instrumental_Analysis_-_Lab_Manual/Lab_6%3A_Capillary_Electrophoresis]
- 22. Method development and validation for the simultaneous ... [https://www.sciencedirect.com/science/article/abs/pii/S0003267098005741]
- 23. Optimization of Capillary Electrophoresis by Central ... [https://www.mdpi.com/2076-3298/12/1/22]
- 24. Optimization of capillary zone electrophoresis for charge ... [https://pmc.ncbi.nlm.nih.gov/articles/PMC5765393/]
- 25. Method Development for Capillary Electrophoresis [https://www.labx.com/resources/method-development-for-capillary-electrophoresis-optimization-strategies/5638]
- 26. Application of Capillary Electromigration Methods in the ... - PMC [https://pmc.ncbi.nlm.nih.gov/articles/PMC9102198/]
- 27. Review Physicochemical analysis of the age of handwritten ... [https://www.sciencedirect.com/science/article/abs/pii/S0957417422009794]
- 28. Applications of capillary electrophoresis in forensic ... [https://www.sciencedirect.com/science/article/abs/pii/S016599360700009X]
- 29. 7. Principle and Feature of Various Detection Methods (1) [https://www.hitachi-hightech.com/global/en/knowledge/analytical-systems/hplc/hplc-basics/course7.html]
- 30. A New Analytical Formulation for the Electrophoretic ... [https://www.mdpi.com/1099-4300/27/4/336]
- 31. Electrophoretic mobility measurements [https://www.sciencedirect.com/science/article/abs/pii/B9780443334436000144]
- 32. Large-scale generation of in silico based spectral libraries ... [https://link.springer.com/article/10.1007/s00216-025-06034-4]
- 33. Interpol review of questioned documents 2016–2019 - PMC [https://pmc.ncbi.nlm.nih.gov/articles/PMC7770439/]
- 34. Analysis of ballpoint pen inks directly from paper using ... [https://www.semanticscholar.org/paper/Analysis-of-ballpoint-pen-inks-directly-from-paper-Copper-Erbach/0a2e6876ff2923bd82379c87718971124cc170ee]
- 35. Sample treatments prior to capillary electrophoresis–mass ... [https://www.sciencedirect.com/science/article/abs/pii/S0021967306020516]
- 36. Capillary Electrophoresis: Trends and Recent Advances [https://pmc.ncbi.nlm.nih.gov/articles/PMC5994730/]
- 37. Capillary electrophoresis methods for impurity profiling of ... [https://pmc.ncbi.nlm.nih.gov/articles/PMC9073252/]
- 38. Buffer Preparation — Hints, Tips and Common Errors [https://www.chromatographyonline.com/view/buffer-preparation-hints-tips-and-common-errors]
- 39. Amplified DNA Product Separation for Forensic Analysts [https://nij.ojp.gov/nij-hosted-online-training-courses/amplified-dna-product-separation-forensic-analysts/capillary-electrophoresis/principles/separation]
- 40. The analysis of fountain pen inks by capillary electrophoresis with ultraviolet/visible absorbance and laser-induced fluorescence detection - PubMed [https://pubmed.ncbi.nlm.nih.gov/9511860/]
- 41. ICH Guidelines for Analytical Method Validation Explained [https://amsbiopharma.com/ich-guidelines-analytical-method/]
- 42. Amended Rule 702 in 2025: Circuit Courts Embrace the ... [https://www.wlf.org/2025/10/07/publishing/amended-rule-702-in-2025-circuit-courts-embrace-the-changed-standard/]
- 43. Unpacking Rule Changes on Expert Testimony [https://dicellolevitt.com/unpacking-rule-changes-on-expert-testimony/]
- 44. Capillary electrophoresis applied to DNA: determining and ... [https://pmc.ncbi.nlm.nih.gov/articles/PMC4551542/]
- 45. Trends development and applications on electrophoresis ... [https://www.sciencedirect.com/science/article/abs/pii/S0039914025005193]
- 46. Comparing Capillary Electrophoresis with HPLC: Efficiency ... [https://www.labx.com/resources/comparing-capillary-electrophoresis-with-hplc-efficiency-and-resolution/5643]
- 47. Comparison of Capillary Electrophoresis and HPLC-Based ... [https://www.mdpi.com/2304-8158/14/15/2623]
- 48. Application of Raman spectroscopy to forensic fibre cases [https://www.sciencedirect.com/science/article/abs/pii/S1355030607001050]
- 49. A new on-axis micro-spectrophotometer for combining Raman ... [https://pmc.ncbi.nlm.nih.gov/articles/PMC3747950/]
- 50. Raman spectroscopy [https://en.wikipedia.org/wiki/Raman_spectroscopy]
- 51. Complementary vibrational spectroscopy [https://www.nature.com/articles/s41467-019-12442-9]
- 52. Destructive vs Non‑Destructive Testing: Types & Examples [https://ndtblog-us.fujifilm.com/blog/destructive-versus-non-destructive-testing/]
- 53. Test NDT: Comparison of Nondestructive Vs. Destructive [https://circlesafe.com/test-ndt/]
- 54. Capillary Electrophoresis-Mass Spectrometry - an overview [https://www.sciencedirect.com/topics/chemistry/capillary-electrophoresis-mass-spectrometry]
- 55. A Comprehensive Review on Capillary Electrophoresis– ... [https://pmc.ncbi.nlm.nih.gov/articles/PMC12461452/]
- 56. Applications of DESI and DART Mass Spectrometry in ... [https://pmc.ncbi.nlm.nih.gov/articles/PMC12598873/]
- 57. Advantages and Disadvantages of Non-Destructive Testing ... [https://besgroup.com/blogs/what-are-the-different-methods-of-ndt-testing/]
- 58. Multimodal AI Explained: From Basic Concepts to ... [https://www.tribe.ai/applied-ai/multi-modal-ai]
- 59. Examining data visualization pitfalls in scientific publications [https://pmc.ncbi.nlm.nih.gov/articles/PMC8556474/]
- 60. Technology Readiness Levels [https://www.nasa.gov/directorates/somd/space-communications-navigation-program/technology-readiness-levels/]