Capillary Electrophoresis for DNA Analysis: Principles, Methods, and Cutting-Edge Applications in Biomedical Research
This article provides a comprehensive overview of capillary electrophoresis (CE) for DNA analysis, tailored for researchers, scientists, and drug development professionals.
Capillary Electrophoresis for DNA Analysis: Principles, Methods, and Cutting-Edge Applications in Biomedical Research
Abstract
This article provides a comprehensive overview of capillary electrophoresis (CE) for DNA analysis, tailored for researchers, scientists, and drug development professionals. It covers the foundational principles of CE, including separation mechanisms and key instrumentation. The article details methodological advances and diverse applications, from genotyping and forensic analysis to the characterization of mRNA therapeutics. It also offers practical guidance on troubleshooting and optimization, and concludes with a comparative analysis of CE against other techniques and a look at future directions, including high-throughput workflows and novel clinical diagnostics.
Core Principles: Understanding DNA Separation Mechanisms in Capillary Electrophoresis
Principles of Capillary Electrophoresis
Capillary Electrophoresis (CE) is an analytical technique that separates charged molecules based on their electrophoretic mobility under the influence of a high-voltage electric field within a narrow-bore capillary. This mobility is a function of the molecule's charge, size, and the surrounding medium [1]. The technique represents a significant evolution from traditional slab gel electrophoresis, offering superior resolution, speed, and automation for DNA analysis research [2].
The core principle relies on the differential migration of ions in an electric field. When a high voltage (typically 300 V/cm or more) is applied across a capillary filled with a conductive buffer, negatively charged molecules like DNA fragments migrate from the cathode (negative electrode) to the anode (positive electrode) [1]. The separation mechanism is enhanced by two primary factors: the electrophoretic mobility of the analytes and the electroosmotic flow (EOF). The EOF is the bulk flow of liquid inside the capillary, generated because the inner capillary wall often acquires a charge and attracts counter-ions from the buffer, which then move towards the electrode of opposite charge, dragging the entire solution with them [1].
For DNA, which has a constant charge-to-mass ratio, separation by size in a "free solution" is not feasible. This challenge is overcome by using a sieving matrix—a viscous polymer solution such as linear polyacrylamide or polyethylene oxide—filled inside the capillary. This matrix creates a network that acts as a molecular sieve, allowing smaller DNA fragments to navigate more quickly than larger ones, thereby enabling high-resolution size-based separation [2]. This specific mode is known as polymer sieving electrophoresis (PSE) and is fundamental to DNA applications like Short Tandem Repeat (STR) analysis and Sanger sequencing [2].
Key Advantages Over Traditional Gel Methods
The transition from conventional gel electrophoresis to capillary electrophoresis has been driven by substantial gains in analytical performance and workflow efficiency, as summarized in the table below.
Table 1: Quantitative Comparison of Capillary Electrophoresis and Traditional Gel Methods
| Parameter | Capillary Electrophoresis | Traditional Gel Electrophoresis |
|---|---|---|
| Sample Volume | Nanoliters (nL) to picoliters (pL) [2] [1] | Microliters (μL) [1] |
| Separation Time | Minutes [3] [1] | 1 to 2 hours [1] |
| Resolution | Single base-pair [3] | Limited to larger fragment differences [1] |
| Throughput | High (parallel analysis in multiple capillaries) [3] [1] | Low (manual, single gel at a time) |
| Degree of Automation | Fully automated (sample loading, run, detection) [2] [1] | Manual (gel pouring, sample loading, staining) [1] |
| Data Quality | Digital, quantitative electropherograms [3] | Qualitative/semi-quantitative visual analysis |
Beyond the metrics in the table, CE offers additional distinct advantages:
- Reusability: Capillaries can be flushed and re-used for multiple runs, unlike single-use gels [3].
- Safety: CE eliminates the need for handling hazardous chemicals like ethidium bromide and polyacrylamide, which are common in gel electrophoresis [1].
- Precision: The use of an internal size standard in every injection allows for precise and reproducible sizing of DNA fragments, which is critical for applications like forensic STR typing [2].
Instrumentation and Workflow
A basic CE instrument consists of several key components that work together to perform the separation and analysis.
Table 2: Key Components of a Capillary Electrophoresis Instrument
| Component | Function |
|---|---|
| Capillary | A fused-silica, narrow-bore tube (typically 50-75 μm in diameter, 30-60 cm in length); the separation channel [1]. |
| Buffer Reservoirs | Source and destination vials holding the aqueous running buffer that completes the electrical circuit [1]. |
| High-Voltage Power Supply | Provides the high-voltage electric field (up to 30 kV) that drives the separation [1]. |
| Autosampler | Automatically moves the capillary between sample vials and buffer reservoirs for high-throughput analysis. |
| Injection System | Introduces the sample into the capillary, either by electrokinetic (applying voltage) or pressure (siphoning) injection [1]. |
| Temperature Controller | Maintains a constant temperature to ensure run-to-run reproducibility, as viscosity affects migration [1]. |
| Detector | Located near the destination reservoir; detects separated analytes as they pass by (e.g., Laser-Induced Fluorescence (LIF) for DNA) [2] [3]. |
| Data Processing Unit | Converts the detector's analog signal into a digital electropherogram for analysis [3]. |
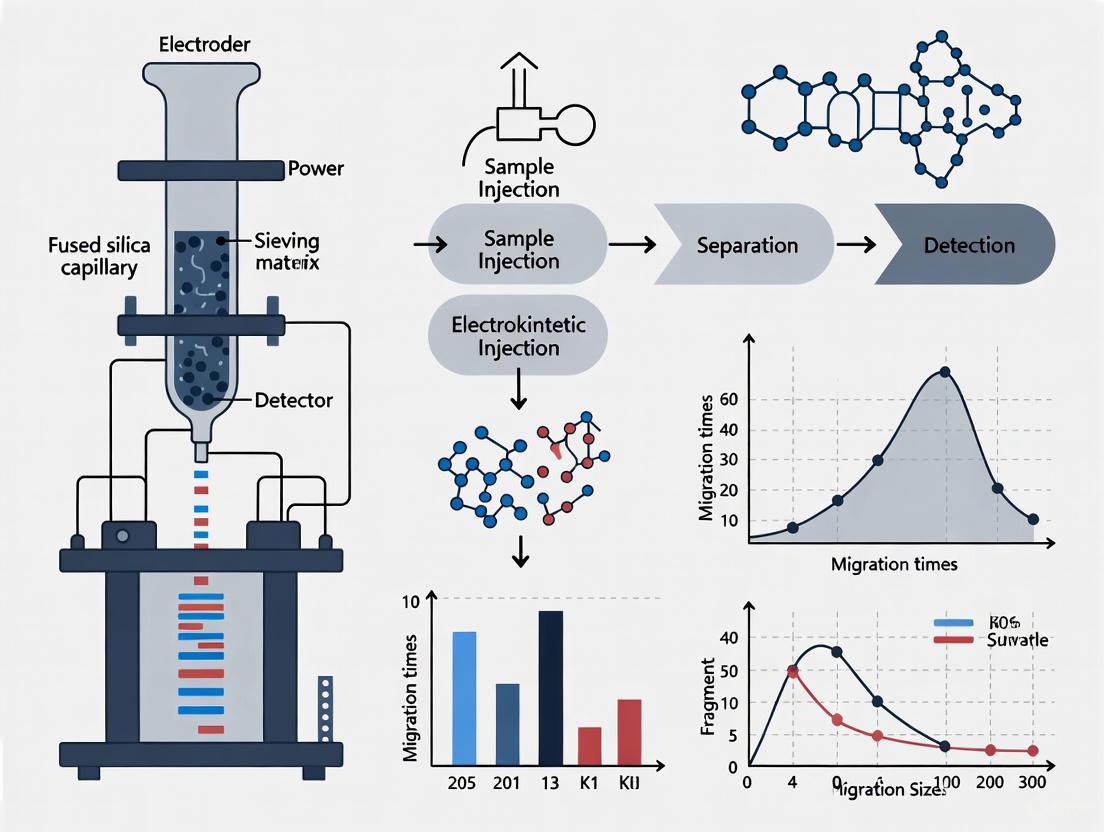
The typical workflow for fluorescent DNA analysis involves several key steps, which can be visualized in the following workflow diagram.
Essential Research Reagent Solutions
Successful CE analysis relies on a suite of specialized reagents and materials. The table below details the essential components of the "Researcher's Toolkit" for DNA analysis via CE.
Table 3: Key Research Reagents and Materials for Capillary Electrophoresis DNA Analysis
| Reagent/Material | Function and Importance |
|---|---|
| Sieving Matrix Polymer | A viscous polymer (e.g., linear polyacrylamide, polyethylene oxide) that fills the capillary and acts as a molecular sieve for size-based separation of DNA fragments [2]. |
| Running Buffer | An aqueous conductive solution (e.g., TAPS) that maintains a stable pH and ionic strength, facilitating the flow of current and consistent analyte migration [1]. |
| Internal Size Standard | A ladder of DNA fragments of known lengths labeled with a distinct fluorescent dye, co-injected with every sample. It is essential for precise sizing of unknown DNA fragments by providing a calibration curve for each run [2]. |
| Fluorochrome-Labeled Primers/dNTPs | Fluorescent dyes (e.g., FAM, JOE, NED) used to tag DNA fragments during PCR or sequencing reactions. This allows for highly sensitive laser-induced fluorescence (LIF) detection [2] [3]. |
| Capillaries | Fused-silica capillaries with a polyimide outer coating for durability. Some are coated on the inside to modify surface charge and control electroosmotic flow, optimizing separation for specific applications [1]. |
| Capillary Regeneration Kits | Solutions used to flush and clean the capillary between runs to prevent carryover and maintain performance, enabling capillary reusability [1]. |
Primary Applications in DNA Analysis
The high resolution and automation of CE have made it the gold standard for several key DNA analysis techniques in research and diagnostics. The relationships between these core applications are illustrated below.
Short Tandem Repeat (STR) Analysis
STR analysis is the cornerstone of modern forensic DNA profiling and human identity testing. It involves analyzing highly polymorphic loci containing short, repetitive sequences (typically 2-7 base pairs). CE, specifically in the PSE mode, can resolve alleles that differ by a single repeat unit. Modern systems allow for multiplexing, where 20 or more STR loci, each labeled with a different fluorescent dye, are amplified and analyzed simultaneously in a single injection. This generates a unique genetic profile that can be used for matching against known samples or databases like CODIS (Combined DNA Index System) [2] [4]. The minimal sample consumption of CE is uniquely suited for the trace and degraded DNA samples often encountered in forensic casework [2].
Sanger Sequencing
CE is the established platform for automated Sanger sequencing. In this application, the chain-termination method produces a set of DNA fragments of varying lengths, each ending with a fluorescently labeled dideoxynucleotide (ddNTP). The single-base-pair resolution of CE allows these fragments to be separated by size, and the fluorescent tag on the terminal base is detected to determine the DNA sequence [3]. CE-based Sanger sequencing remains the gold standard for its high accuracy and is widely used for confirming next-generation sequencing (NGS) results, validating genome editing events (e.g., CRISPR), microbial sequencing, and mitochondrial DNA analysis [3].
Other Fragment Analysis Applications
Beyond STRs, CE is used for a variety of other fragment analysis techniques:
- Microsatellite Instability (MSI): Detection of changes in the length of microsatellite repeats, which is critical in cancer research for diagnosing Lynch syndrome and other cancers [3].
- Loss of Heterozygosity (LOH) & Aneuploidy Assays: Using quantitative fluorescence PCR (QF-PCR), CE can detect chromosomal abnormalities, such as trisomies, by analyzing the relative peak heights of alleles [3].
- Single-Nucleotide Polymorphism (SNP) Genotyping: While often detected by sequencing, some SNP screening methods, like Single-Stranded Conformation Polymorphism (SSCP) analysis, use CE to detect mobility shifts caused by single-base changes in DNA [3].
Capillary Electrophoresis (CE) has established itself as a powerful analytical technique for DNA analysis, offering high separation efficiency, rapid analysis times, and minimal sample consumption [5]. Its application spans critical areas from genome sequencing and forensic analysis to the discovery and characterization of DNA aptamers [6]. The performance of CE in these domains is fundamentally governed by its core instrumentation. The precise interplay between the capillary, electrodes, high-voltage power supply, and detector is what enables the high-resolution separation of DNA fragments based on their charge and size [7] [8]. This technical guide details these essential components, framing their operation and specification within the context of modern DNA research and quality control protocols. The evolution of this technology, significantly advanced by Jorgenson and Lukacs in the 1980s through the introduction of fused silica capillaries, has made this high level of performance accessible and routine [5] [8].
Core Instrumentation Components
The basic setup of a capillary electrophoresis system is elegant in its simplicity but sophisticated in its execution. A typical system consists of a high-voltage power supply, a capillary tube, electrodes, a sample introduction system, a detector, and a data output device [7] [8]. The process begins when both ends of a capillary, filled with an electrolyte buffer, are placed into vials containing the same buffer. Electrodes connected to the high-voltage power supply are immersed in these vials to apply an electric field [8]. The sample is introduced at the inlet end, and upon application of voltage, analytes separate as they migrate through the capillary towards the detector [5].
Table 1: Core Components of a Capillary Electrophoresis System
| Component | Description & Function | Key Specifications for DNA Analysis |
|---|---|---|
| Capillary | Fused silica tube providing the separation pathway [7] [8]. | Material: Fused silica [9].Inner Diameter: 25 - 75 μm [10] [6].Detection Window: A small section of the polyimide coating is removed to allow for on-tube detection [8]. |
| Electrodes | Conductors that deliver the electric field to the buffer solutions in the source and destination vials [8]. | Material: Typically inert metals like platinum [7].Function: Initiate electroosmotic flow and electrophoretic migration of analytes [7]. |
| High-Voltage Power Supply | Provides the high electric field required to drive the separation [7] [9]. | Voltage: Typically 5 - 30 kV [7].Function: Generates the electric field strength (E) that determines analyte velocity (v = μepE) [7]. |
| Detector | Device that identifies and quantifies analytes as they elute from the capillary [8]. | Types: UV-Vis absorbance (most common) [8], fluorescence (high sensitivity for labeled DNA) [6], and mass spectrometry (for identification) [8].Pathlength Enhancement: Bubble cells can be used to increase sensitivity [8]. |
The Capillary: Fused Silica and Electroosmotic Flow
The capillary is the centerpiece of the CE system. Fused silica is the material of choice due to its optical properties and the ability to modify its inner wall [8]. At a buffer pH greater than approximately 3, the silanol (Si-OH) groups on the inner wall ionize to form negatively charged silanoate (Si-O⁻) groups [10] [8]. This negative surface charge attracts positively charged cations from the buffer, forming an electrical double layer. When an electric field is applied, the mobile portion of this double layer moves towards the cathode, dragging the entire bulk solution with it in a process called electroosmotic flow (EOF) [7] [5]. The EOF has a flat, plug-like flow profile, which minimizes band broadening and contributes to the high efficiency of CE separations compared to the parabolic flow profile of pressure-driven systems like HPLC [5].
For DNA analysis, particularly using capillary gel electrophoresis (CGE), it is often necessary to suppress or eliminate the EOF. This is achieved by coating the inner wall of the capillary with a polymer, such as linear polyacrylamide or polydimethylacrylamide, which masks the silanol groups and prevents the formation of the double layer [6].
Detection Systems for DNA Analysis
The detector is critical for translating the separation into analytical data. UV-Vis absorbance is the most common detection method, where a section of the capillary itself acts as the flow cell [8]. However, the short path length (equal to the capillary's inner diameter) is a limitation for sensitivity. To combat this, capillaries with bubble cells—a section with an expanded internal diameter—can be used to triple the path length and significantly enhance signal strength [8].
For highly sensitive applications, such as DNA sequencing or genotyping, laser-induced fluorescence (LIF) detection is employed. LIF can achieve detection limits as low as 10⁻¹⁸ to 10⁻²¹ mol, making it ideal for detecting tiny quantities of labeled DNA fragments [8]. Multi-color LIF detection systems are routinely used in capillary DNA sequencing, enabling high-throughput analysis [8].
Diagram 1: Basic CE Workflow. The process begins with sample introduction, followed by separation under an applied electric field, detection of analytes, and final data output as an electropherogram.
CE Modes and Methodologies for DNA Separation
While Capillary Zone Electrophoresis (CZE) is the simplest and most common CE mode, it is not well-suited for separating DNA fragments of different lengths. This is because all DNA fragments have a nearly identical charge-to-mass ratio, resulting in poor separation based on electrophoretic mobility alone [6]. To overcome this, Capillary Gel Electrophoresis (CGE) is the primary mode used for DNA analysis.
In CGE, the capillary is filled with a viscous sieving matrix, such as linear polyacrylamide or polydimethylacrylamide [6] [5]. This polymer gel acts as a molecular sieve, retarding the migration of larger DNA fragments more than smaller ones, thus enabling separation based on size [5] [9]. Two primary mechanisms govern DNA transport in the gel:
- Ogston Sieving: The DNA behaves as an incompressible sphere that migrates through the pores of the gel matrix. Smaller fragments migrate faster, leading to a linear relationship between size and migration time [6].
- Reptation: For DNA molecules larger than the gel pores, the molecule must deform and slither through the matrix in a snake-like manner. This leads to a non-linear size-migration relationship and worse peak resolution [6].
Table 2: Common Sieving Matrices for DNA Capillary Gel Electrophoresis
| Matrix | Separation Performance | Viscosity & Coating | Common Applications |
|---|---|---|---|
| Linear Polyacrylamide (LPA) | Outstanding performance; low cost [6]. | Very high viscosity; cannot coat capillary wall (requires separate coating step) [6]. | DNA sequencing; analysis of PCR products [6]. |
| Polydimethylacrylamide (e.g., POP-4) | Single-base resolution up to ~250 bases; two-base resolution up to ~350 bases [6]. | Low viscosity; can coat capillary wall to suppress EOF [6]. | Forensic DNA analysis (STR profiling); genotyping of bacteria [6]. |
| Hydroxyethylcellulose | Good resolution for various applications [6]. | Low cost; low viscosity [6]. | General DNA sizing and analysis. |
Essential Research Reagent Solutions
The following table details key reagents and materials required for performing capillary electrophoresis, with a focus on DNA analysis.
Table 3: Research Reagent Solutions for DNA Capillary Electrophoresis
| Reagent/Material | Function in the Experiment |
|---|---|
| Fused Silica Capillary | Provides the separation channel. Its wall chemistry generates electroosmotic flow, which can be controlled via coating for DNA applications [10] [8]. |
| Running Buffer (Electrolyte) | An aqueous buffer solution that fills the capillary and vials, conducting the applied electric field and maintaining a stable pH [7] [8]. |
| Sieving Matrix (e.g., LPA, PDMA) | A gel matrix used in CGE to separate DNA fragments based on size by acting as a molecular sieve [6] [5]. |
| Capillary Coating | A polymer (e.g., polydimethylacrylamide) coated onto the capillary inner wall to suppress electroosmotic flow, which is crucial for reproducible DNA separations [6]. |
| DNA Size Standards | A ladder of DNA fragments of known lengths, used to calibrate migration times and determine the size of unknown analytes [6]. |
| Fluorescent Dyes/Tags | Used to label DNA samples for highly sensitive detection via laser-induced fluorescence (LIF), especially in sequencing and fragment analysis [8]. |
Advanced Applications: DNA Aptamer Discovery and Characterization
Capillary electrophoresis plays a pivotal role in the entire lifecycle of DNA aptamers—single-stranded DNA molecules that bind specific targets with high affinity. The technique is used in the discovery phase through the Systematic Evolution of Ligands by Exponential Enrichment (SELEX) process to identify candidate sequences from vast random libraries. Furthermore, CE is indispensable for characterizing the binding affinity and kinetics of the selected aptamers, allowing researchers to quantify interactions from millimolar to nanomolar concentrations [6] [9]. This application underscores CE's value not just as a separation tool, but as a platform for probing biomolecular interactions critical to drug development and diagnostic research.
Diagram 2: DNA Separation by Size. In a gel-filled capillary, smaller DNA fragments navigate the polymer network more easily and elute first, while larger fragments are retarded.
The Role of Electroosmotic Flow (EOF) and Electrophoretic Mobility in DNA Migration
Capillary electrophoresis (CE) has emerged as a powerful analytical technique for the separation and analysis of DNA, playing a critical role in modern molecular biology, forensic science, and pharmaceutical development [6]. The exceptional resolution and efficiency of CE separations stem from the interplay between two fundamental electrokinetic phenomena: electrophoretic mobility and electroosmotic flow (EOF) [7] [11]. Electrophoretic mobility governs the movement of charged DNA molecules in response to an applied electric field, while EOF represents the bulk flow of solution through the capillary driven by the charged capillary wall [11]. Understanding the precise relationship between these two forces is essential for researchers optimizing CE methods for DNA analysis, from routine fragment sizing to advanced therapeutic characterization [3] [12]. This technical guide examines the principles governing EOF and electrophoretic mobility in DNA migration, providing detailed methodologies and current data to support research within the broader framework of capillary electrophoresis science.
Theoretical Foundations
Electrophoretic Mobility of DNA
Electrophoretic mobility (μEP) describes the movement of charged particles under the influence of an electric field and forms the basis for DNA separation in CE. The electrophoretic mobility of an ion is defined by the balance between the electrical force acting on the molecule and the frictional drag force it experiences during migration [7]. This relationship is expressed as:
[ \mu_{EP} = \dfrac{q}{f} = \dfrac{q}{6\pi \eta r} \label{1} ]
where ( q ) represents the net charge of the DNA molecule, ( f ) is the translational friction coefficient, ( \eta ) is the viscosity of the solvent, and ( r ) is the effective radius of the DNA molecule [7]. The actual migration velocity (v) of DNA in an electric field is directly proportional to both the electrophoretic mobility and the applied field strength (E):
[ v = \mu_{EP} E \label{2} ]
In free solution, DNA molecules larger than approximately 400 base pairs exhibit nearly identical charge-to-mass ratios, resulting in similar electrophoretic mobilities that make separation challenging [13]. To overcome this limitation, CE employs sieving matrices that create a porous network through which DNA molecules must migrate. The matrix imposes size-dependent resistance, enabling separation based on molecular dimensions [6] [13].
The separation mechanism depends on the relationship between the DNA size and the matrix pore size. The Ogston sieving model applies when DNA molecules are smaller than the matrix pores, behaving as migrating spheres that are sterically hindered by the gel fibers [6] [13]. In this regime, smaller DNA fragments migrate faster than larger ones, and a linear relationship exists between fragment size and migration time [6]. As DNA size increases beyond the matrix pore size, the separation transitions to the reptation model, where molecules must move end-first through the pores in a snake-like manner [6] [13]. In reptation with orientation, the mobility becomes less dependent on size, ultimately limiting the separation capability for very large DNA fragments [13].
Electroosmotic Flow (EOF) in Fused-Silica Capillaries
Electroosmotic flow arises from the electrical double layer that forms at the interface between the capillary wall and the buffer solution. In fused-silica capillaries, silanol groups (Si-OH) on the inner surface ionize to SiO⁻ at pH above approximately 3, creating a negatively charged surface [7] [11]. This negative charge attracts positively charged counterions from the buffer, forming a rigid Stern layer and a diffuse mobile layer collectively known as the electrical double layer [11]. When an electric field is applied tangentially to the capillary wall, the hydrated cations in the mobile layer move toward the cathode, dragging the bulk solution with them through viscous forces [7] [11].
The resulting EOF velocity profile is nearly flat across the capillary diameter, in contrast to the parabolic flow profile of pressure-driven systems. This plug-like flow minimizes band broadening and contributes to the high separation efficiency of CE [11]. The Helmholtz-Smoluchowski equation describes EOF mobility (μEOF):
[ \mu_{EOF} = \dfrac{\varepsilon \zeta}{4\pi \eta} ]
where ( \varepsilon ) is the dielectric constant of the buffer, ( \zeta ) is the zeta potential at the capillary wall, and ( \eta ) is the buffer viscosity [11]. In practice, EOF mobility is calculated from the migration time of a neutral EOF marker:
[ \mu{EOF} = \dfrac{L L{eff}}{V t} ]
where ( L ) is the total capillary length, ( L_{eff} ) is the length to the detector, ( V ) is the applied voltage, and ( t ) is the migration time of the neutral marker [11].
Net DNA Migration: The Vector Sum of EOF and Electrophoretic Mobility
The observed migration of DNA in CE represents the vector sum of its electrophoretic mobility and the EOF of the buffer solution. Since DNA is negatively charged across a wide pH range, its electrophoretic mobility is directed toward the anode. In bare fused-silica capillaries with significant EOF at neutral to basic pH, the EOF toward the cathode typically overwhelms the electrophoretic movement toward the anode, resulting in net migration toward the cathode [11] [14]. The net observed mobility can be expressed as:
[ \mu{observed} = \mu{DNA} + \mu_{EOF} ]
where ( \mu{DNA} ) is negative (toward anode) and ( \mu{EOF} ) is positive (toward cathode) under standard polarity [13]. When the magnitude of EOF exceeds the electrophoretic mobility of DNA, all species regardless of charge migrate toward the cathode, enabling single-point detection of various analytes [11]. The following diagram illustrates the relationship between these forces in a typical CE system:
DNA Migration in Capillary Electrophoresis
Experimental Parameters and Methodologies
Critical Parameters Affecting DNA Separation Performance
Multiple experimental parameters significantly impact the resolution and efficiency of DNA separations in CE by modulating the interplay between electrophoretic mobility and EOF. The following table summarizes key parameters and their effects on DNA migration:
Table 1: Experimental Parameters Affecting DNA Separation in Capillary Electrophoresis
| Parameter | Effect on Electrophoretic Mobility | Effect on EOF | Overall Impact on DNA Separation |
|---|---|---|---|
| Electric Field Strength | Direct proportionality: higher field increases DNA velocity [7] | Direct proportionality: higher field increases EOF velocity [11] | Decreased migration time but potential increased Joule heating; optimal field strength balances speed with resolution [15] |
| Buffer pH | Minimal direct effect on DNA charge; affects protonation of matrix | Strong dependence: higher pH increases SiO⁻ ionization, increasing EOF [7] [11] | Critical for controlling analysis time and direction of net migration; pH > 3 typically required for significant EOF [7] |
| Buffer Ionic Strength | Affects DNA coil size and counterion condensation | Higher ionic strength compresses double layer, decreasing ζ-potential and EOF [11] | Optimal ionic strength balances EOF control with manageable current and Joule heating [15] |
| Capillary Surface Chemistry | No direct effect | Determines surface charge density and ζ-potential; coatings can suppress EOF [11] [6] | Essential for reproducibility; surface modifications critical for eliminating EOF in gel-filled capillaries [6] |
| Temperature | Decreased buffer viscosity at higher temperature increases mobility [7] | Decreased viscosity increases EOF; also affects pKa of silanols [11] | Requires precise control for reproducible migrations; ~1-2% change in mobility per °C [7] |
| Sieving Matrix Type & Concentration | Determines sieving mechanism and resolution; higher concentrations slow migration [15] [6] | May adsorb to capillary wall, modifying surface charge and EOF [6] | Primary factor controlling size-based resolution; must be optimized for target DNA size range [15] [6] |
Methodologies for EOF Measurement and Control
Accurate measurement and control of EOF is essential for developing robust CE methods for DNA analysis. Researchers have developed numerous approaches to characterize EOF, which can be broadly categorized by detection principle [11]:
Neutral Marker Methods: The most common approach uses a neutral, detectable compound that migrates solely with EOF. The EOF mobility is calculated from the migration time of this marker [11]. Neutral dyes, acetone, or mesityl oxide are frequently used as markers with UV or fluorescence detection.
Current Monitoring Method: This technique measures the change in current when one buffer is replaced by another of different conductivity. The time required for the new buffer to reach the detector provides the EOF velocity [11].
Gravimetric Method: The volume of solution transported by EOF over a measured time is determined by weighing the solution collected at the capillary outlet. While accurate, this method requires careful evaporation control [11].
Moving Boundary Method: The movement of the boundary between solutions of different compositions is monitored, typically by imaging techniques [11].
For DNA separations, controlling EOF is often necessary to achieve optimal resolution. Several strategies for EOF manipulation include:
Capillary Wall Coatations: Covalent or dynamic coatings that mask silanol groups, such as linear polyacrylamide or polydimethylacrylamide, significantly reduce or eliminate EOF [6] [16]. These coatings are essential for gel-filled capillaries used in DNA sequencing and fragment analysis.
Buffer pH Adjustment: Operating at low pH (below pKa of silanols) protonates the capillary surface, reducing EOF. However, this may not be compatible with some DNA separation matrices [11].
Additives: Surfactants, polymers, or organic modifiers can be added to the buffer to dynamically coat the capillary wall and modify EOF [11].
Optimized Protocol for DNA Fragment Separation
The following protocol, adapted from current research, details the procedure for high-resolution separation of short DNA fragments (100-1000 bp) using hydroxyethylcellulose (HEC) as a sieving matrix [15]:
Materials and Reagents:
- Fused-silica capillary (50 μm ID, 30-40 cm effective length)
- Hydroxyethylcellulose (HEC, molecular weight ~250 kDa)
- TBE buffer (0.5× concentration: 45 mM Tris, 45 mM boric acid, 1 mM EDTA, pH 8.3)
- SYBR Green I fluorescent dye (10,000× concentrate)
- DNA size standard (100 bp ladder, 100-1000 bp)
- Capillary electrophoresis instrument with laser-induced fluorescence detection
Procedure:
- Capillary Preparation: Flush new capillaries with 1 M NaOH for 30 minutes, followed by deionized water for 10 minutes, and finally with 0.5× TBE for 10 minutes.
- Sieving Matrix Preparation: Prepare HEC solution at appropriate concentration (typically 0.5-1.5% w/v) in 0.5× TBE buffer containing 1× SYBR Green I. Stir continuously for 4-6 hours until completely dissolved. Filter through 0.45 μm membrane.
- Capillary Filling: Fill the capillary with HEC matrix using high-pressure injection (~100 psi for 5-10 minutes).
- Sample Preparation: Dilute DNA samples in deionized water or TE buffer to approximately 10-50 ng/μL. Mix with internal standard if required.
- Electrophoresis Conditions:
- Apply electric field: 100-200 V/cm
- Capillary temperature: 25°C
- Sample injection: 5-10 kV for 10-20 seconds
- Detection: LIF with excitation at 488 nm, emission at 520 nm
- Between-run Maintenance: Between separations, flush capillary with fresh sieving matrix for 2-3 minutes to maintain reproducibility.
Optimization Notes:
- For DNA fragments <700 bp (typical PCR products), use lower HEC concentrations (0.5-0.8%) for faster analysis [15].
- Increasing effective capillary length improves resolution but extends analysis time [15].
- Sample plug width should be minimized (<1% of total capillary length) to reduce band broadening [15].
Current Research and Applications
Advanced DNA Analysis Applications
The precise control of EOF and electrophoretic mobility has enabled diverse applications in DNA analysis, particularly in pharmaceutical development and clinical diagnostics:
mRNA Therapeutic Characterization: CE plays a critical role in quality control of mRNA-based therapeutics, including COVID-19 vaccines. Researchers have optimized gel concentration, denaturants, capillary temperature, and fluorescent dyes to separate full-length mRNAs from defective short and long RNA fragments. Recent studies demonstrate separation of RNAs up to 4000 nucleotides with resolution of fragments differing by ≥200 nucleotides [12].
DNA Conformation Analysis: CE can resolve subtle differences in DNA secondary structures. Recent research has detected the simultaneous presence of DNA self-dimers and hairpins in solutions of single-stranded DNA oligomers. The hairpins and self-dimers exhibit distinct electrophoretic mobilities due to differences in charge density and hydrodynamic friction, enabling their separation and quantification [16].
Forensic DNA Profiling: CE with polydimethylacrylamide sieving matrices remains the gold standard for short tandem repeat (STR) analysis in forensic science. These systems provide single-base resolution for DNA fragments up to 250 bases and two-base resolution up to 350 bases, enabling highly discriminating human identification [6].
Microbial Genotyping: Multi-locus variable number tandem repeat analysis (MLVA) using CE facilitates genotyping of pathogenic bacteria including Staphylococcus aureus, Clostridium difficile, Listeria monocytogenes, and Legionella pneumophila for outbreak investigation and transmission tracking [6].
Research Reagent Solutions for DNA CE
Table 2: Essential Reagents and Materials for DNA Capillary Electrophoresis
| Reagent/Material | Function/Purpose | Examples & Notes |
|---|---|---|
| Sieving Matrices | Create porous network for size-based separation of DNA fragments | Linear polyacrylamide: High resolution but viscous [6]Polydimethylacrylamide (POP-4): Low viscosity, self-coating [6]Hydroxyethylcellulose: Low cost, low viscosity [15] [6] |
| Capillaries | Separation channel with controlled surface chemistry | Bare fused-silica: Generates significant EOF [7]Surface-coated capillaries: EOF-suppressed for DNA separations (e.g., linear polyacrylamide coated) [6] [16] |
| Background Electrolytes | Conduct current and maintain stable pH | TBE buffer (Tris-Borate-EDTA): Most common for DNA separation [15]Diethylmalonate buffer: Allows cation variation without pH change [16] |
| EOF Markers | Measure electroosmotic flow velocity | Neutral fluorescent dyes: Mesityl oxide, acetone [11]Native fluorophores: Detectable without labeling |
| DNA Staining Dyes | Enable detection of DNA fragments | SYBR Green I: High sensitivity for dsDNA [15]Intercalating dyes: Used with LIF detection |
| Size Standards | Calibration references for fragment sizing | DNA ladders: 100 bp, 1 kbp, etc. [15]Internal standards: Correct for run-to-run variation |
The fundamental relationship between electroosmotic flow and electrophoretic mobility forms the cornerstone of capillary electrophoresis for DNA analysis. EOF provides the primary pumping mechanism that drives all analytes toward the detection window, while electrophoretic mobility differentiates DNA molecules based on their size and charge characteristics. The sophisticated manipulation of these forces through buffer composition, capillary surface chemistry, and separation matrices enables remarkable resolution of DNA fragments ranging from small oligomers to large nucleic acids. As CE technology continues to evolve, particularly in the characterization of complex therapeutic nucleic acids like mRNA vaccines, the precise control of EOF and electrophoretic mobility remains essential for advancing analytical capabilities in pharmaceutical development, clinical diagnostics, and basic research. The methodologies and parameters detailed in this technical guide provide researchers with the foundational knowledge required to optimize CE separations for specific DNA analysis applications.
Capillary Electrophoresis (CE) is a powerful analytical technique for separating biomolecules like DNA, RNA, and proteins based on their differential migration in an electric field within a narrow-bore capillary [17]. For DNA analysis, the choice of separation mechanism is critical and primarily hinges on two fundamental approaches: free-zone capillary electrophoresis and gel-facilitated sieving [6]. The separation of DNA molecules presents a unique challenge because different DNA fragments of varying lengths possess nearly identical charge-to-mass ratios when in free solution [6]. Consequently, free-zone separation alone is often insufficient for resolving DNA fragments by size, necessitating the use of gel-facilitated sieving matrices that act as molecular sieves [6]. This technical guide delves into the principles, methodologies, and applications of these two core separation mechanisms, providing a framework for researchers and drug development professionals to select and optimize conditions for their specific DNA analysis needs.
Core Principles and Physical Mechanisms
Free-Zone Capillary Electrophoresis
In free-zone capillary electrophoresis (CZE), also known as capillary zone electrophoresis, separation occurs in an open capillary filled only with a background electrolyte (BGE) [5]. The driving force for separation is the analyte's electrophoretic mobility ((μ{ep})), which is determined by the ratio of its charge to its hydrodynamic radius, as defined by the equation: [ μ{ep} = \frac{q}{6πηri} ] where (q) is the charge of the ion, (η) is the viscosity of the medium, and (ri) is the ionic radius [5]. For DNA, which is uniformly negatively charged, all fragments possess a similar charge-to-size ratio, causing them to co-migrate in free solution without a sieving matrix [6]. The overall movement of analytes is also influenced by electroosmotic flow (EOF), a bulk flow of buffer solution caused by the electric field acting on the charged inner wall of the fused-silica capillary [17] [5]. The apparent mobility ((μ{app})) of an analyte is thus the vector sum of its electrophoretic mobility and the electroosmotic mobility ((μ{EOF})) [5]. While CZE is rapid and requires minimal preparation, its application for DNA is limited to scenarios where fragments differ significantly in charge, rather than size [6] [5].
Gel-Facilitated Sieving
Gel-facilitated sieving, also referred to as capillary gel electrophoresis (CGE) or capillary sieving electrophoresis (CSE), introduces a sieving matrix—such as a gel or a polymer solution—into the capillary [6] [18]. This matrix creates a porous network through which DNA molecules must travel. Separation is achieved based on the size of the DNA fragments, as smaller molecules can navigate the pores more easily than larger ones [19]. Two primary models describe the transport of DNA through this network:
- Ogston Sieving Model: This model treats the DNA molecule as an incompressible sphere that migrates through the gel pores without deformation. Within this regime, a linear relationship exists between fragment size and migration time, allowing for effective sizing and sequencing of DNA. Smaller fragments migrate faster than larger ones [6].
- Reptation Model: When DNA molecules become too large to pass freely through the pores of the gel matrix, they must deform and unfold to "slither" through the channels in a snake-like manner. In this regime, the relationship between fragment size and migration time becomes non-linear, and peak resolution deteriorates, making precise sizing difficult [6].
The transition from the Ogston sieving regime to the reptation regime depends on the size of the DNA fragments and the pore size of the sieving matrix [6].
The table below summarizes the key characteristics of the two separation mechanisms.
Table 1: Comparative Analysis of Free-Zone and Gel-Facilitated Separation Mechanisms
| Feature | Free-Zone Capillary Electrophoresis | Gel-Facilitated Sieving |
|---|---|---|
| Separation Principle | Charge-to-size ratio and electroosmotic flow [5] | Molecular sieving based on size [6] [19] |
| Separation Medium | Homogeneous background electrolyte (buffer) [5] | Gel or polymer network (e.g., LPA, PDMA) [6] [18] |
| Role of EOF | Critical for driving separation; can be modulated [17] [5] | Typically suppressed to prevent disruption of the sieving process [6] |
| Primary DNA Separation Factor | Charge (ineffective for dsDNA of different lengths) [6] | Molecular size/hydrodynamic radius [6] |
| Resolution for DNA | Low for DNA fragments of different sizes [6] | High; can resolve fragments differing by a single nucleotide [6] [19] |
| Typical DNA Applications | Analysis of conformations (e.g., hairpins, self-dimers) [16] | DNA sequencing, STR analysis, mutation detection, PCR product analysis [6] [20] |
Key Methodologies and Experimental Protocols
Essential Research Reagents and Materials
Successful execution of CE-based DNA separation requires specific reagents and materials. The following table details the key components of a "Researcher's Toolkit" for these methods.
Table 2: Research Reagent Solutions for DNA Capillary Electrophoresis
| Reagent/Material | Function in Free-Zone CE | Function in Gel-Facilitated Sieving |
|---|---|---|
| Fused-Silica Capillary | The separation channel; its inner wall generates electroosmotic flow (EOF) [17] [5]. | The separation channel; often internally coated to suppress EOF [6] [18]. |
| Background Electrolyte (BGE) | A conductive buffer (e.g., Tris-borate-EDTA) that carries current and defines the separation environment [17]. | A buffer compatible with the sieving matrix; may contain denaturants like urea [6]. |
| Sieving Matrix | Not applicable. | A polymer (e.g., LPA, PDMA, HEC) that forms a porous network for size-based separation [6] [18]. |
| Capillary Coating | May be used to control or modify EOF [5]. | Essential for suppressing EOF and preventing analyte adsorption [6] [21]. |
| Fluorescent Dye/Stain | For on-capillary detection of DNA (e.g., intercalating dyes) [20]. | For on-capillary laser-induced fluorescence (LIF) detection, crucial for high sensitivity [20] [22]. |
| Denaturants (e.g., Urea) | Used for specific applications like ssDNA conformation analysis [16]. | Used to keep DNA in single-stranded form for sequencing or mutation detection [6]. |
Protocol for Gel-Facilitated Sieving for DNA Fragment Sizing
This protocol outlines a standard methodology for separating DNA fragments by size, such as for PCR product analysis or STR profiling, using a replaceable polymer matrix.
- Capillary Preparation: Use a fused-silica capillary of defined length and internal diameter (e.g., 30-50 cm effective length, 50-75 μm ID). For gel-facilitated sieving, the capillary's inner wall must be coated to suppress electroosmotic flow. Common coatings include linear polyacrylamide or covalently bound polymers that provide a neutral, hydrophilic surface [6] [18].
- Sieving Matrix Preparation: Prepare a solution of the sieving polymer in the appropriate buffer. A widely used matrix is polydimethylacrylamide (PDMA), typically at concentrations of 4-6% (e.g., POP-4 or POP-6 polymers). Alternatively, linear polyacrylamide (LPA) at 2-6% can be used for high-resolution applications. The matrix often includes denaturants like 5-8 M urea and 5-20% formamide when analyzing single-stranded DNA [6].
- Sample Preparation: Dilute the DNA sample (e.g., PCR products) in deionized water or a low-ionic-strength buffer. For quantitative fragment analysis, include an internal size standard labeled with a distinct fluorescent dye. Denature the sample at 95°C for 3-5 minutes if ssDNA analysis is required, followed by rapid chilling on ice [6] [20].
- Instrumental Setup and Analysis:
- Install the coated capillary in the CE instrument and fill it with the sieving matrix using high pressure.
- Place the buffer vials and sample vials in their respective positions.
- Inject the sample hydrodynamically (by pressure) or electrokinetically (by voltage). Pressure injection of 0.5-5.0 seconds is common.
- Apply the separation voltage (e.g., 10-15 kV). Under reversed polarity (cathode at the detector side), the negatively charged DNA fragments will migrate toward the anode past the detector [6].
- The capillary temperature is typically maintained at a constant value (e.g., 50-60°C) to ensure reproducible migration times [6].
- Detection and Data Analysis: Use laser-induced fluorescence (LIF) detection for high sensitivity. As DNA fragments pass the detector, they are recorded as peaks in an electropherogram. Data analysis software then correlates migration time with the internal standard to determine the size of each unknown fragment in the sample [17] [6].
Advanced Experimental Application: Detection of Low-Frequency Mutations
Recent advancements demonstrate the power of optimized gel-facilitated sieving for highly sensitive applications. A 2025 study by Yamamoto et al. developed a High Dynamic Range Capillary Electrophoresis (HiDy-CE) method to detect cancer driver mutations in the KRAS gene with a variant allele frequency (VAF) as low as 0.5% [22].
- Core Innovation: The protocol modified a conventional CE sequencer by altering the data acquisition from the charge-coupled device (CCD) sensor. This expanded the dynamic range by a factor of 8, preventing the saturation of wild-type DNA peaks and allowing precise quantification of low-abundance mutant peaks [22].
- Key Experimental Parameters:
- Assay: TrimGen's Shifted Termination Assay (STA) with control DNA.
- Matrix: Gel-facilitated sieving matrix (specific type not detailed).
- Sample: Genomic DNA from fine-needle biopsy specimens of pancreaticoduodenal tumors.
- Critical Adjustment: Increased injection voltage (up to 4.8 kV) to enhance sensitivity without causing signal saturation, a feat only possible with the expanded dynamic range [22].
- Outcome: The HiDy-CE protocol provided results highly concordant with digital PCR and targeted amplicon sequencing, establishing CE as a viable platform for sensitive molecular diagnostics and pre-testing before comprehensive genomic profiling [22].
Selection and Performance of Sieving Matrices
The choice of sieving matrix is a critical factor determining the success of a gel-facilitated separation. Different polymers offer a trade-off between performance, viscosity, cost, and ease of use.
Table 3: Common Sieving Matrices for DNA Analysis in Capillary Electrophoresis
| Sieving Matrix | Key Characteristics | Typical DNA Applications | Performance & Cost |
|---|---|---|---|
| Linear Polyacrylamide (LPA) | High sieving performance, low cost, but very high viscosity and cannot coat capillaries [6]. | DNA sequencing, high-resolution fragment analysis [6]. | Outstanding performance; single-base resolution up to several hundred bases. Low cost to synthesize [6]. |
| Polydimethylacrylamide (PDMA) | Lower viscosity than LPA, self-coating capability (no separate capillary coating needed) [6]. | Forensic STR analysis, genotyping [6]. | Excellent performance; single-base resolution up to 250 bases. More expensive than LPA (e.g., ~$60/mL for POP-4) [6]. |
| Hydroxyethylcellulose (HEC) | Low cost, low viscosity, derived from cellulose [6] [21]. | General purpose DNA fragment separation, protein analysis [21]. | Good performance for many applications, though generally lower resolution than LPA or PDMA. A cost-effective option [6]. |
| Poly(ethylene oxide) (PEO) | Low viscosity, flexible polymer chain [18]. | Separation of proteins and nucleic acids [18]. | Viable candidate for various biomolecules; performance depends on molecular weight and concentration [18] [21]. |
The strategic selection between free-zone capillary electrophoresis and gel-facilitated sieving is fundamental to the success of any DNA analysis workflow. Free-zone CE offers simplicity and speed but is ineffective for separating DNA fragments based solely on length. Gel-facilitated sieving, with its use of polymeric matrices, is the indispensable mechanism for high-resolution size-based separation of DNA, enabling applications from basic research to clinical diagnostics. The continued innovation in this field—such as the development of high-dynamic-range detection systems and advanced polymer matrices—ensures that capillary electrophoresis remains a vital and evolving tool for researchers and drug development professionals engaged in the precise characterization of nucleic acids.
Capillary electrophoresis (CE) has emerged as a powerful high-throughput separation method for DNA analysis, prized for its rapid analysis times and minimal sample volume requirements [6]. The separation of DNA fragments in CE is predominantly governed by the interaction between the DNA molecules and a sieving matrix inside the capillary. Two primary mechanisms explain the electrophoretic mobility of DNA through these porous matrices: Ogston sieving and reptation [6]. The operative mechanism depends critically on the relationship between the size of the DNA molecule, typically described by its radius of gyration (Rg), and the average pore size (ξb) of the sieving matrix [23]. When the DNA is smaller than the pores, it migrates according to the Ogston model. As DNA size increases beyond the pore dimensions, its motion transitions to a reptating mode. Understanding this interplay is fundamental for designing effective CE separation protocols for applications ranging from genome sequencing and forensic analysis to the quality control of nucleic acid therapeutics [6] [23].
Theoretical Foundations of DNA Electrophoresis
The Ogston Sieving Model
The Ogston sieving model conceptualizes a DNA molecule as an incompressible sphere moving through a random network of gel fibers [6] [23]. In this regime, the DNA's radius of gyration (Rg) is smaller than the matrix's pore size (ξb). Migration is governed by the molecule's ability to find and pass unobstructed through pores in the gel matrix. Smaller DNA fragments navigate this obstacle course more efficiently and thus migrate faster than larger ones. Consequently, a linear relationship is observed between the fragment size and its migration time [6]. The Ogston model is dominant for smaller DNA fragments and lower electric fields, making it ideal for sequencing and sizing applications [6].
The Reptation Model
When DNA molecules are too large to pass freely through the gel pores (Rg > ξb), the Ogston model no longer applies. Instead, these elongated molecules must deform and travel head-first through the pores in a snake-like motion termed reptation [6]. In this regime, the DNA is assumed to move through the "tubes" or channels formed by the gel matrix. The relationship between migration time and DNA size becomes non-linear, and peak resolution generally deteriorates, making precise sizing more challenging [6]. The reptation model can be further subdivided into reptation without stretching and reptation with stretching (also known as Biased Reptation with Fluctuation), where the electric field plays a significant role in orienting and stretching the molecule [24] [23].
Transition and Unified Models
The transition from Ogston sieving to reptation is not abrupt, and neither model perfectly describes all observed electrophoretic behaviors. For instance, traditional theory separates mobility plots into three regimes (Ogston sieving, reptation without stretching, and reptation with stretching), but these often fail to accurately model all variations in mobility with electric field strength [24]. To address this, a modified Ogston theory has been proposed. This theory accounts for the stretching of migrating DNA molecules in the direction of the electric field, which reduces the molecule's effective cross-section. The stretched DNA sieves as though it were a smaller molecule, and this modified equation can accurately predict mobilities across all three traditional regimes [24].
The pore size of a polymer sieving matrix can be approximated by the blob size (ξb), calculated using the formula:
ξb = Rg (c/c*)^(-a)
where c is the polymer concentration, c* is the entanglement threshold, a is a constant, and Rg is the radius of gyration of the polymer itself [23]. The radius of gyration for a DNA molecule is approximated by:
Rg = (pL/3)^(1/2)
where p is the persistence length (a measure of chain stiffness), and L is the contour length of the DNA fragment [23]. The transition from Ogston-like motion to reptation is approximated to occur when the DNA's Rg is similar to the matrix's pore size (ξb) [23].
Table 1: Key Parameters Governing the Transition Between Separation Mechanisms
| Parameter | Definition | Impact on Separation |
|---|---|---|
| DNA Radius of Gyration (Rg) | The root-mean-square distance from the molecule's center of mass; describes DNA size. | Larger Rg increases likelihood of reptation. |
| Pore Size (ξb) | Effective mesh size of the sieving matrix. | Smaller pores force larger DNA into reptation. |
| Persistence Length (p) | A measure of the stiffness of the DNA chain. | Influences Rg; stiffer chains (dsDNA/dsRNA) have larger Rg. |
| Polymer Concentration (c) | Concentration of the polymer forming the sieving matrix. | Higher concentration decreases pore size, shifting separation toward reptation. |
Experimental Methodologies and Protocols
Standard Capillary Gel Electrophoresis Setup
The standard protocol for capillary gel electrophoresis involves several key steps to ensure reproducible and high-resolution DNA separation [6]:
- Capillary Coating: The inner surface of the silica capillary must be coated to suppress electroosmotic flow (EOF), which can interfere with separation resolution. Common coatings include polyacrylamide or polydimethylacrylamide. Polydimethylacrylamide-based matrices have the advantage of self-coating the surface [6].
- Sieving Matrix Preparation: A polymer solution is prepared and used to fill the capillary. The choice of polymer and its concentration is critical and depends on the target DNA size range. For instance, linear polyacrylamide (LPA) and polydimethylacrylamide (PDMA) are widely used. The matrix is often mixed with denaturants like urea for single-stranded DNA analysis [6].
- Sample Injection: The DNA sample, typically in a low-conductivity buffer, is injected into the capillary, usually via electrokinetic or hydrodynamic injection.
- Electrophoresis: A high voltage (e.g., 500 V/cm) is applied across the capillary. DNA fragments, being negatively charged, migrate toward the anode. Separation occurs based on the interaction between the DNA and the sieving matrix [6] [25].
- Detection: Detection is most commonly achieved via laser-induced fluorescence (LIF) near the capillary's outlet.
Diagram 1: Capillary Electrophoresis Workflow
Protocol for Microfluidic Electrophoresis of RNA
With the growing importance of RNA therapeutics, characterizing RNA electrophoretic behavior is critical. The following protocol is adapted from recent research on microfluidic electrophoresis of single-stranded and double-stranded RNA [23]:
- Sample Preparation: Dilute the RNA ladder or sample to an appropriate concentration (e.g., 1:5 dilution in 1x TE buffer or 5 ng/μL) [23].
- Gel-Dye Mixture Preparation: Prepare the sieving matrix. For a poly(N,N-dimethyl acrylamide) (PDMA) matrix, dilute the stock PDMA solution with a dedicated gel diluent to achieve the desired concentration (1-5%), ensuring constant conductivity. Add a fluorescent intercalating dye (e.g., SYTO 61 at 2.34% v/v) to the gel mixture and centrifuge to remove bubbles [23].
- Chip Priming: Load the gel-dye mixture and a lower marker into the designated reservoirs of a microfluidic chip (e.g., a LabChip GXII Touch platform chip) [23].
- Sample Loading: Load 10-15 μL of the prepared samples into a 384-well plate and place the plate and chip into the instrument [23].
- Run Electrophoresis: Execute a pre-defined script that applies specific loading, injecting, and separation voltages. The separation time may need to be adjusted based on the gel concentration to ensure all peaks are captured [23].
- Data Analysis: Use the instrument's software to visualize the resulting electropherograms and determine migration times or peak identities.
Table 2: Common Sieving Matrices for DNA/RNA Electrophoresis
| Matrix | Key Features | Typical Applications | Limitations |
|---|---|---|---|
| Linear Polyacrylamide (LPA) | - Outstanding separation performance [6]- Low cost [6] | - Sizing PCR markers [6]- Short tandem repeat (STR) analysis on microfluidic platforms [6] | - High viscosity [6]- Cannot coat capillary surface [6] |
| Polydimethylacrylamide (PDMA/POP-4) | - Low viscosity [6]- Can self-coat capillary surface [6] | - Forensic DNA analysis [6]- Genotyping of bacteria [6] | - High cost [6] |
| Hydroxyethylcellulose (HEC) | - Low cost [6]- Low viscosity [6] | - General purpose DNA separation | - Requires separate capillary coating to suppress EOF [6] |
Advanced Materials and Novel Approaches
Artificial Nanostructures as Sieving Matrices
To overcome the limitations of traditional polymer gels, researchers have developed various artificial nanostructures that act as rigid sieving matrices. These include nanopillar arrays, nanofilter arrays, and self-assembled nanoparticle arrays [25]. A notable advancement is a rigid 3D network structure composed of solid SnO2 nanowires grown directly within a microchannel. The density of this network is controlled by the number of nanowire growth cycles, which in turn dictates the separable DNA size range [25].
- Type I (1-cycle growth): Separates large DNA (10 kbp – 166 kbp) extremely rapidly, resolving a T4-DNA/λ-DNA mixture in just 3 seconds [25].
- Type II (3-cycle growth): Extends separation down to 5 kbp [25].
- Type III (5-cycle growth): Achieves separation of fragments as small as 100 bp within 20 seconds [25].
This technology combines the wide size range of gels with the speed of nanostructure electrophoresis, behaving as a "hard gel" [25].
Relaxation-Time-Based Analysis as an Alternative
A fundamentally different approach for large DNA analysis (>10 kbp) abandons electrophoresis through a matrix altogether. This method uses a nanoslit channel to stretch large DNA molecules and then measures the relaxation time (τ)—the time required for a stretched molecule to return to a random coil conformation after the electric field is turned off [26]. The relaxation time is a function of molecular weight and the degree of confinement. This method successfully differentiated λ and T4 DNAs into two distinct peaks in a relaxation-time histogram, achieving a high resolution with an analysis time of just 60 seconds, surpassing pulsed-field gel electrophoresis in speed and avoiding DNA fragmentation risks [26].
The Scientist's Toolkit: Essential Reagents and Materials
Table 3: Research Reagent Solutions for DNA Electrophoresis
| Item | Function / Role in Experiment |
|---|---|
| Linear Polyacrylamide (LPA) | Sieving matrix for high-resolution separation of DNA fragments [6]. |
| Polydimethylacrylamide (PDMA/POP-4) | Low-viscosity sieving matrix capable of self-coating capillary surfaces; used in forensic and genetic analysis [6]. |
| Hydroxyethylcellulose (HEC) | Low-cost, low-viscosity polysaccharide-based sieving matrix [6]. |
| SYTO 61 | Fluorescent dye that intercalates with nucleic acids for detection via laser-induced fluorescence [23]. |
| TE Buffer | A common buffer (Tris-HCl, EDTA) for suspending and storing DNA/RNA samples to maintain pH and stability [23]. |
| Urea | Denaturing agent added to sieving matrices to prevent secondary structure formation in single-stranded DNA/RNA [6]. |
| SnO2/SiO2 Core-Shell Nanowires | Rigid 3D network structure for ultrafast, wide-range DNA separation under DC fields [25]. |
Data Presentation and Analysis
Quantifying separation performance is crucial for optimizing conditions and comparing different matrices. The primary metric is chromatographic resolution (Rs), defined as:
Rs = (Δt) / Wave
where Δt is the difference in migration times of two adjacent peaks, and Wave is the average width of the peaks at the base [6]. This measures the ability to distinguish between two closely migrating species.
The electrophoretic mobility (μ) of DNA fragments is the direct output of these experiments and its dependence on DNA size reveals the operative separation mechanism. The following conceptual diagram illustrates the transition between mechanisms, which is influenced by both DNA size and electric field strength.
Diagram 2: DNA Separation Mechanism Transition
Table 4: Performance Comparison of Different Separation Matrices/Systems
| Separation System | Effective DNA Size Range | Approximate Time | Key Mechanism(s) | Notes |
|---|---|---|---|---|
| LPA / PDMA Gels | Up to ~350 bases (single-base resolution) [6] | Minutes | Ogston, Reptation [6] | Standard for Sanger sequencing, forensic STR analysis. |
| Nanowire Network (Type I) | 10 kbp – 166 kbp [25] | 3 – 13 s [25] | Not specified, behaves as a "hard gel" [25] | For very large DNA; ultrafast. |
| Nanowire Network (Type III) | 100 bp – 5 kbp [25] | 20 s [25] | Not specified, behaves as a "hard gel" [25] | Wide range in seconds. |
| Relaxation Time in Nanoslit | >10 kbp (e.g., λ, T4 DNA) [26] | 60 s [26] | Hydrodynamic relaxation (not electrophoresis) | Avoids DNA breakage; no sieve needed. |
The separation of DNA in capillary electrophoresis is a sophisticated process governed by the well-defined physical principles of Ogston sieving and reptation. The transition between these mechanisms depends on the DNA size, matrix pore size, and electric field strength. While traditional polymer gels like LPA and PDMA remain workhorses for applications requiring high resolution for small-to-medium DNA fragments, emerging technologies—such as rigid nanowire networks and relaxation-time-based analysis—are pushing the boundaries of speed and range for large DNA molecules. A deep understanding of these core principles enables researchers to select the appropriate matrix and conditions, troubleshoot assays, and develop new methods for the ever-evolving demands of genomic analysis and biopharmaceutical development.
Advanced Methods and Applications: From Genotyping to mRNA Therapeutics
Capillary Electrophoresis (CE) has revolutionized the analysis of biomolecules, with polymer sieving electrophoresis becoming the cornerstone technique for high-resolution DNA separation. This mode of CE utilizes a viscous polymer solution within a capillary to create a molecular sieving medium that separates DNA fragments based on their size [2]. The selection of an appropriate sieving matrix is paramount to achieving optimal resolution, efficiency, and reproducibility in applications ranging from DNA sequencing to forensic short tandem repeat (STR) typing. The polymer matrix must fulfill multiple roles: it must act as a molecular sieve, dynamically coat the capillary wall to control electro-osmotic flow, and minimize interactions with the analytes [27] [2].
Within this landscape, linear polyacrylamide (LPA) and poly-N,N-dimethylacrylamide-based polymers, commercially available as POP-4 and POP-7, have emerged as critical materials. These polymers represent different approaches to balancing the critical performance parameters of read length, resolution, viscosity, and ease of use. This technical guide provides an in-depth comparison of LPA and POP-4, framing their properties and performance within the context of capillary electrophoresis principles for DNA analysis. We summarize quantitative experimental data, detail relevant methodologies, and provide visual workflows to aid researchers in selecting and implementing these matrices effectively.
Chemical and Physical Properties of Sieving Polymers
The performance of a sieving matrix in capillary electrophoresis is fundamentally governed by its chemical structure and the resulting physical properties. Understanding the relationship between polymer chemistry, hydrophobicity, and network formation is essential for selecting the appropriate matrix for a given application.
Linear Polyacrylamide (LPA)
Linear Polyacrylamide (LPA) is a hydrophilic polymer synthesized from acrylamide monomers. Its structure consists of a linear carbon backbone with pendant carboxamide groups (-CONH₂). These groups are highly polar and can form hydrogen bonds with water, resulting in a robust, highly-entangled polymer network in aqueous solution [28]. This extensive network is highly effective at separating DNA fragments based on size. A significant body of research highlights that LPA's high hydrophilicity is a key asset; it minimizes hydrophobic interactions with fluorescently-labeled DNA molecules, thereby reducing aberrant migration and improving peak quality [28]. The main drawback of high-molar-mass LPA is its high viscosity, which can complicate capillary loading and matrix replacement.
Polydimethylacrylamide (POP-4)
POP-4 is a commercially available separation matrix whose key component is linear poly-N,N-dimethylacrylamide (PDMA). This polymer is derived from acrylamide but features two methyl groups attached to the nitrogen atom of the amide group (-CON(CH₃)₂). This substitution makes the polymer more hydrophobic compared to LPA [28] [27]. As a result, PDMA-based polymers like POP-4 form solutions with significantly lower viscosities at equivalent concentrations, enabling easier microchannel loading at low applied pressures [28] [27]. POP-4 is specifically optimized for Human Identification (HID) and forensic applications, offering a balance of performance and practical handling [27]. The polymers in POP-4 dynamically coat the capillary wall, effectively controlling electro-osmotic flow and ensuring reproducibility [27].
Table 1: Fundamental Chemical Properties of LPA and PDMA (POP-4)
| Property | Linear Polyacrylamide (LPA) | Polydimethylacrylamide (PDMA/POP-4) |
|---|---|---|
| Chemical Structure | Linear chain with carboxamide groups (-CONH₂) | Linear chain with dimethylamide groups (-CON(CH₃)₂) |
| Hydrophobicity | High hydrophilicity | Moderate hydrophobicity |
| Polymer Network | Robust, highly-entangled | Less entangled, dynamic coating |
| Typical Concentration | ~7% w/v (varies by molar mass) | Formulated in POP-4 pouch [27] |
| Key Chemical Advantage | Minimal hydrophobic interaction with DNA | Lower viscosity, ease of capillary loading |
Comparative Performance in DNA Separation
The theoretical advantages and disadvantages of LPA and PDMA manifest directly in their experimental performance for key DNA analysis applications. Comparative studies under controlled conditions reveal clear trade-offs between read length, resolution, and operational convenience.
DNA Sequencing Performance
In DNA sequencing by capillary electrophoresis, the primary performance metric is read length—the number of bases that can be accurately called from a single separation run. A controlled comparative study synthesized and tested LPA, PDMA, and copolymers with N,N-diethylacrylamide (DEA) to elucidate the impact of polymer hydrophobicity [28].
The results were striking: LPA produced the longest read length, while linear PDMA yielded approximately 100 fewer readable bases. Performance decreased further with increasing hydrophobicity; DMA/DEA copolymers provided lower read lengths, which diminished as the DEA content rose [28]. This study conclusively demonstrated that polymer hydrophilicity is a critical driver of high-performance in DNA sequencing matrices, as it facilitates the formation of a robust, highly-entangled network.
DNA Fragment Analysis (e.g., STR Typing)
For fragment analysis applications like forensic STR typing, resolution between adjacent DNA fragments is more critical than ultra-long read length. This is the domain where commercially formulated polymers like POP-4 excel.
POP-4 is explicitly optimized for HID and forensic applications [27]. Its formulation is designed to separate DNA fragments of a known size range at a desired resolution and run time, which is ideal for generating STR profiles for databases like CODIS [27] [4]. The polymer provides definite quality and uniform consistency, which eliminates guesswork and helps ensure the reproducibility required in forensic casework [27]. While LPA may offer superior performance in sequencing, POP-4 and related POP polymers are the gold standard in many forensic laboratories due to their reliability and integration with automated systems.
Table 2: Experimental Performance Comparison for DNA Analysis
| Performance Metric | Linear Polyacrylamide (LPA) | Polydimethylacrylamide (POP-4) |
|---|---|---|
| DNA Sequencing Read Length | Longest read length [28] | ~100 fewer readable bases vs. LPA [28] |
| Application Focus | High-resolution DNA sequencing | Forensic STR typing, fragment analysis [27] |
| Solution Viscosity | High (orders of magnitude higher than hydrophobic polymers) [28] | Low (enables easy capillary loading) [28] [27] |
| Reproducibility | High separation efficiency | Excellent; defined quality and consistency [27] |
| Operational Throughput | Can be limited by high viscosity | High; designed for automated systems [27] |
Experimental Protocols and Methodologies
To contextualize the performance data, it is vital to understand the fundamental experimental protocols used for evaluating and utilizing these sieving matrices in capillary electrophoresis.
Protocol for Comparative Polymer Evaluation
The following methodology is adapted from the comparative study cited in this guide [28], which provides a framework for a controlled evaluation of sieving matrices.
- Polymer Synthesis and Preparation: Synthesize homopolymers (e.g., LPA, PDMA) via free radical polymerization. Purify the resulting polymers thoroughly.
- Polymer Characterization: Characterize the molar mass distributions of the polymers using tandem gel permeation chromatography coupled with laser light scattering (GPC-LS). Select polymers with similar molar mass distributions but different chemical compositions for a valid comparison.
- Sample Preparation: Prepare DNA sequencing samples or DNA fragments (e.g., STR ladders) using standard protocols, incorporating fluorescent dyes compatible with the instrument's detection system (e.g., LIF).
- Capillary Electrophoresis Run:
- Capillary: Use a fused silica capillary of defined length and internal diameter (e.g., 30-60 cm length, 50-75 μm diameter) [1].
- Matrix Loading: Fill the capillary with the polymer solution at a specific concentration (e.g., 7% w/v). Use the same concentration for all polymers being compared.
- Instrument Conditions: Use identical CE conditions for all tests: same electric field strength (e.g., V/cm), run temperature, and injection parameters (pressure or electrokinetic).
- Buffer: Use an appropriate conductive buffer (e.g., TBE).
- Data Analysis: Analyze the resulting electropherograms. For sequencing, determine the read length at a defined accuracy threshold (e.g., >99%). For fragment analysis, calculate the resolution between critical peak pairs.
Workflow for Forensic DNA Analysis Using POP-4
The following workflow is standard for forensic DNA profiling using a system like the Applied Biosystems 3500 Genetic Analyzer and POP-4 polymer [27] [4].
The Scientist's Toolkit: Essential Reagents and Materials
Successful implementation of capillary electrophoresis with sieving matrices requires a set of key reagents and consumables. The following table details these essential components.
Table 3: Key Research Reagent Solutions for Capillary Electrophoresis
| Item | Function/Description | Example Use Case |
|---|---|---|
| POP-4 Polymer | Pre-formulated, low-viscosity sieving matrix based on polydimethylacrylamide [27]. | Optimized for forensic STR analysis on Applied Biosystems 3500/SeqStudio instruments [27]. |
| Linear Polyacrylamide (LPA) | High-resolution, high-viscosity sieving matrix for demanding separations. | Achieving maximum read length in DNA sequencing applications [28]. |
| Fused Silica Capillaries | Submillimeter hollow tubes (50-75 μM diameter); the separation channel [1]. | Standard conduit for all CE modes; may be coated or uncoated. |
| Running Buffer (e.g., TBE) | Conductive electrolyte solution that carries the electric current. | Provides the medium for electrophoretic migration and electroosmotic flow. |
| Internal Size Standard | A ladder of DNA fragments of known lengths labeled with a fluorescent dye. | Added to each sample for precise sizing of unknown DNA fragments [2]. |
| Fluorescently-labeled DNA Ladder | A reference standard containing DNA fragments of known sizes. | Used for system calibration and quality control. |
| Conditioning Solution | A solution used to wash and re-condition the capillary interior. | Performing routine maintenance to ensure capillary performance and longevity. |
The choice between linear polyacrylamide (LPA) and polydimethylacrylamide (POP-4) is not a matter of identifying a universally superior product, but rather of selecting the right tool for a specific analytical goal. LPA remains the champion of maximum resolution and read length, making it ideal for research applications like DNA sequencing where pushing the boundaries of separation performance is paramount. In contrast, POP-4 and its related commercial formulations excel in routine, high-throughput analysis where reliability, reproducibility, and ease of use in automated systems are the primary concerns, such as in forensic laboratories and clinical diagnostics.
The evolution of sieving matrices continues. Research into low-viscosity polymers like polyethyleneoxide (PEO) demonstrates the ongoing pursuit of materials that combine ease of use with high performance for a broad range of DNA fragments [29]. Furthermore, the trend toward miniaturization and integration with mass spectrometry and other advanced detection techniques will likely drive the development of novel separation matrices with enhanced properties [2]. Understanding the fundamental principles and practical trade-offs outlined in this guide will empower researchers and drug development professionals to make informed decisions and adapt to these future advancements in capillary electrophoresis technology.
Forensic DNA Analysis and Short Tandem Repeat (STR) Typing with Multi-Capillary Systems
Short Tandem Repeat (STR) typing is the gold standard for human identification in forensic DNA analysis, playing crucial roles in criminal casework, paternity testing, and missing persons identification [30]. The method analyzes highly polymorphic regions of the genome consisting of repeating sequences of three to five nucleotides that vary in the number of repeats between individuals [31]. The vast majority of the human genome is identical across individuals, but these STR regions provide sufficient variation to generate unique genetic profiles for individualization, with discrimination power exceeding one in hundreds of trillions for multiplexed systems [32].
Capillary Electrophoresis (CE) serves as the primary platform for separating and detecting amplified STR fragments [31]. In CE, DNA fragments are separated based on their differential migration in an electric field within a thin capillary, predominantly governed by their size and charge [33]. Multi-capillary instruments significantly enhance throughput by enabling simultaneous analysis of multiple samples in parallel, making them indispensable for modern forensic laboratories [33]. This technical guide explores the principles, methodologies, and applications of STR typing with multi-capillary CE systems within the broader context of DNA analysis research.
Fundamental Principles of STR Typing and CE Analysis
Genetic Basis of STR Markers
Short Tandem Repeats, also known as microsatellites, consist of short repeating motifs of 2-6 base pairs that are tandemly repeated [32]. Unlike minisatellites which have longer repeat units (10-100 bp), STRs have repeat sizes generally under 1 kb, making them ideal for PCR amplification [32]. These regions exhibit high polymorphism primarily due to variations in the number of repeat units, resulting from replication slippage and unequal crossing over during DNA replication [32].
Forensic DNA databases worldwide utilize specific sets of core STR loci that have been selected for their high power of discrimination. The Combined DNA Index System (CODIS) used in the United States originally utilized 13 core loci but has recently expanded to 20 core loci to increase discriminatory power and international compatibility [30]. Each national database establishes specific requirements for STR loci included in their systems [31].
Principles of Capillary Electrophoresis
Capillary Electrophoresis separates DNA fragments based on their size-to-charge ratio as they migrate through a polymer matrix under an applied electric field [33]. The separation mechanism relies on the differential mobility of DNA fragments through the viscous polymer, with smaller fragments migrating faster than larger fragments [33]. The fundamental relationship governing migration time is expressed as:
tₘᵢ₉ = L²/(V × μₑₚ)
Where tₘᵢ₉ represents migration time, L is the separation channel length, V is the applied voltage, and μₑₚ is the electrophoretic mobility of the analyte [33]. This equation demonstrates that separation times can be decreased by increasing the applied voltage or decreasing the separation length [33].
Table 1: Key STR Loci and Their Characteristics in Forensic Analysis
| STR Locus | Repeat Motif | Chromosomal Location | Size Range (bp) | Key Population Variants |
|---|---|---|---|---|
| D8S1179 | Tetra-nucleotide | 8q24.13 | 105-160 [34] | High diversity [30] |
| D21S11 | Tetra-nucleotide | 21q21.1 | 180-240 [34] | High sequence variation [30] |
| D7S820 | Tetra-nucleotide | 7q21.11 | 250-380 [34] | Flanking region SNPs [30] |
| CSF1PO | Tetra-nucleotide | 5q33.1 | 105-168 [34] | Minimal sequence diversity [30] |
| TH01 | Tetra-nucleotide | 11p15.5 | Not specified | Minimal sequence diversity [30] |
| D13S317 | Tetra-nucleotide | 13q31.1 | Not specified | Flanking region haplotypes [30] |
| D16S539 | Tetra-nucleotide | 16q24.1 | Not specified | Single flanking SNP [30] |
| D18S51 | Tetra-nucleotide | 18q21.33 | Not specified | High polymorphism [35] |
| FGA | Tetra-nucleotide | 4q28.2 | Not specified | Extended polymorphism [35] |
Experimental Workflows and Methodologies
Sample Collection and DNA Extraction
Proper sample collection and DNA extraction represent critical initial steps in forensic DNA analysis. Biological samples commonly processed include blood, saliva, buccal swabs, tissue, bones, teeth, and hair follicles [36]. The selection of extraction method depends on the sample type, condition, and quantity available. For challenging samples such as bones, teeth, and claws, a cryogenic grinding approach using specialized mills followed by extraction with systems like the PrepFiler BTA Forensic DNA Extraction Kit has proven effective [36]. For hair, blood, and tissue samples, silica-based methods such as the Quick-DNA Micro-prep/Miniprep Plus Kit provide reliable recovery [36]. Fecal samples require specialized kits designed for inhibitor removal, such as the Quick-DNA Fecal/Soil Microbe Miniprep Kit [36].
DNA Quantification and Quality Assessment
Accurate DNA quantification is essential for optimizing PCR amplification and ensuring reliable STR profiles. Quantitative PCR (qPCR) methods represent the gold standard as they provide human-specific quantification and detect the presence of PCR inhibitors [36]. Systems like the PowerQuant System offer accurate assessment of DNA quantity and quality [31]. The quantification process often incorporates three specific targets:
- Nuclear DNA: Quantified using specific primers targeting established STR loci [36]
- Mitochondrial DNA: Detected using species-specific primers for complementary analysis [36]
- Internal Positive Control (IPC): Artificial DNA sequence that identifies inhibition through amplification failure [36]
The Degradation Index (DI) provided by quantification kits serves as a valuable indicator of DNA degradation, helping analysts determine the appropriate amount of degraded DNA for PCR amplification to maximize allele recovery [37].
STR Amplification by PCR
PCR amplification of STR loci uses sequence-specific primers labeled with fluorescent dyes to target multiple loci simultaneously in a multiplex reaction [31]. Commercial STR amplification kits, such as the PowerPlex and GlobalFiler systems, provide optimized primer sets and master mixes for robust amplification of core STR loci [31]. These multiplex systems can simultaneously amplify 15-20+ STR loci plus a gender determination marker (amelogenin) in a single reaction [35] [30].
For low template DNA (LT-DNA) samples, which present significant challenges due to stochastic effects, specialized pre-amplification techniques have been developed. The abasic-site-mediated semi-linear amplification (abSLA PCR) method has shown promise for improving STR typing from limited samples [34]. This approach uses primer pairs consisting of one normal primer and one primer containing an abasic site, which prevents nascent strands from serving as templates in subsequent cycles, thereby minimizing error accumulation while maintaining amplification efficiency [34].
Capillary Electrophoresis Separation
Following PCR amplification, DNA fragments are separated by size using multi-capillary electrophoresis instruments. The process requires several critical components:
- Internal Size Standards (ISS): Fluorescently-labeled DNA fragments of known sizes that are added to each sample to establish a size calibration curve for accurate fragment sizing [38]. The ISS also serves as a quality control measure, providing information about instrument run conditions [38].
- Matrix Standards: Used to correct for spectral overlap between different fluorescent dyes [31].
- Allelic Ladders: Contain common alleles for each STR locus and serve as reference standards for accurate allele designation [38]. Including allelic ladders with each run corrects for run-to-run variations, and running several ladders throughout a sequence can compensate for temperature variations during extended runs [38].
Data Analysis and Interpretation
Following capillary electrophoresis, data analysis software converts raw fluorescence data into DNA profiles represented as electropherograms [31]. The analysis process includes:
- Peak Identification: Software algorithms identify peaks corresponding to STR alleles based on their size relative to internal standards and their spectral characteristics [31].
- Allele Designation: Alleles are designated by comparing fragment sizes to those in the allelic ladders, with nomenclature based on the number of complete repeat units [30].
- Profile Review: Analysts review peaks for quality indicators including peak height balance, stutter production, and potential mixture artifacts [34].
For statistical interpretation, the match probability is calculated by multiplying the genotype frequencies at each locus across all loci typed, resulting in extremely low random match probabilities that typically exceed one in hundreds of billions [32].
Quality Control and Validation
Control Measures in STR Analysis
Implementing comprehensive controls throughout the DNA analysis process is essential and required for producing accurate and reliable results [38]. Key controls include:
- Extraction Blank Control: Treated identically to evidence samples but without the addition of sample material, this control detects contamination introduced during the extraction process [38].
- Positive Control: A known DNA sample that has been previously typed verifies that all analysis processes are functioning properly [38].
- Negative Control: Included in the amplification process to detect contamination introduced through reagents or techniques [38].
Instrument Quality Control
Multi-capillary instruments require regular monitoring and maintenance to ensure optimal performance. The internal size standard provides critical information about instrument run conditions; if all peaks for the sizing standard are not present, it may indicate temperature, run time, or injection problems [38]. Temperature fluctuations during a run can affect electrophoresis, making temperature control and the use of multiple allelic ladders throughout a run important considerations for maintaining data quality [38].
Table 2: Multi-Capillary CE Performance Metrics and Optimization Strategies
| Performance Parameter | Typical Range/Values | Optimization Strategies | Impact on Data Quality |
|---|---|---|---|
| Separation Capillaries | 8-24 parallel capillaries [39] | Implement parallel processing | Increases throughput |
| Injection Time | 1-10 seconds | Optimize based on DNA quantity | Prevents peak pull-up or reduced signal |
| Separation Voltage | 10-15 kV | Adjust for resolution requirements | Affects separation speed and resolution |
| Separation Temperature | 50-65°C | Maintain consistent run temperature | Improves sizing accuracy |
| Run Time | 20-60 minutes | Balance with resolution needs | Affects daily throughput |
| Detection Limit | 100-200 pg DNA | Increase injection time/voltage for low template | Enables analysis of limited samples |
Advanced Applications and Research Directions
Analysis of Challenging Samples
Forensic samples often present challenges such as low template DNA, degradation, or inhibitor presence. For LT-DNA analysis, methods such as abSLA PCR significantly increase the recovery of STR loci from low template genomic DNA or single cells [34]. This technique has demonstrated particular utility when coupled with commercial STR kits like the Identifiler Plus kit, improving sensitivity for markers including D8S1179, D21S11, D7S820, and CSF1PO [34].
For degraded DNA, the Degradation Index (DI) provided by quantification kits helps determine the degree of degradation and optimize the amount of DNA used for amplification [37]. Research demonstrates that STR and Y-STR profiles and allele detection rates vary depending on the degradation pattern (e.g., fragmentation vs. UV irradiation), even when the DI remains the same [37].
Beyond Human Identification
STR analysis with multi-capillary systems extends beyond human forensic applications to include wildlife forensics and conservation genetics. For example, the Pleo STRplex system has been developed for individual identification of Panthera leo (lion) samples, consisting of seven STR loci that can also be used to type DNA of other members of the genus Panthera [36]. These systems support conservation efforts and combat illegal wildlife trade by enabling species determination and individual identification [36].
Next-Generation Sequencing Integration
While CE-based STR typing remains the dominant method in forensic laboratories, Next-Generation Sequencing (NGS) technologies are emerging as a complementary approach [30]. NGS provides additional information including the nucleotide sequence of repeat motifs and variations in flanking regions, revealing greater diversity than size-based alleles alone for some STRs [30]. Studies of population variation have shown that certain STRs (D21S11, D2S1338, D12S391) exhibit higher allelic diversity when sequenced, while others (CSF1PO, TH01, TPOX) show little to no diversity beyond length-based variations [30].
Essential Research Reagents and Materials
Table 3: Research Reagent Solutions for STR Analysis with Multi-Capillary CE
| Reagent/Material | Function | Example Products | Key Features |
|---|---|---|---|
| DNA Extraction Kits | Isolation of DNA from various sample types | QIAamp DNA Investigator Kit, PrepFiler BTA Forensic DNA Extraction Kit | Efficient recovery, inhibitor removal [36] [34] |
| DNA Quantification Systems | Human-specific DNA quantification & quality assessment | PowerQuant System, Quantifiler HP Kit | qPCR-based, provides degradation index [31] [37] |
| STR Amplification Kits | Multiplex PCR amplification of core STR loci | GlobalFiler PCR Amplification Kit, PowerPlex Systems | 15-20+ loci multiplexing, dye-labeled primers [31] [30] |
| Internal Size Standards | Fragment sizing during CE analysis | GeneScan Size Standards | Fluorescently-labeled DNA fragments of known sizes [38] [34] |
| Allelic Ladders | Reference standards for allele designation | Kit-specific allelic ladders | Contain common alleles for each STR locus [38] [36] |
| CE Running Buffer | Electrolyte solution for capillary electrophoresis | POP-6, POP-7 Polymer | Optimal separation matrix for DNA fragments [33] |
| Capillary Arrays | Separation channels for parallel processing | 8-, 16-, or 24-capillary arrays | Enable high-throughput analysis [33] [39] |
STR typing with multi-capillary electrophoresis systems represents a mature, robust technology that continues to be the foundation of forensic DNA analysis worldwide. The method provides an optimal balance of discriminatory power, sensitivity, and throughput for routine casework and database applications. Understanding the fundamental principles of both STR genetics and capillary electrophoresis separation is essential for proper implementation and troubleshooting of these systems.
Ongoing advancements in multi-capillary instrumentation, amplification chemistries, and analysis software continue to enhance the capabilities of STR typing systems. The integration of new technologies such as NGS alongside established CE methods promises to further expand the applications and discriminatory power of forensic DNA analysis in the coming years. For the foreseeable future, CE-based STR analysis will remain an indispensable tool for human identification in forensic, medical, and research contexts.
Capillary Gel Electrophoresis for mRNA Integrity and Poly(A) Tail Length Analysis
Capillary gel electrophoresis (CGE) has emerged as a critical analytical technology for characterizing messenger RNA (mRNA)-based therapeutics, particularly for assessing structural integrity and poly(A) tail length—two essential quality attributes. The development of high-throughput CGE workflows addresses significant limitations in sample preparation, throughput, and data processing that have previously hindered broader implementation. This technical guide details comprehensive methodologies for mRNA analysis, including optimized sample preparation procedures for both naked mRNA and mRNA encapsulated in lipid nanoparticles, alongside a robust approach for determining average poly(A) tail length. The integration of advanced instrumentation with specialized informatics workflows enables rapid, scalable characterization crucial for supporting early development and quality control of mRNA therapeutics [40].
Capillary Electrophoresis (CE) is an analytical technique that separates molecules and ions based on their charge and size within a thin capillary tube filled with a buffer solution under the influence of a high-voltage electric field. Charged particles migrate through the capillary toward electrodes of opposite charge, with smaller, highly charged particles moving faster than larger particles with weakened charge. This principle forms the basis for various separation modes, with Capillary Gel Electrophoresis (CGE) being particularly significant for nucleic acid analysis [41].
CGE operates as a subtype of CE, employing a polymer-filled capillary that acts as a molecular sieve. The technique separates biomolecules like DNA and RNA primarily by their size, enabling high-resolution analysis of complex mixtures. The global capillary electrophoresis market, valued at approximately USD 438.8 million in 2025, is projected to grow at a CAGR of 5.1%, with the CGE segment accounting for the largest share (43.9% in 2025) due to its superior capabilities in nucleic acid and protein analysis [41].
Quantitative Data on Capillary Electrophoresis Markets and Applications
Table 1: Global Capillary Electrophoresis Market Overview
| Parameter | Value (2024-2025) | Projected Value (2032) | CAGR | Primary Segment Share (CGE) |
|---|---|---|---|---|
| Market Size | USD 418.9 million (2024) [41] | USD 621.2 million [41] | 5.1% [41] | 43.9% (2025) [41] |
| Alternative Market Size | USD 368.21 million (2024) [42] | USD 611.25 million [42] | 5.8% [42] | 44.8% [42] |
Table 2: Application Segmentation of Capillary Electrophoresis in Nucleic Acid Analysis
| Application Segment | Market Share (2024) | Projected CAGR | Key Analysis Types |
|---|---|---|---|
| Nucleic Acid Analysis | Largest Share [41] | - | DNA Sequencing, Genotyping, Fragment Analysis |
| RNA/mRNA Analysis | Part of Nucleic Acid Segment [42] | - | Integrity, Purity, Poly(A) Tail Length |
| Protein & Peptide Analysis | - | 5.8% [41] | Charge Variant Analysis, Purity |
High-Throughput Workflow for mRNA Integrity Analysis
Instrumentation and Core Principle
The high-throughput CGE workflow utilizes automated systems like the Agilent 5300 Fragment Analyzer with a 48-capillary array, enabling parallel analysis of multiple samples. Separation occurs through a polymer matrix within the capillaries, where negatively charged mRNA molecules are separated by size under an electric field. Smaller RNA fragments migrate faster than larger ones, producing an electropherogram that displays peaks corresponding to RNA species of different sizes. The integrity is quantified by assessing the ratio of intact mRNA to degradation products [40].
mRNA Structural Integrity Workflow
Workflow Diagram 1: mRNA Structural Integrity Analysis
Critical Experimental Parameters
The methodology requires careful optimization of sample preparation, particularly for different mRNA formulations. For naked mRNA, heating at 70°C for 5 minutes proves sufficient for denaturation and preparation. However, mRNA encapsulated in lipid nanoparticles requires the addition of 2% Triton-X100 detergent alongside heating at 70°C for 5 minutes to effectively liberate the mRNA from the nanoparticle structure without compromising its integrity. This systematic optimization ensures accurate assessment of mRNA structural integrity, a crucial quality attribute for therapeutic efficacy [40].
Poly(A) Tail Length Analysis Methodology
Workflow for Poly(A) Tail Determination
Workflow Diagram 2: Poly(A) Tail Length Analysis
Detailed Experimental Protocol
The poly(A) tail length analysis begins with RNase T1 digestion, which specifically cleaves RNA after guanine (G) residues, generating fragments that include the poly(A) tail region. The resulting digest is then subjected to purification using magnetic oligo(dT) beads that selectively bind to the poly(A) sequences, enriching the tail fragments for analysis. A custom-designed size calibration ladder is essential for accurate sizing, typically consisting of RNA fragments with known poly(A) tail lengths. Finally, CGE analysis separates these fragments, with the average poly(A) tail length determined by analyzing the apex of the peak relative to the calibration standard [40].
The poly(A) tail is critical for mRNA stability and translational efficiency in therapeutic applications, making this quality attribute particularly significant for mRNA vaccine and therapeutic development. The ability to precisely determine tail length distribution ensures consistent product quality and performance.
The Scientist's Toolkit: Essential Research Reagents and Materials
Table 3: Key Research Reagent Solutions for CGE mRNA Analysis
| Reagent/Material | Function/Application | Example Specifications |
|---|---|---|
| Capillary Array | Separation channel for mRNA fragments | 48-capillary configuration [40] |
| Sieving Polymer | Matrix for size-based separation | Linear polyacrylamide or polyethylene oxide [2] |
| Fluorescent Dyes | Detection of separated fragments | Laser-induced fluorescence detection [40] |
| Triton-X100 | Liberation of mRNA from LNPs | 2% concentration in sample prep [40] |
| RNase T1 | Specific digestion for poly(A) analysis | Cleaves after guanine residues [40] |
| Magnetic Oligo(dT) Beads | Poly(A) tail fragment purification | Selective binding to poly(A) sequences [40] |
| Size Calibration Ladder | Reference for fragment sizing | Custom-designed for poly(A) tail length [40] |
| Internal Size Standard | Precise fragment sizing | Fluorescently-labeled DNA fragments of known size [2] |
Advanced Detection and Informatics
Detection Technologies
CGE systems typically employ laser-induced fluorescence (LIF) detection for ultrasensitive analysis of mRNA fragments. This detection method allows for the analysis of extremely low sample quantities, which is particularly valuable for characterizing precious therapeutic mRNA samples. The high sensitivity of LIF detection enables precise quantification of both intact mRNA and degradation products, providing robust integrity assessment [2].
Advanced systems may utilize multi-color fluorescence detection for multiplexed analyses. Research systems have demonstrated detection capabilities for multiple fluorophores simultaneously, with reported detection limits as low as 34 ± 1 molecules for BODIPY-FL labeled glycosphingolipids, illustrating the remarkable sensitivity achievable with optimized LIF detection [43].
Data Processing and Analysis
A critical component of the modern CGE workflow is the implementation of specialized informatics solutions. Open-source compatible informatics workflows enable flexible peak integration and scalable batch analysis, significantly improving workflow efficiency and consistency. These software solutions facilitate the precise quantification of mRNA integrity metrics and poly(A) tail length distributions, ensuring reproducible results across multiple analyses and operators [40].
The integration of automated data processing reduces human error and enhances throughput, meeting the stringent quality assurance requirements of therapeutic development. These informatics tools represent a crucial advancement in making CGE a robust, high-throughput analytical platform for mRNA characterization.
Capillary gel electrophoresis has established itself as an indispensable analytical technology for the comprehensive characterization of therapeutic mRNA, addressing critical quality attributes including structural integrity and poly(A) tail length. The development of optimized, high-throughput workflows with automated sample processing and advanced data analytics positions CGE as a cornerstone technology supporting the rapidly expanding field of mRNA therapeutics. As the market continues to grow and evolve, driven by increasing demand for precision medicines and nucleic acid-based therapeutics, CGE methodologies will remain essential for ensuring the quality, efficacy, and safety of these innovative therapeutic modalities.
Genotyping and Pathogen Identification in Microbiology and Agriculture
The precise identification of microbial pathogens and delineation of their genetic lineages—collectively known as genotyping—are fundamental practices in modern microbiology and agriculture. These processes are critical for tracking disease outbreaks, developing effective control strategies, and understanding pathogen evolution. Within this technical landscape, capillary electrophoresis (CE) has emerged as a powerful analytical technique, providing the resolution necessary to separate DNA fragments based on size and sequence variations. This guide details the core principles, methodologies, and applications of genotyping and pathogen identification, with a specific focus on the role of capillary electrophoresis, providing researchers and drug development professionals with a comprehensive technical resource.
Principles of Capillary Electrophoresis for DNA Analysis
Capillary electrophoresis is a high-throughput separation method characterized by its ability to analyze limited sample volumes with exceptional speed and efficiency [6]. Its application to DNA analysis has grown substantially since its inception, becoming a cornerstone technology in fields ranging from forensic science to agricultural diagnostics.
Fundamental Separation Mechanisms
The separation of DNA fragments in CE is governed by their mobility under an applied electric field within a narrow capillary tube. The mode of separation is determined by the matrix, if any, used inside the capillary [6]:
- Free-Zone Capillary Electrophoresis: This mode occurs in an open capillary without a sieving matrix. Its utility for DNA is limited because most DNA fragments possess a similar charge-to-size ratio, hindering effective separation based on length [6].
- Gel-Facilitated Sieving: This is the most prevalent mode for DNA analysis. The capillary is filled with a viscous polymer or gel that acts as a molecular sieve. Two primary mechanisms operate within this regime:
- Ogston Sieving: The DNA molecule behaves as an incompressible sphere that migrates through the pores of the gel matrix. Smaller fragments navigate the pores more easily and migrate faster, resulting in a linear relationship between fragment size and migration time. This mechanism is dominant for sequencing and sizing smaller DNA fragments [6].
- Reptation: When DNA fragments are too large to pass freely through the gel pores, they must unfold and "snake" through the matrix in a head-first manner. This leads to a non-linear relationship between size and migration time and generally provides lower peak resolution, making sizing less straightforward [6].
Critical Sieving Matrices
The performance of CE in DNA separation is heavily dependent on the choice of the sieving matrix. Key characteristics include separation performance, viscosity, cost, and ability to suppress electroosmotic flow (EOF) [6].
Table 1: Comparison of Prevalent DNA Sieving Matrices in Capillary Electrophoresis
| Matrix | Separation Performance | Viscosity | Coating Capability | Relative Cost | Key Applications |
|---|---|---|---|---|---|
| Linear Polyacrylamide (LPA) | High resolution; low single-base resolution up to ~70 bases [6] | Very high (e.g., ~27,000 cP for 2% LPA) [6] | Cannot coat capillary; requires separate surface modification [6] | Low | Microfluidic lab-on-a-chip platforms, analysis of bacteria and viruses [6] |
| Polydimethylacrylamide (e.g., POP-4) | Single-base resolution up to 250 bases; two-base resolution up to 350 bases [6] | Low (e.g., POP-4 viscosity is much lower than LPA) [6] | Can coat capillary surface; no separate coating required [6] | High (~$60/mL for POP-4) [6] | Forensic STR analysis, microbial genotyping (MLVA), agricultural pathogen detection [6] |
| Hydroxyethylcellulose | Moderate resolution [6] | Low | Does not fully suppress EOF [6] | Low | General purpose DNA sizing |
Molecular Techniques for Pathogen Identification
Pathogen identification can be broadly categorized into phenotypic and genotypic methods. While phenotypic methods, such as culture-based techniques and morphological analysis, are considered the gold standard in many contexts, genotypic methods offer superior speed, specificity, and the ability to identify uncultivable organisms [44] [45].
Sequencing-Based Identification
The acquisition of genetic sequence data is a powerful and direct method for pathogen identification.
- Ribosomal DNA (rDNA) Sequencing: The 16S rRNA gene is the most commonly used genetic marker for bacterial identification. Its utility stems from the presence of both highly conserved regions (for primer binding) and variable regions (for species discrimination) [46] [47]. After PCR amplification and sequencing, the resulting sequence is compared against curated databases (e.g., LPSN, Phytophthora-ID) for identification [48] [47]. A significant limitation is that some species may share identical or nearly identical 16S sequences [47].
- Whole-Genome Sequencing (WGS): WGS provides the most comprehensive genetic information by determining the complete DNA sequence of an organism's genome [45]. The workflow involves DNA extraction, library preparation, sequencing (e.g., using Illumina or Ion Torrent platforms), and subsequent bioinformatic analysis for alignment, variant calling, and annotation [45]. WGS is increasingly feasible for clinical and agricultural laboratories and is poised to become the new gold standard for pathogen typing [47].
Immunological and Proteomic Methods
These methods rely on detecting pathogen-specific proteins or the host's immune response.
- Enzyme-Linked Immunosorbent Assay (ELISA): ELISA is a versatile technique used to detect the presence of microbial antigens or antibodies in a sample. Recent advancements incorporate nanomaterials to enhance sensitivity and simplify operations [45].
- Matrix-Assisted Laser Desorption/Ionization Time-of-Flight Mass Spectrometry (MALDI-TOF MS): This proteomics-based approach revolutionized microbial identification in clinical laboratories. It involves analyzing the unique protein profile, primarily ribosomal proteins, of a microorganism and comparing it to a spectral database. It offers rapid and accurate identification, reducing the process from days to about an hour [45].
Genotyping and Strain Typing Techniques
While identification determines the species, genotyping (strain typing) distinguishes sub-species-level variations, which is crucial for epidemiology, outbreak investigation, and population studies [47].
Capillary Electrophoresis-Based Genotyping
CE is the enabling technology for several high-resolution genotyping methods:
- Multilocus Variable Number Tandem Repeat Analysis (MLVA): This technique amplifies genomic regions containing Variable Number Tandem Repeats (VNTRs) via multiplex PCR. The resulting amplicons, which differ in length based on the number of repeats, are separated with high resolution by CE. The data output is a profile of fragment sizes (a code) that is highly specific to a bacterial strain [6] [47]. MLVA has been used to genotype pathogens such as Shigella spp., Staphylococcus aureus, and Clostridium difficile [6].
- Microsatellite or Simple Sequence Repeat (SSR) Analysis: Functionally similar to MLVA, this method targets specific, short repetitive DNA sequences that are ubiquitous in eukaryotic and prokaryotic genomes. CE is used to separate the length variants, providing a fingerprint for strain identification and population tracking [48].
- Multilocus Sequence Typing (MLST): MLST relies on sequencing approximately 450-500 base pair internal fragments of typically seven housekeeping genes. The sequence of each fragment is compared to existing alleles in a database, and the combination of alleles across the seven loci defines the sequence type (ST) of the isolate [47]. While Sanger sequencing is traditional, CE-based sequencing can be part of the workflow.
Other Prominent Genotyping Methods
- Pulsed-Field Gel Electrophoresis (PFGE): Considered the historical gold standard for outbreak investigation, PFGE involves digesting genomic DNA with rare-cutting restriction enzymes and separating the large fragments using a specialized electrophoresis apparatus that alternates the electric field direction [47]. It is highly discriminatory but time-consuming and challenging to standardize.
- Repetitive Sequence-Based PCR (rep-PCR): This technique uses PCR to amplify the regions between non-coding repetitive sequences in the genome. The resulting amplicons of varying lengths create a complex DNA fingerprint that can be separated and analyzed by CE or gel electrophoresis [47].
- Whole-Genome Sequencing (WGS): As the price of sequencing continues to fall, WGS is fast becoming a feasible typing method. It provides the ultimate resolution by revealing all single nucleotide polymorphisms (SNPs), insertions, deletions, and other genetic variations between isolates, making it invaluable for tracing transmission pathways with high precision [47].
Table 2: Comparison of Key Genotyping Techniques
| Technique | Discriminatory Power | Turnaround Time | Throughput | Key Application | Major Consideration |
|---|---|---|---|---|---|
| PFGE | High | Long (>3 days) [47] | Low | Outbreak investigation of bacterial pathogens [47] | Gold standard but labor-intensive and difficult to standardize [47] |
| MLVA | High | Moderate (1-2 days) | High | Strain discrimination for epidemiology [47] | Highly reproducible and portable; requires prior knowledge of VNTR loci [47] |
| MLST | High for many species | Moderate to Long | High | Population genetics and long-term epidemiology [47] | Provides unambiguous, portable data; more costly and time-consuming than MLVA [47] |
| rep-PCR | Moderate to High | Fast (<1 day) [47] | High | Rapid strain typing and outbreak investigation [47] | Rapid but potential issues with reproducibility between laboratories [47] |
| Whole-Genome Sequencing | Highest (all variations) | Moderate (1-3 days) [47] | High | Definitive outbreak investigation and pathogen discovery [47] | Becoming more affordable; bioinformatic analysis is a major hurdle [47] |
Experimental Protocols
Protocol: MLVA Genotyping Using Capillary Electrophoresis
This protocol is commonly used for high-resolution strain typing of bacterial pathogens.
- DNA Extraction: Purify high-quality, intact genomic DNA from a pure culture of the bacterial isolate using a standard phenol-chloroform or commercial kit method.
- Multiplex PCR Amplification:
- Primer Design: Design fluorescently labelled primers (e.g., FAM, VIC, NED) that flank the known VNTR loci. Labels can be on the forward or reverse primer.
- PCR Reaction: Set up a multiplex PCR reaction containing:
- Genomic DNA template (1-10 ng)
- PCR buffer (1X)
- MgCl₂ (1.5-2.5 mM)
- dNTP mix (200 µM each)
- Fluorescently labelled primer mix (0.1-0.5 µM each)
- Thermostable DNA polymerase (0.5-1 U)
- Thermocycling Conditions:
- Initial Denaturation: 95°C for 5 min
- 30-35 cycles of: 95°C for 30 sec, 55-60°C (primer-specific) for 30 sec, 72°C for 1 min
- Final Extension: 72°C for 7 min
- Capillary Electrophoresis:
- Instrument Setup: Prepare the CE instrument (e.g., ABI Genetic Analyzer) according to the manufacturer's instructions. Use a specified capillary array and performance-optimized polymer (e.g., POP-4) [6].
- Sample Preparation: Dilute the PCR product appropriately in deionized formamide and add a size standard (e.g., GS-600 LIZ) to each sample.
- Electrophoresis Run: Inject the sample into the capillary electrokinetically and run under denaturing conditions with suppressed electroosmotic flow.
- Data Analysis:
- Use specialized software (e.g., GeneMapper) to size the amplified fragments by comparing them to the internal size standard.
- The output for each isolate is a numerical code representing the number of repeats at each locus, which constitutes its MLVA profile.
Protocol: Broad-Range PCR and Sequencing for Pathogen Discovery
This method is used to identify unknown pathogens directly from clinical or environmental samples.
- Nucleic Acid Extraction: Extract total nucleic acid from the sample. This may involve steps to remove potential PCR inhibitors.
- Broad-Range PCR:
- Primer Selection: Use primers targeting conserved regions of a universal genetic marker, such as the 16S rRNA gene for bacteria or the ITS region for fungi and oomycetes [48] [46].
- PCR Amplification: Perform PCR with the broad-range primers. This will amplify the target gene from a wide range of organisms present in the sample.
- Sequencing: Purify the PCR product and sequence it using the Sanger method or, for complex communities, next-generation sequencing.
- Bioinformatic Identification:
- Compare the obtained sequence(s) against large public databases (e.g., GenBank) or curated custom databases (e.g., Phytophthora-ID) using tools like BLAST [48].
- The top matches with the highest percent identity and query coverage provide the putative identification.
Diagram 1: MLVA genotyping workflow using capillary electrophoresis.
Applications in Agriculture and Microbiology
The techniques described herein have profound applications in safeguarding agricultural systems and public health.
- Plant Disease Management: Accurate and early detection of plant pathogens is crucial for implementing integrated pest management (IPM) and reducing yield losses. Tools like Microbe-ID and Phytophthora-ID use BLAST analysis and genotyping to help stakeholders identify pathogens such as Phytophthora infestans (cause of potato late blight) and P. ramorum (cause of sudden oak death) rapidly, enabling targeted interventions and reducing pesticide overuse [48] [44].
- Microbial Forensics and Outbreak Investigation: In public health, genotyping is indispensable for linking cases during foodborne illness outbreaks. Techniques like PFGE and, increasingly, WGS and MLVA are used to trace the source of pathogens like E. coli O157:H7 and Salmonella back to contaminated food products [6] [47].
- Wastewater-Based Epidemiology (WBE): Molecular methods, particularly qPCR and sequencing, are applied to analyze wastewater for the presence of pathogenic bacteria (e.g., Campylobacter spp., Salmonella spp.) and their antimicrobial resistance genes. This provides a community-wide snapshot of infectious disease circulation and health threats, often before clinical cases are reported [49].
- Discovery of Novel and Uncultivable Pathogens: Molecular methods like broad-range PCR and metagenomic sequencing have enabled the discovery of pathogens that cannot be grown in the laboratory. This has dramatically expanded our understanding of microbial diversity associated with human, animal, and plant diseases [46] [50].
The Scientist's Toolkit: Essential Research Reagents and Materials
Table 3: Key Reagent Solutions for Genotyping and Pathogen Identification
| Item | Function | Example Use Case |
|---|---|---|
| Sieving Polymer (e.g., POP-4, LPA) | Acts as a molecular sieve within the capillary to separate DNA fragments by size during electrophoresis [6]. | Capillary Gel Electrophoresis for STR or MLVA fragment analysis [6]. |
| Fluorescently Labelled dNTPs/Primers | Incorporates a fluorescent tag into PCR amplicons, allowing for detection by the CE instrument's laser. | Preparation of samples for fragment analysis in MLVA or microsatellite typing. |
| Size Standard (e.g., GS-600 LIZ) | A mixture of DNA fragments of known lengths used to accurately size unknown DNA fragments in an electropherogram. | Precise sizing of amplified VNTR fragments in MLVA. |
| Broad-Range PCR Primers (e.g., 16S rDNA) | Primers designed to bind to conserved regions of a universal gene, enabling amplification from a wide range of organisms [46]. | Initial identification of unknown bacterial pathogens in a clinical or environmental sample [46]. |
| DNA Polymerase for Multiplex PCR | A robust enzyme capable of simultaneously amplifying multiple target loci in a single reaction without primer-dimer formation. | MLVA and rep-PCR genotyping protocols. |
| Reference Sequence Databases | Curated collections of genetic sequences (e.g., GenBank, LPSN, Phytophthora-ID) used for comparison and identification [48] [47]. | BLAST analysis for species identification via 16S rDNA or other gene sequences [48]. |
Diagram 2: Logical workflow for pathogen identification and genotyping.
Capillary Electrophoresis (CE) coupled with Sanger sequencing represents the gold-standard technology for targeted DNA analysis, providing accurate, unambiguous results with single-base resolution. This foundational technology enables researchers to obtain high-quality sequence data for a wide range of applications, from basic research to clinical diagnostics [51] [52]. First developed in 1977 by Frederick Sanger, the method has evolved significantly from its original implementation using slab gel electrophoresis to modern automated systems employing capillary arrays and fluorescent detection [53] [54]. The core principle remains the use of dideoxynucleotide triphosphates (ddNTPs) as DNA chain terminators, which are incorporated by DNA polymerase during template-directed synthesis, generating a series of truncated fragments that can be separated by size to reveal the DNA sequence [54] [55].
Within the broader context of capillary electrophoresis research, Sanger sequencing stands as a pivotal application that demonstrates the power of CE for resolving biomolecules with exceptional precision. The technology's exceptional accuracy, typically exceeding 99.99% (Phred score >50) for base calls in the central region of the read, establishes it as the benchmark for sequence validation [55] [52]. This technical guide explores the fundamental principles, methodologies, and applications of Sanger sequencing for mutation detection, providing researchers with comprehensive protocols and analytical frameworks to leverage this powerful technology in their genomic studies.
Fundamental Principles of Sanger Sequencing by Capillary Electrophoresis
Core Biochemical Process
The Sanger sequencing process begins with the chain termination method, where DNA synthesis is selectively halted at specific nucleotide positions. The sequencing reaction utilizes a single-stranded DNA template, a DNA primer, DNA polymerase, deoxynucleotides (dNTPs), and fluorescently labeled dideoxynucleotides (ddNTPs) [54] [55]. Each of the four ddNTPs (A, T, C, G) is tagged with a distinct fluorescent dye, enabling subsequent detection and base identification. When a ddNTP is incorporated into the growing DNA strand instead of a dNTP, the absence of a 3'-hydroxyl group prevents further elongation, terminating the chain [55]. This process generates a nested set of DNA fragments of varying lengths, each terminating at a specific base with a corresponding fluorescent label indicating the terminal nucleotide type [54].
Modern implementations have largely transitioned to the dye-terminator approach, where all four ddNTPs with different fluorescent tags are included in a single reaction tube, significantly streamlining the workflow compared to early methods that required separate reactions for each base [54]. Key innovations in DNA polymerase enzymes and dye chemistries, including the development of energy transfer dyes, have alleviated early problems with unequal peak heights and shapes, further enhancing base-calling accuracy [54].
Capillary Electrophoresis Separation Mechanism
Following the sequencing reaction, the products undergo size-based separation through capillary electrophoresis, a critical step for achieving single-base resolution. The process involves electrokinetically injecting fluorescently labeled DNA fragments into capillaries filled with a separation polymer [56]. High voltage is applied, causing the negatively charged DNA fragments to migrate through the polymer matrix toward the positive electrode [56]. The sieving matrix, traditionally cross-linked polyacrylamide but now more commonly using replaceable linear polymers such as linear polyacrylamide (LPA), retards the migration of DNA fragments according to their size [54]. This matrix enables separation of DNA molecules differing in length by just one nucleotide—the fundamental requirement for single-base resolution [56].
Shortly before reaching the positive electrode, the separated DNA fragments pass through the path of a laser beam. The laser excites the fluorescent dyes, and an optical detection system captures the emitted light at specific wavelengths [56]. Because each dye emits light at a different characteristic wavelength, all four bases can be detected and distinguished in a single capillary injection [56]. The resulting data is converted from fluorescence signals to digital information, recorded in chromatogram files (typically .ab1 format) that contain both the base sequence and quality information [56] [57].
Table 1: Key Technical Specifications of Modern Sanger Sequencing
| Parameter | Typical Performance | Notes |
|---|---|---|
| Read Length | 500-1000 bases | Contiguous reads; quality typically highest in positions 100-500 [57] [55] |
| Accuracy | >99.99% (Phred Q50+) | In central read region; single-base resolution [55] [52] |
| Sample Throughput | 1-384 capillaries | Depending on instrument configuration [56] [53] |
| Run Time | 1-2 hours | For full-length sequencing [53] |
| Template Requirement | 1-100 ng | Varies by template type and purification method [58] |
Workflow and Methodologies
Comprehensive Experimental Workflow
The following diagram illustrates the complete Sanger sequencing workflow, from sample preparation to final data analysis:
Template Preparation and Sequencing Reaction
Successful Sanger sequencing begins with high-quality template preparation. Various template types can be sequenced, including purified PCR products, plasmids, bacterial colonies, glycerol stocks, and genomic DNA [58]. For PCR products, robust amplification with specific primers is essential, followed by cleanup to remove excess primers, nucleotides, and enzymes that could interfere with the sequencing reaction [58]. For plasmid templates, adequate purification is crucial to remove contaminants such as salts, proteins, or RNA that might inhibit the sequencing reaction.
The sequencing reaction itself employs the chain termination principle with fluorescently labeled ddNTPs. Standard protocols utilize a thermal cycling program with denaturation, annealing, and extension steps to linearly amplify the terminated fragments [54] [55]. Critical parameters include template quantity and quality, primer design, and reaction conditions. For optimal results, primers should be designed to bind at least 60-100 bp upstream of the region of interest to ensure the critical bases do not fall within the poorly resolved initial region of the chromatogram [57]. Post-reaction cleanup is essential to remove unincorporated dye terminators that can cause "dye blob" artifacts around position 80 in the resulting chromatogram [57].
Capillary Electrophoresis Instrumentation and Separation
Modern genetic analyzers employ multicapillary arrays (typically 8-96 capillaries, with some systems supporting up to 384 capillaries) to enable high-throughput processing [56] [54]. The key advancement enabling this scalability was the development of replaceable polymer matrices, primarily linear polyacrylamide (LPA), which can be automatically replenished after each run, eliminating the need for manual capillary pouring and enabling continuous operation [54]. The separation occurs under denaturing conditions (elevated temperature) to ensure DNA fragments remain single-stranded and migrate strictly according to size rather than secondary structure.
The electrophoresis conditions—including polymer composition, voltage, temperature, and capillary length—are optimized to resolve DNA fragments differing by just one base pair over the entire read length. This single-base resolution is fundamental to the technology's accuracy [56]. Detection systems use confocal optics with multiple photomultiplier tubes or CCD cameras to simultaneously monitor all capillaries, with data acquisition rates sufficient for sequencing at speeds exceeding one base per second per capillary [54].
Table 2: Essential Research Reagent Solutions for Sanger Sequencing
| Reagent Category | Specific Examples | Function in Workflow |
|---|---|---|
| DNA Polymerase | BigDye Terminator v3.1, SequiTerm | Catalyzes template-directed DNA synthesis with incorporation of fluorescent ddNTPs |
| Fluorescent Dyes | FAM, JOE, TAMRA, ROX (or equivalents) | Four-color dye set for base-specific labeling; enables single-tube reactions [54] |
| Separation Matrix | POP-7, Linear Polyacrylamide (LPA) | Replaceable polymer for size-based separation of DNA fragments [54] |
| Capillary Arrays | 36-capillary, 96-capillary arrays | High-throughput simultaneous analysis of multiple samples [56] |
| Sequence Analysis Software | ICE, TIDE, Phred, KB Analysis | Base calling, quality assessment, and variant identification [57] [59] |
Data Analysis and Quality Assessment
Chromatogram Interpretation and Quality Metrics
Sanger sequencing data output consists of two primary components: the chromatogram (trace or .ab1 file) showing the raw fluorescence data, and the text-based sequence file [57]. While the text sequence might seem to contain all relevant information, the chromatogram provides critical data about base-calling accuracy and must be visually inspected, particularly for regions with potential mutations [57]. The chromatogram displays fluorescence intensity (in relative fluorescence units) on the y-axis versus migration time (correlated with base position) on the x-axis, with each of the four bases represented in a distinct color [57].
Several quality metrics aid in assessing data reliability. The Quality Value (QV) is assigned to each base and is logarithmically related to the base-calling error probability: QV = -10 × log(error probability) [57]. For example, a QV of 20 corresponds to a 1% error probability, while a QV of 30 indicates a 0.1% error probability. The Quality Score (QS) represents the average QV for all bases in the trace, providing an overall quality metric—traces with QS ≥ 40 generally indicate high-quality data [57]. The Continuous Read Length (CRL) identifies the longest uninterrupted stretch of bases with a running 20-base average QV of 20 or higher; for plasmid samples and PCR products >500 bp, CRL values above 500 indicate high-quality data [57].
Troubleshooting Common Data Quality Issues
Understanding common chromatogram artifacts is essential for proper data interpretation. The initial 20-40 bases typically show poor resolution due to unpredictable migration of very short DNA fragments, often resulting in Ns in the sequence [57]. Dye blobs—broad peaks typically around position 80—represent aggregates of unincorporated dye terminators that can interfere with base calling in that region [57]. Toward the end of the trace, peaks become less defined and lower in intensity due to decreased production of larger sequencing products and reduced resolution for larger fragments [57]. For PCR products, non-template nucleotide addition by Taq polymerase can cause terminal A peaks followed by an abrupt signal drop [57].
The following diagram illustrates the relationship between sequence position and data quality, highlighting common artifacts and optimal sequencing regions:
Mutation Detection Applications and Protocols
Detection of Somatic Mutations in Oncology
Sanger sequencing by CE is extensively utilized for detecting clinically relevant mutations in cancer research and molecular diagnostics. Its high accuracy makes it particularly valuable for identifying both known and unknown mutations in oncogenes and tumor suppressor genes [51]. For example, KRAS mutations are frequently assessed in colorectal cancer and other malignancies, as specific KRAS mutants are associated with poor prognosis and can predict response to targeted therapies [51]. A standardized workflow for KRAS mutation detection can provide reproducible identification of mutations in less than six hours, using PCR primer assays followed by sequencing with forward and reverse primers to confirm mutations [51].
Another significant application is the detection of FLT3 internal tandem duplications (ITD) in acute myeloid leukemia (AML), present in approximately 30% of newly diagnosed patients and associated with poor prognosis [51]. Fragment analysis by CE provides accurate and sensitive detection of ITD mutations, which can range from 3 to over 400 bp in length, with analytical sensitivity down to a single nucleotide and capability for relative quantification [51]. Both delta-PCR and tandem duplication (TD)-PCR methods have been successfully employed, with studies showing slightly better results from TD-PCR, detecting FLT3-ITD mutations at levels as low as four copies [51].
Protocol for KRAS Mutation Detection
Objective: Detect known and unknown KRAS mutations in tumor samples using Sanger sequencing.
Materials:
- Tumor DNA sample (10-50 ng/µL)
- KRAS-specific PCR primers
- BigDye Terminator v3.1 Cycle Sequencing Kit
- Centrifugal filters or ethanol precipitation reagents for cleanup
- Capillary Electrophoresis System with polymer and buffer
Methodology:
- PCR Amplification: Amplify the target region of the KRAS gene (e.g., codons 12 and 13) using gene-specific primers.
- PCR Product Purification: Clean amplified products to remove excess primers and dNTPs using column-based or enzymatic cleanup.
- Cycle Sequencing Reaction:
- Set up reaction with purified PCR product, sequencing primer, and Ready Reaction Mix
- Thermal cycling: 96°C for 1 min, then 25 cycles of 96°C for 10s, 50°C for 5s, 60°C for 4 min
- Sequencing Product Purification: Remove unincorporated dye terminators using column purification or ethanol precipitation.
- Capillary Electrophoresis:
- Resuspend purified products in Hi-Di Formamide
- Denature at 95°C for 5 minutes, then snap-cool on ice
- Inject electrokinetically and run on appropriate CE instrument
- Data Analysis:
- Analyze chromatograms using variant calling software
- Visually inspect traces for mutant peaks confirming mutations
Expected Results: Clear chromatograms showing wild-type sequence or mixed peaks at mutation sites (e.g., G12A, G12D, G13D). Forward and reverse sequencing should provide concordant results [51].
Gene Editing Verification
Sanger sequencing serves as the gold standard for verifying genome editing outcomes, including CRISPR-Cas9-mediated modifications [51] [53] [59]. After CRISPR editing, the target region is PCR-amplified and sequenced. The resulting chromatograms are analyzed using specialized software such as Tracking of Indels by Decomposition (TIDE) or Inference of CRISPR Edits (ICE) to quantify editing efficiency and characterize the spectrum of induced mutations [51] [59]. In mixed cell populations, the sequencing traces show mixed-base peaks downstream of the cleavage site, and decomposition algorithms can determine the distribution of specific insertion and deletion patterns [51]. This approach has demonstrated high correlation with traditional cloning and sequencing methods while being significantly faster and more efficient [51].
Table 3: Mutation Detection Capabilities of Sanger Sequencing
| Mutation Type | Detection Method | Applications | Limitations |
|---|---|---|---|
| Single Nucleotide Variants (SNVs) | Direct sequence comparison | KRAS, NRAS, BRAF mutations in cancer | Detection limit ~15-20% variant allele frequency [55] |
| Small Insertions/Deletions (Indels) | Frame shifts in sequence | FLT3-ITD in AML, CRISPR editing verification | Difficult to sequence through long homopolymer regions [51] [59] |
| DNA Methylation | Bisulfite sequencing | Epigenetic studies in cancer | Requires bisulfite conversion; degrades DNA [51] |
| Structural Variants | Breakpoint sequencing | Translocation verification | Requires knowledge of breakpoint regions |
Comparison with Next-Generation Sequencing
Complementary Roles in Genomic Analysis
While Next-Generation Sequencing technologies provide unprecedented throughput for comprehensive genomic analyses, Sanger sequencing maintains distinct advantages for targeted applications [55] [60]. The table below summarizes the key differences between these complementary technologies:
Table 4: Sanger Sequencing vs. Next-Generation Sequencing
| Parameter | Sanger Sequencing | Next-Generation Sequencing |
|---|---|---|
| Fundamental Method | Chain termination with ddNTPs | Massively parallel sequencing (various chemistries) |
| Throughput | Low to medium (1-384 samples per run) | Extremely high (millions to billions of reads) |
| Read Length | Long (500-1000 bp), contiguous | Short to medium (50-300 bp for Illumina; longer for other technologies) |
| Accuracy | Very high per-read accuracy (>Q50) | High accuracy through consensus (30-1000x coverage) |
| Cost Model | Low cost per run, high cost per base | High capital and per-run cost, low cost per base |
| Optimal Applications | Targeted confirmation, single-gene testing, validation | Whole genomes, exomes, transcriptomes, complex screening |
| Bioinformatics Requirements | Minimal, basic alignment tools | Extensive, specialized pipelines and computing resources |
Strategic Implementation in Research Workflows
The complementary strengths of Sanger sequencing and NGS enable researchers to design efficient, cost-effective genomic studies. NGS excels at discovery-phase applications, such as identifying novel mutations across entire genomes or exomes, analyzing heterogeneous tumor samples for low-frequency variants, and conducting comprehensive profiling of transcriptomes or epigenomes [55] [60]. In contrast, Sanger sequencing provides the validation gold standard for confirming variants identified by NGS, sequencing single-gene targets in diagnostic settings, and verifying DNA constructs in molecular biology workflows [55]. This division of labor leverages the respective strengths of each technology—NGS for comprehensive screening and Sanger for definitive confirmation of specific variants.
For clinical applications, Sanger sequencing remains particularly valuable when high certainty is required for a defined genomic target, such as in confirmatory diagnostic testing for hereditary disorders or validation of oncogenic mutations that will guide treatment decisions [55] [60]. The technology's long read length enables sequencing across entire genes or multiple exons in single reactions, simplifying the analysis of genetically heterogeneous disorders [60].
Technological Advancements
Despite being a mature technology, Sanger sequencing continues to evolve through technical improvements in sequencing speed, accuracy, and throughput [53]. Next-generation CE instruments feature more efficient capillary arrays and faster electrophoretic separation technologies, reducing run times from several hours to 1-2 hours for standard sequencing [53]. Enhancements in DNA polymerase fidelity and fluorescence detection systems have further improved base-calling accuracy, with error rates potentially dropping to 0.01% or lower through bidirectional sequencing or technical replicates [53].
Emerging innovations include the integration of microfluidic chip technology to enable thousands of simultaneous sequencing reactions on a single device, dramatically reducing reagent consumption and reaction times while increasing parallelism [53]. The application of artificial intelligence algorithms for base calling and quality assessment shows promise for enhancing data interpretation, particularly for challenging sequences with complex artifacts or low signal-to-noise ratios [53]. These continued refinements ensure that Sanger sequencing will maintain its relevance as a precision tool for targeted genomic analysis.
Sanger sequencing by capillary electrophoresis remains an indispensable technology for achieving single-base resolution in mutation detection and DNA sequence verification. Its unparalleled accuracy, long read lengths, and technical robustness cement its position as the gold standard for validating genomic variants identified through high-throughput methods [55] [52]. As genomic medicine advances, the complementary relationship between NGS for comprehensive discovery and Sanger sequencing for precise confirmation will continue to drive both basic research and clinical diagnostics forward [55] [60].
For researchers and drug development professionals, understanding the principles, methodologies, and applications detailed in this technical guide enables optimal implementation of Sanger sequencing within broader genomic workflows. By leveraging its precision for targeted analysis while utilizing NGS for exploratory studies, the scientific community can continue to advance our understanding of genetic variation and its role in health and disease.
Troubleshooting and Optimization: Ensuring Reproducible High-Resolution Results
Capillary gel electrophoresis (CGE) has emerged as a powerful analytical technique for the separation and analysis of DNA fragments and nucleic acids, offering significant advantages over traditional slab gel electrophoresis in terms of speed, resolution, automation, and quantitative capabilities [61]. The technique operates on the principle of separating fluorescently-labeled DNA fragments by size as they migrate through very thin, polymer-filled capillaries under the influence of a strong electric field [62]. The optimization of key parameters—gel concentration, capillary temperature, and denaturants—is critical for achieving high-resolution separations, accurate sizing, and reproducible results across various applications, from genotyping and mutation detection to the quality control of mRNA therapeutics [63] [40]. This guide provides an in-depth examination of these core parameters within the broader context of capillary electrophoresis principles for DNA analysis research, offering structured data, detailed protocols, and practical insights for researchers and drug development professionals.
The performance of CGE separations is governed by several interdependent parameters. Understanding their individual and combined effects is fundamental to method development. The tables below summarize key optimization data and reagent solutions.
Table 1: Optimization of Key Electrophoresis Parameters for DNA Separation
| Parameter | Optimal Conditions / Range | Impact on Separation Performance | Application Notes |
|---|---|---|---|
| Gel Concentration / Polymer Type | Hydroxyethyl cellulose (HEC) or Performance Optimized Polymer 4 (POP-4) [64] [63]. Low-viscosity, flowable polymers for replaceable matrices [63]. | Higher polymer concentrations improve resolution of larger DNA fragments [64]. HEC and non-crosslinked polyacrylamide replaceable gels showed comparable results and better reproducibility than cross-linked polyacrylamide [64]. | POP-4 is designed for high-resolution fragment analysis up to 350 nucleotides, enabling single-nucleotide separation [63]. |
| Capillary Temperature | 60°C for high-precision sizing of microsatellites [63]. 50-60°C for HPLC separation of DNA fragments; minimal effect on CE for fragments <267 bp [65]. | Elevated temperature is mandatory for suppressing DNA secondary structures, ensuring uniform mobility, and achieving high precision and resolution [63]. At 60°C, resolution of fragments >434 bp in HPLC worsened [65]. | Temperature control is critical for denaturing applications. For mRNA analysis, temperature is a key factor affecting the separation of long-chain RNAs [12]. |
| Denaturants | Urea and formamide [63] [66]. Use of denaturants is mandatory for high-precision sizing [63]. | Denaturants suppress secondary structures in nucleic acids that can affect mobility and sizing accuracy [63]. Formamide in non-aqueous gels provides a 6-fold increase in resolution for large RNAs (~2000 nt) [66]. | Strongly denaturing, non-aqueous conditions (e.g., formamide as solvent) enable high-resolution separation of large RNA molecules by size [66]. |
| Electric Field / Voltage | Moderate field strength (200 V/cm) for high throughput [64]. 6 kV separation voltage on a 36 cm capillary array (approx. 167 V/cm) [67]. | Resolution of large fragments is higher at lower field strength at a constant column length [64]. Analysis is fastest using a short capillary and moderate field strength [64]. | A 1 cm capillary at 185 V/cm separated small DNA fragments in under 1 minute [64]. |
| Capillary Length | Short capillaries (2-7 cm) for high throughput; longer capillaries for better resolution of large fragments [64]. | Resolution of large fragments is directly proportional to column length at the same field strength [64]. | Throughput with a single short capillary is comparable to slab gel but more economical [64]. |
Table 2: Research Reagent Solutions for Capillary Gel Electrophoresis
| Reagent / Material | Function / Purpose | Examples & Notes |
|---|---|---|
| Sieving Polymers | Creates a dynamic sieving matrix for separation of DNA fragments by size. | POP-4: A ready-to-use, low-viscosity polymer containing denaturants for high-precision genotyping [63]. Hydroxyethyl Cellulose (HEC): A liquid gel offering reproducible results for DNA fragment separation [64]. Linear Polyacrylamide: Used as a separation gel for oligonucleotide sizing [67]. |
| Denaturants | Disrupts secondary structures in nucleic acids to ensure migration is based solely on length. | Urea: Used in polymers like POP-4 to denature DNA for precise sizing [63]. Formamide: Employed in non-aqueous gels for high-resolution separation of large RNAs [66]. |
| Fluorescent Dyes & Labels | Enables sensitive laser-induced fluorescence (LIF) detection of DNA fragments. | Intercalating Dyes: (e.g., YO-PRO-1). Covalent Labels: (e.g., WellRed D4 for samples, WellRed D1 for standards). Using identical labels for samples and primary standards is critical for absolute sizing accuracy [67]. |
| Size Standards | For accurate fragment sizing by providing a calibration curve. | Commercial Standards: (e.g., WellRedD1-labeled kits). Primary Standards: Synthesized fragments with the same sequence and fluorophore as the samples for absolute sizing accuracy, correcting for mobility shifts [67]. |
| Running Buffers | Provides the conductive medium for electrophoresis. | Must be compatible with the polymer and detection method. Buffer ionic strength is a key parameter affecting migration time and resolution [64]. |
Detailed Experimental Protocols
Protocol: High-Resolution Genotyping Using Denaturing CE
This protocol is adapted from methods for high-precision genotyping of short tandem repeats (STRs), which requires standard deviations in sizing of ≤0.15 nucleotides for 99.7% confidence in allele binning [63].
Sample Preparation:
- PCR Amplification: Amplify target DNA sequences (e.g., microsatellite markers) using one primer labeled at the 5' end with a fluorescent dye (e.g., WellRed D4).
- Denaturation: Denature the PCR products at 90°C for 120 seconds to ensure single-stranded fragments [67].
- Internal Standard: Mix the denatured sample with an internal size standard labeled with a different fluorophore (e.g., WellRed D1).
Instrument Setup:
- Capillary: Use an uncoated fused-silica capillary. The polymer itself should provide dynamic coating to suppress electroosmotic flow [63].
- Polymer: Fill the capillary with a denaturing, replaceable polymer matrix such as Performance Optimized Polymer 4 (POP-4) [63].
- Temperature: Set the capillary oven temperature to 60°C. This is mandatory for uniform denaturation and high precision [63].
- Voltage Conditions: Apply an electrokinetic injection at 2 kV for 30 seconds, followed by a separation voltage of 6 kV [67].
Data Analysis:
- Sizing: Software calculates the size of unknown fragments by comparing their migration times to the internal standard curve.
- Precision Validation: The standard deviation of fragment sizing should fall within the range of 0.04 to 0.17 nucleotides for high-quality genotyping [63].
Protocol: Accurate Oligonucleotide Sizing for DNA Damage Mapping
This protocol outlines a method for precise sizing of oligonucleotide fragments to map DNA damage sites, using CE-LIF with two-color detection and primary standards for absolute accuracy [67].
Sample Processing:
- Labeling: Generate a 5'-fluorophore-labeled oligonucleotide (e.g., using a WellRedD4-labeled primer).
- Damage Induction & Cleavage: Incubate the labeled DNA with a DNA-damaging agent. Subsequently, treat it to cleave at the damaged sites (e.g., depurination of alkylated bases followed by piperidine cleavage).
- Purification: Desalt the sample using Centricon filters with a 3000 Da molecular weight cutoff.
Primary Standard Synthesis:
- Synthesize and purify a set of oligonucleotide fragments that have identical sequences and the same fluorophore as your sample fragments. These will serve as "primary standards" [67].
CE-LIF Analysis with Two Capillaries:
- Capillary 1 (Sample with Commercial Standard): Electrokinetically inject the processed sample mixed with a commercial size standard (different fluorophore, e.g., WellRedD1) onto a capillary array. Use a linear polyacrylamide gel, a separation voltage of 6 kV, and a temperature of 60°C [67].
- Capillary 2 (Primary Standard with Commercial Standard): In a separate run, inject the primary standards mixed with the same commercial standard.
- Sizing and Correction: The commercial standard is used to normalize migration times across different capillaries. The primary standards are used to create a corrected, sequence-specific sizing curve. The sizes of the sample fragments are determined by referring to this corrected curve, eliminating mobility shifts caused by sequence and dye effects [67].
Workflow Visualization and Logical Relationships
The following diagram illustrates the core logical workflow for developing an optimized capillary gel electrophoresis method, integrating the key parameters discussed in this guide.
The workflow for mRNA integrity and poly(A) tail length analysis has been refined into a high-throughput parallel CGE workflow, which can be visualized as follows.
The meticulous optimization of gel concentration, capillary temperature, and denaturants forms the cornerstone of robust and reliable capillary gel electrophoresis methods for nucleic acid analysis. The selection of an appropriate polymer matrix, such as HEC or POP-4, establishes the foundation for size-based separation. The strategic use of elevated temperature and denaturing agents like urea and formamide is critical for eliminating molecular secondary structures, thereby ensuring that electrophoretic mobility is a function of fragment length alone, which is paramount for achieving high resolution and precise sizing. By systematically applying the principles, data, and protocols outlined in this guide, researchers can effectively develop and refine CE methods to meet the demanding requirements of modern genetic analysis, drug development, and quality control of nucleic acid-based therapeutics.
In capillary electrophoresis (CE), achieving sharp, well-resolved peaks is paramount for accurate DNA analysis. However, artifacts like peak broadening (the capillary-scale equivalent of "smearing"), poor resolution, and anomalous peaks can compromise data integrity. This guide details the origins of these common CE artifacts and provides validated methodologies for their prevention and resolution, ensuring data meets the high standards required for research and drug development.
Capillary Electrophoresis (CE) has become a cornerstone technique in molecular biology and biochemistry, particularly for the high-resolution analysis of DNA. Its advantages over traditional slab gel electrophoresis include superior resolution, often at the single-nucleotide level, minimal sample consumption, and a high degree of automation [68] [69]. Despite its power, CE data can be affected by various artifacts that, if misinterpreted, can lead to incorrect conclusions in critical research, such as drug development and clinical diagnostics. These artifacts—manifesting as poor resolution, peak broadening (smearing), and spurious peaks—often stem from subtle interactions between the sample, the capillary surface, and the separation conditions. Understanding their root causes is the first step in developing robust, reliable analytical methods. This guide provides an in-depth examination of these common issues, framed within the principles of CE, and offers detailed protocols for their mitigation.
Understanding and Addressing Poor Band Resolution
Poor resolution, where adjacent peaks are not fully separated, fundamentally limits the analytical utility of CE.
Primary Causes
- Inadequate Method Optimization: The composition of the Background Electrolyte (BGE) is critical. An inappropriate pH or ionic strength can insufficiently differentiate the electrophoretic mobilities of similar analytes [70] [71].
- Excessive Joule Heating: When the heat generated by the applied voltage is not effectively dissipated, it creates temperature gradients within the capillary. This causes variations in buffer viscosity and analyte mobility, leading to peak broadening and loss of resolution [70].
- Sample Overloading: Injecting too much sample can overwhelm the separation capacity of the capillary, causing peaks to widen and coalesce [69].
Experimental Optimization Protocol
A systematic approach, such as Response Surface Methodology (RSM), can efficiently optimize multiple parameters simultaneously. The following protocol is adapted from a study on separating pharmaceutical contaminants [71].
- Step 1: Central Composite Design (CCD). Design an experiment investigating three key factors: BGE concentration (e.g., 20-100 mM), BGE pH, and applied voltage. A typical CCD for three factors requires 20 experimental runs.
- Step 2: Response Measurement. For each run, analyze a standard mixture of your target analytes. The critical responses to measure are the resolution (Rs) between each critical pair of peaks and the total migration time. Resolution is calculated as: ( Rs = \frac{1.18 \times (t{mig2} - t{mig1})}{(w{0.5h1} + w{0.5h2})} ) where ( t{mig1} ) and ( t{mig2} ) are the migration times of the two peaks, and ( w{0.5h1} ) and ( w_{0.5h2} ) are their widths at half height [71].
- Step 3: Statistical Analysis and Model Validation. Use analysis of variance (ANOVA) on the data to identify which factors and their interactions significantly affect resolution and migration time. The model's validity is assessed through the coefficient of determination (R²), lack-of-fit tests, and p-values. Once a model is established, it can predict the optimal conditions for maximum resolution within a minimal analysis time [71].
Additional Mitigation Strategies
- Voltage and Capillary Dimension Optimization: Perform a voltage ramping study to find the maximum voltage that can be applied without causing current instability, a sign of excessive Joule heating. Using capillaries with a smaller internal diameter (e.g., 50 µm) improves heat dissipation, allowing for the use of higher electric fields [70].
- Sample Stacking: Implement field-amplified sample stacking (FASS) by preparing the sample in a low-conductivity matrix (e.g., water). When voltage is applied, the analytes focus into a narrow zone at the interface with the higher-conductivity BGE, sharpening the peaks and improving resolution [70].
Investigating Smearing and Peak Broadening
Peak broadening in CE is the direct analog of band smearing in gel electrophoresis and is a key metric of separation inefficiency.
Root Causes
- Adsorption to Capillary Wall: The silanol groups (Si-OH) on the fused-silica capillary wall can ionize at moderate to high pH, creating a negative surface. Positively charged analytes, such as basic proteins or peptides, can adsorb to this surface, causing severe peak tailing and broadening [70].
- Joule Heating: As noted for resolution, uncontrolled thermal effects are a primary cause of band broadening. The parabolic flow profile induced by radial temperature gradients directly reduces separation efficiency [70].
- Injection Plug Length and Matrix Effects: Hydrodynamically injecting too much sample creates a long, diffuse starting zone within the capillary. Furthermore, a significant mismatch between the conductivity of the sample solvent and the BGE can cause "band deformation," leading to broad or distorted peaks [70].
Protocol: Assessing and Mitigating Wall Adsorption
This protocol is crucial for analyzing proteins or other analytes prone to adsorption.
- Step 1: Diagnose Adsorption. Compare the efficiency (theoretical plates) of a neutral marker to that of your analyte. A significantly lower efficiency for the analyte is a strong indicator of wall adsorption.
- Step 2: Apply a Dynamic Coating. Add a cationic polymer (e.g., 0.001% Polybrene) or a neutral polymer (e.g., hydroxypropyl methylcellulose) to the BGE. These agents adsorb to the capillary wall, shielding the negative charges and preventing analyte interaction. This is a flexible and easily implemented solution [70].
- Step 3: Consider a Permanent Coating. For the highest reproducibility and stability, use a capillary with a permanent, covalently bonded coating. These coatings, such as hydrophilic polymers or polyacrylamide, are highly stable but more expensive and not user-replaceable in most systems [70].
Additional Mitigation Strategies
- Optimize Injection. Use the shortest possible injection time or pressure that provides adequate signal-to-noise. The ideal sample solvent is a diluted version of the BGE or pure water to facilitate stacking and minimize conductivity mismatch [70].
- Control Thermal Effects. Ensure the instrument's capillary cooling system is functioning correctly. Using a BGE with lower ionic strength can reduce current and associated Joule heating, albeit at the potential cost of buffer capacity [70].
Case Study: Eosin Artifact and Spurious Peaks
Not all peaks in an electropherogram represent the target analytes. Spurious peaks can arise from contaminants in the sample itself, a phenomenon highlighted by a case study involving the histological dye eosin.
Case Background and Detection
During routine CE analysis of immunoglobulin heavy chain (IGH) gene rearrangement from a formalin-fixed, paraffin-embedded tissue sample, a dominant peak at 71 bases was observed. This peak was initially suspicious for a monoclonal B-cell population. However, a key observation raised suspicion: the peak fluoresced in multiple colors (blue > green > yellow), unlike a true PCR product labeled with a single fluorophore [72].
Experimental Protocol for Diagnosing a Sample-Derived Artifact
- Step 1: Analyze Genomic DNA Without PCR Amplification. The DNA sample isolated from the tissue was diluted and run directly on the CE instrument without prior PCR. The 71-base peak was still present, confirming the contaminant was within the DNA sample itself and not a product of the PCR process [72].
- Step 2: Identify the Source. The fixed tissue block was reviewed, and it was noted that the tissue had been stained with eosin before embedding. Eosin, a fluorescent dye, was not completely removed during the standard DNA purification process [72].
- Step 3: Confirm with a Control. A solution of eosin was run on the CE instrument, and it produced a discrete peak at 71 bases with identical fluorescent properties to the contaminant peak observed in the patient sample [72].
Solution and Broader Implications
The artifact was eliminated by implementing more stringent DNA purification steps. This case underscores that histological dyes may fluoresce under the laser-induced fluorescence detection used in CE. It is critical to consider artifacts from such compounds when primary peaks contain underlying peaks of other colors, as this is a hallmark of a fluorescent contaminant rather than a specific, dye-labeled amplicon [72].
The Scientist's Toolkit: Essential Reagents and Materials
The following table details key reagents and materials essential for developing and troubleshooting CE methods.
| Item | Function in Capillary Electrophoresis |
|---|---|
| Background Electrolyte (BGE) | The conductive buffer that fills the capillary; its composition (pH, ionic strength, additives) is the primary determinant of separation selectivity and efficiency [70] [71]. |
| Fused-Silica Capillary | The narrow-bore tube where separation occurs; its inner wall chemistry and dimensions (diameter, length) critically impact EOF, adsorption, and Joule heating [70] [69]. |
| Capillary Coating (Dynamic/Permanent) | Modifies the capillary wall to suppress analyte adsorption and stabilize EOF, which is crucial for achieving symmetric peaks and high reproducibility [70]. |
| Internal Size Standard | A cocktail of DNA fragments of known sizes labeled with a different fluorophore, co-injected with every sample to ensure accurate sizing of unknown fragments [72]. |
| Solid-Phase Extraction (SPE) Kit | Used for sample cleanup to remove interfering contaminants (like salts, proteins, or dyes like eosin) and preconcentrate analytes, improving signal and preventing artifacts [72] [71]. |
The power of capillary electrophoresis for DNA analysis is undeniable, but its data must be treated with critical scrutiny. Artifacts such as poor resolution, peak broadening, and spurious fluorescent peaks are not mere nuisances; they are indicators of suboptimal methods or sample impurities. As demonstrated, a systematic approach grounded in the principles of CE—involving rigorous method optimization with tools like CCD, careful management of thermal effects and surface interactions, and vigilant sample preparation—is essential for generating reliable, publication-quality data. By understanding and addressing these common artifacts, researchers and drug development professionals can fully leverage the high-resolution capabilities of CE to drive their scientific discoveries forward.
Diagram: CE Artifact Troubleshooting Workflow
The diagram below outlines a systematic workflow for diagnosing and addressing the common artifacts discussed in this guide.
Strategies for Improving Peak Resolution and Separation Limits for Long RNAs
Within the broader principles of capillary electrophoresis (CE) for nucleic acid analysis, achieving high peak resolution and extended separation limits for long RNA molecules presents distinct technical challenges. The analysis of messenger RNA (mRNA), a key modality in modern therapeutics, demands techniques capable of resolving molecules that can range from 500 to over 4000 nucleotides (nt) in length [73]. These large, single-stranded transcripts are susceptible to degradation and structural heterogeneity, making their separation and characterization critical for ensuring the quality, stability, and efficacy of RNA-based biotherapeutics, such as vaccines and genetic medicines [73] [74]. This technical guide details optimized strategies and methodologies to push the boundaries of capillary gel electrophoresis (CGE) for the analysis of long RNAs, directly addressing the factors that influence separation performance.
Key Analytical Factors for Resolution and Separation Limits
The resolution of long RNA species and the effective separation limit of CGE are not functions of a single parameter but are influenced by a complex interplay of several analytical factors. Systematic optimization of these parameters is required to achieve sufficient resolution for detailed quality analysis.
Table 1: Key Analytical Factors for Optimizing RNA Separation in CGE
| Analytical Factor | Impact on Separation | Optimized Condition / Strategy |
|---|---|---|
| Gel Matrix Concentration | Determines the sieving properties; affects migration time and resolution of different RNA fragment sizes [12]. | Adjust polymer concentration to balance resolution of large and small fragments; higher concentrations can improve separation of long RNAs [12]. |
| Denaturant Type & Concentration | Prevents RNA secondary structure, ensuring separation is based on length rather than conformation [74]. | Use of high urea concentrations; avoidance of formamide as a sample diluent to prevent masking of late-migrating impurities [74]. |
| Capillary Temperature | Influences RNA stability and interaction with the capillary wall and gel matrix [12]. | Optimize to reduce sample adsorption and maintain denatured state; typically elevated (e.g., 50-70°C). |
| Fluorescent Dye | Critical for detection sensitivity; can interact with RNA and affect migration [12] [74]. | Use of high concentrations of RNA-binding dyes like SYBR Green II for enhanced sensitivity [74]. |
| Sample Pre-Treatment | Ensures the RNA is in a denatured, linear state prior to injection [12] [73]. | Includes preheating and the use of chaotropes; for Lipid Nanoparticles (LNPs), a disruption protocol is essential [73] [74]. |
| Electric Field Strength | Affects speed of separation and resolution; high fields can generate heat, leading to band broadening. | Optimize voltage and run time to balance throughput with resolution, particularly for fragments >4000 nt. |
Under adjusted conditions, CGE can effectively separate RNAs up to approximately 4000 nucleotides and resolve defective RNA fragments differing by ≥200 nucleotides [12]. This high resolution is crucial for accurately quantifying critical quality attributes, such as the presence of truncated species ("shortmers") or extended/aggregated impurities ("longmers") [73].
Detailed Experimental Protocols for Method Optimization
Protocol 1: Optimized CGE-LIF for mRNA Integrity Analysis
This protocol is designed for the high-throughput analysis of mRNA integrity, both for "naked" mRNA and mRNA extracted from lipid nanoparticles (LNPs) [73] [74].
- Sample Preparation:
- Naked mRNA: Dilute mRNA in a nuclease-free buffer. Denature the sample by heating at 70-80°C for 2-5 minutes and immediately placing it on ice [73].
- LNP-Encapsulated mRNA: Extract mRNA from LNPs using a disruption protocol. This involves adding surfactants (e.g., Triton X-100, NP-40) to dissolve the lipid bilayer and release the RNA payload. Subsequent purification via isopropanol precipitation is recommended to concentrate the sample and remove contaminants [74].
- Gel and Buffer System:
- Prepare a sieving matrix using an entangled polymer, such as polyvinylpyrrolidone (PVP).
- Use a Tris-Borate-EDTA (TBE) buffer system.
- Incorporate denaturants at optimized concentrations: high urea (e.g., 6-8 M) is critical, while formamide should be avoided in the sample diluent to ensure the detection of late-migrating smear (LMS) impurities [74].
- Instrument Parameters:
- Utilize a multi-capillary array system (e.g., 48-capillary) for high-throughput analysis.
- Set the capillary temperature to an elevated level (e.g., 50-70°C) to maintain denaturing conditions.
- Apply an appropriate electric field strength. Run times can be optimized from 40 to 130 minutes depending on the required resolution [73].
- Detection:
- Use Laser-Induced Fluorescence (LIF) detection with a high concentration of an intercalating dye like SYBR Green II for maximum sensitivity [74].
- Data Analysis:
- For integrity analysis, the percentage of peak area is a more reliable metric than absolute peak area quantification [73].
- Use semi-automated data processing pipelines for robust and reproducible mRNA integrity profiling.
Protocol 2: RNA Structural Analysis via SHAPE and CGE
This protocol leverages Selective 2'-Hydroxyl Acylation Analyzed by Primer Extension (SHAPE) to probe RNA structure, which can indirectly inform on separation behavior by revealing conformational states [75].
Diagram 1: RNA SHAPE Analysis Workflow
- RNA Conditioning and Probing:
- Condition approximately 12 pmol of RNA in a high-salt buffer containing magnesium and potassium chloride to foster native structure.
- Split the conditioned RNA into two equal volumes.
- Positive SHAPE Reaction: Add N-Methylisatoic anhydride (NMIA) to one aliquot and incubate at 37°C for 50 minutes. NMIA acylates flexible, unconstrained nucleotides.
- Negative Control Reaction: Add dimethyl sulfoxide (DMSO) to the second aliquot.
- Post-Reaction Processing:
- Recover the modified and control RNA by ethanol precipitation and reconstitute in TE buffer.
- Primer Extension:
- For the positive reaction, add a fluorophore-labeled primer (e.g., Cy5) and conduct reverse transcription. The enzyme will stop at sites of NMIA modification.
- For the control reaction, use a primer labeled with a different fluorophore (e.g., Cy5.5).
- Sequencing Ladders:
- Generate DNA sequencing ladders (using ddC and ddT termination methods) from a DNA plasmid template matching the RNA sequence. Use primers labeled with distinct fluorophores (e.g., Alexa 750, IR800CW).
- CGE Analysis:
- Combine the positive SHAPE reaction, control reaction, and sequencing ladders in an optimized ratio.
- Separate the nucleic acid fragments using automated CGE.
- Data Analysis and Structural Modeling:
- Analyze electropherograms with software like ShapeFinder to calculate SHAPE reactivity values, which indicate nucleotide flexibility.
- Use computational tools (e.g., RNAthor) for RNA secondary structure modeling guided by the SHAPE reactivity data [75].
The Scientist's Toolkit: Essential Reagents and Materials
Table 2: Key Research Reagent Solutions for RNA CGE
| Reagent / Material | Function / Purpose | Examples / Notes |
|---|---|---|
| Entangled Polymer Matrix | Acts as a molecular sieve; separates RNA fragments by hydrodynamic size [12]. | Polyvinylpyrrolidone (PVP) is commonly used [76] [74]. |
| Denaturing Agents | Disrupts RNA secondary structure to ensure separation by chain length [74]. | Urea (at high concentrations); preferred over formamide for certain impurity profiles [74]. |
| Fluorescent Dyes | Enables sensitive detection of separated RNA bands/fragments. | SYBR Green II; high dye concentrations improve signal [74]. |
| Surfactants | Disrupts lipid nanoparticles (LNPs) to release encapsulated mRNA for analysis [73] [74]. | Triton X-100, NP-40, Sodium Lauryl Sulfate (SLS). |
| Chemical Probing Reagents | Modifies RNA at unstructured regions for structural analysis (e.g., SHAPE) [75]. | N-Methylisatoic anhydride (NMIA). |
| Fluorophore-Labeled Primers | Used in conjunction with reverse transcription to map sites of RNA modification or cleavage. | Cy5, Cy5.5, Alexa 750, IR800CW for multiplexed CGE [75]. |
The relentless advancement of RNA therapeutics necessitates equally advanced analytical techniques. Through the systematic optimization of key parameters—gel composition, denaturants, temperature, and sample preparation—capillary gel electrophoresis can be pushed to its limits, providing the resolution and separation power required to characterize long RNA molecules thoroughly. The protocols and data presented herein offer a robust framework for researchers to develop and refine their CGE methods, ensuring the rigorous quality control essential for the next generation of mRNA-based medicines.
Mitigating Sample Degradation and Managing Buffer Conditions
Capillary Electrophoresis (CE) stands as a cornerstone technique in modern DNA analysis, enabling high-resolution separation of DNA fragments based on size. Its application is vital in fields from forensic genetics to clinical diagnostics. However, the integrity of the results is profoundly dependent on the quality of the input DNA sample. Sample degradation represents a significant and frequent challenge, potentially compromising data reliability. Degraded DNA, which has undergone damage from factors like environmental exposure, time, or improper storage, becomes fragmented. This fragmentation directly impacts analysis by limiting the ability to amplify longer DNA regions and can lead to artifacts such as allele drop-out (where markers fail to amplify) or allele drop-in (where random fragments amplify erroneously) [77].
Within the context of a broader thesis on CE principles, understanding and mitigating sample degradation is not merely a procedural step but a fundamental prerequisite for generating robust, interpretable, and scientifically valid data. This guide details the core mechanisms of DNA degradation, outlines strategic countermeasures for buffer condition management, and provides actionable protocols to empower researchers in overcoming these pervasive challenges.
Mechanisms and Drivers of DNA Degradation
DNA degradation is a multifactorial process initiated once an organism dies or cells are removed from their native environment, leading to the cessation of enzymatic repair mechanisms. The primary drivers can be categorized as follows [78]:
- Enzymatic Damage: Endogenous nucleases within the cell become activated and begin cleaving the DNA backbone. This is followed by exogenous enzymatic attack from microbes that colonize the sample, releasing their own nucleases that further fragment the genetic material [78].
- Chemical Degradation:
- Hydrolytic Damage: Water molecules react with the DNA, leading to depurination (loss of nitrogenous bases) and deamination of cytosine to uracil. This process is accelerated in aqueous environments [77] [78].
- Oxidative Damage: Free radicals and reactive oxygen species (ROS) cause base modifications, sugar alterations, and strand breaks [78].
- Environmental Stressors:
- UV Radiation: Exposure to UV light can induce the formation of cyclobutane pyrimidine dimers, which distort the DNA helix and block polymerase activity during amplification [77] [78].
- Temperature: Elevated temperature is a primary accelerator of degradation, increasing the rate of all destructive chemical reactions. A 10°C rise can double or triple the rate of DNA decay [78].
- Humidity and pH: Moisture is a key reactant in hydrolysis, and highly acidic or alkaline conditions catalyze chemical degradation [78].
The most visible outcome of these processes is fragmentation, where long DNA strands are cleaved into shorter pieces. This directly limits the maximum amplicon length achievable in polymerase chain reaction (PCR), a critical step preceding CE. Consequently, longer Short Tandem Repeat (STR) loci or other larger targets may fail to amplify, resulting in partial profiles and loss of informational power [77] [78].
Environmental Factors Affecting DNA Preservation
The following table summarizes the impact of key environmental factors on DNA integrity, which must be considered during sample collection and storage [78].
Table 1: Environmental Factors Influencing DNA Degradation
| Factor | Mechanism of Action | Impact on DNA Integrity |
|---|---|---|
| Temperature | Increases kinetic energy, accelerating hydrolytic/oxidative reactions and microbial growth. | Most influential factor. Constant cold (e.g., permafrost) dramatically improves preservation; high heat accelerates degradation. |
| Humidity/Moisture | Acts as a reactant for hydrolysis and enables microbial activity. | High water activity is extremely detrimental. Rapid dehydration (desiccation) aids preservation. |
| Ultraviolet (UV) Light | Induces formation of cyclobutane pyrimidine dimers between adjacent pyrimidine bases. | Causes helix distortion, blocks polymerases, and leads to strand breaks. |
| pH Level | Catalyzes chemical degradation; extreme pH denatures DNA. | Neutral to slightly alkaline pH is most favorable; highly acidic or alkaline conditions are destructive. |
| Microbial Activity | Microbes release nucleases and other enzymes that fragment DNA. | A major cause of enzymatic degradation in samples exposed to the environment. |
| Chemical Agents | Can cause cross-linking (e.g., formalin) or direct chemical damage. | Formalin fixation induces protein-DNA crosslinks and fragmentation, severely challenging analysis. |
Strategic Mitigation: From Sample Collection to Analysis
A multi-layered strategy is essential to mitigate degradation, encompassing pre-analytical sample handling, optimized laboratory techniques, and tailored analytical choices.
Optimized DNA Extraction and Quantification
The first laboratory hurdle is efficiently extracting usable DNA from compromised samples. Traditional methods often fall short, but advanced techniques have proven more effective [77].
- Magnetic Bead and Silica-Based Technologies: Kits utilizing these principles have been fine-tuned for degraded samples. They selectively bind DNA molecules, improving recovery rates even from heavily damaged specimens and helping to remove PCR inhibitors that co-purify with nucleic acids [77] [78].
- Specialized Extraction for Challenging Samples: For skeletal remains, protocols must account for the complex bone matrix and potential inhibitors. Similarly, archived formalin-fixed tissues require specialized methods to address protein-DNA crosslinking [78].
Following extraction, accurate DNA quantification is non-negotiable. It is crucial for determining the amount of input DNA for subsequent PCR amplification, ensuring optimal performance and avoiding the analysis of samples with insufficient template, which can produce unreliable results [77].
PCR Amplification of Compromised Templates
Severely damaged DNA may not amplify properly due to fragmentation, nicks, gaps, and chemical modifications that disrupt DNA polymerase activity [77]. Several strategies can improve amplification success:
- Specialized DNA Polymerases: Using polymerases that are more robust and tolerant of damaged DNA can enhance amplification efficiency from compromised templates [77].
- Mini-STRs: A primary solution involves using mini-STRs. These are compact versions of traditional STR loci, designed with primers that bind closer to the repeat region, resulting in smaller amplicon sizes [77]. Their shorter length makes them much more likely to amplify successfully from degraded DNA samples where longer fragments have been lost. The inclusion of mini-STRs in modern commercial STR kits has significantly improved the recovery of genetic information from degraded forensic samples [77] [78].
- Reduced Cycle Number Post-PCR Clean-up: Simply increasing PCR cycle numbers to boost signal from low-template DNA can exacerbate artifacts like stutter and allelic drop-in. An alternative strategy is to use a standard cycle count (e.g., 29 cycles) followed by a post-PCR clean-up step. The Amplicon Rx Post-PCR Clean-up Kit purifies the PCR product, removing contaminants and allowing for the concentration of amplicons. This has been shown to significantly enhance allele recovery and signal intensity in capillary electrophoresis without increasing PCR-induced artifacts, making it particularly valuable for trace and degraded DNA [79].
Advanced Genetic Markers and Sequencing
When conventional STR typing fails, alternative markers can be employed.
- Single-Nucleotide Polymorphisms (SNPs): SNPs are valuable alternatives to STRs in highly degraded samples. Their biallelic nature is less informative per locus than STRs, but they can be packaged into very short amplicons (typically under 150 base pairs). This minimal length requirement makes them more amenable to amplification from fragmented templates. Identity-informative SNPs (iiSNPs) can provide substantial discriminatory power [78].
- Next-Generation Sequencing (NGS): Also known as Massive Parallel Sequencing (MPS), NGS technologies have enhanced the capacity to analyze degraded DNA. They enable high-resolution profiling of multiple SNP markers simultaneously, even from compromised samples, and can provide sequence data beyond mere length polymorphisms [78].
The following workflow diagram integrates these strategic mitigation steps into a coherent experimental process.
Experimental Protocols for Degraded DNA Analysis
Protocol: Post-PCR Clean-up for Enhanced CE Signal
This protocol is adapted from a 2025 study evaluating the Amplicon RX kit for trace DNA analysis [79].
Objective: To purify and concentrate PCR products from degraded or low-template DNA samples, thereby enhancing allele recovery and signal intensity in subsequent Capillary Electrophoresis without increasing PCR cycle numbers.
Materials:
- Amplified PCR product (e.g., from GlobalFiler PCR Amplification Kit).
- Amplicon RX Post-PCR Clean-up Kit (Independent Forensics).
- Microcentrifuge tubes.
- Magnetic stand for microcentrifuge tubes.
- Ethanol (80-100%, molecular grade).
- Elution buffer (e.g., TE buffer or the kit's proprietary elution solution).
Methodology:
- Transfer: Transfer the entire 25 µL PCR reaction volume to a clean microcentrifuge tube.
- Binding Buffer: Add 50 µL of Amplicon RX Binding Buffer to the PCR product. Mix thoroughly by pipetting up and down.
- Incubation: Incubate the mixture at room temperature for 5 minutes to allow DNA to bind to the magnetic particles in the buffer.
- Magnetic Separation: Place the tube on a magnetic stand until the solution clears (approximately 2 minutes). Carefully aspirate and discard the supernatant without disturbing the pellet.
- Wash: While the tube is still on the magnetic stand, add 200 µL of freshly prepared 80% ethanol. Incubate at room temperature for 30 seconds, then carefully remove and discard the ethanol wash. Repeat this wash step a second time.
- Dry: Air-dry the pellet on the magnetic stand for 5-10 minutes to ensure all residual ethanol has evaporated. Do not over-dry.
- Elution: Remove the tube from the magnetic stand. Add 10-15 µL of Elution Buffer to the pellet. Mix thoroughly by pipetting to resuspend the purified DNA.
- Final Separation: Place the tube back on the magnetic stand for 1 minute. Transfer the purified eluate (containing the concentrated DNA) to a new microcentrifuge tube.
- Capillary Electrophoresis: Use 1-10 µL of the purified eluate for CE analysis per your laboratory's standard instrument protocol.
Expected Outcome: This clean-up process significantly enhances the signal intensity of dye-labeled amplicons by removing salts, enzymes, and unused primers that can inhibit electrokinetic injection. This leads to higher peak heights, improved allele calling, and a greater number of reportable alleles from challenging samples [79].
Quantitative Performance of Mitigation Techniques
The table below summarizes quantitative findings from recent studies comparing different methods for analyzing degraded and low-template DNA.
Table 2: Performance Comparison of Degradation Mitigation Methods
| Method / Technology | Key Performance Metric | Comparative Result | Application Context |
|---|---|---|---|
| Amplicon RX Clean-up (after 29-cycle PCR) | Allele Recovery | Significantly improved vs. standard 29-cycle (p = 8.30 × 10⁻¹²) and slightly better than standard 30-cycle (p = 0.019) [79]. | Trace DNA casework samples |
| Amplicon RX Clean-up (after 29-cycle PCR) | Signal Intensity | Significant increase (p = 2.70 × 10⁻⁴) compared to standard 30-cycle protocol [79]. | Trace DNA casework samples |
| Mini-STRs | Profile Completeness | Higher success rate for generating complete DNA profiles from highly fragmented samples compared to standard STRs [77]. | Highly degraded forensic samples |
| SNP Analysis via NGS | Genotyping Success | Successful profiling where conventional STR typing failed, due to shorter amplicon requirements (typically <150 bp) [78]. | Extremely degraded ancient or forensic DNA |
The Scientist's Toolkit: Essential Reagents and Materials
Table 3: Key Research Reagent Solutions for Degraded DNA Analysis
| Item | Function & Rationale |
|---|---|
| Magnetic Bead DNA Extraction Kits | Selective binding of DNA molecules for efficient recovery from complex, degraded samples while removing PCR inhibitors [77]. |
| STR Kits with Mini-STR Loci | Commercial PCR amplification kits that include primer sets for short amplicon STR loci, designed to maximize information recovery from fragmented DNA [77]. |
| Amplicon RX Post-PCR Clean-up Kit | Purifies and concentrates PCR products post-amplification, enhancing signal intensity for CE by removing inhibitory substances and allowing use of more amplicon [79]. |
| Single-Nucleotide Polymorphism (SNP) Panels | Panels of SNP markers with very short amplicon design (<150 bp), enabling genotyping from highly degraded samples where STRs fail [78]. |
| Next-Generation Sequencing (NGS) Kits | Specialized library preparation kits for degraded DNA that facilitate targeted enrichment and sequencing of short DNA fragments, providing maximum data recovery [78]. |
| Performance Optimized Polymer (POP-4) | A common polydimethylacrylamide-based sieving matrix used in CE for DNA fragment analysis, providing single-base resolution for fragments up to ~250 bases [6]. |
The successful application of capillary electrophoresis for DNA analysis is inextricably linked to the initial quality and integrity of the sample. While DNA degradation presents a formidable challenge, a comprehensive and strategic approach can significantly mitigate its effects. This involves understanding degradation mechanisms, implementing optimized protocols from sample collection through analysis, and leveraging advanced technologies like mini-STRs, post-PCR clean-up, and NGS-based SNP typing. By integrating these methods, researchers and drug development professionals can push the boundaries of what is possible, recovering reliable genetic data from even the most compromised samples and ensuring the robustness of their conclusions in capillary electrophoresis research.
High-Throughput Workflow Development for mRNA-Lipid Nanoparticle Characterization
The rapid advancement of messenger RNA (mRNA) therapeutics, particularly those delivered via lipid nanoparticles (LNPs), has created an urgent need for robust analytical characterization methods. This technical guide details the development of a comprehensive high-throughput (HT) workflow using capillary gel electrophoresis (CGE) to assess two critical quality attributes of mRNA-LNP formulations: structural integrity and poly(A) tail length. By systematically addressing challenges in sample preparation, instrumentation variability, and data processing, this workflow enables rapid, reproducible analysis suitable for both early development and quality control environments. The methodologies presented herein are framed within the established principles of capillary electrophoresis for nucleic acid analysis, providing researchers with implementable protocols to advance mRNA therapeutic development.
mRNA therapeutics have emerged as a promising treatment modality for a wide spectrum of conditions including cancer, infectious diseases, and genetic disorders [73]. These therapies leverage mRNA as vaccines, protein replacement therapies, and gene editing tools [80]. A key advancement enabling the clinical success of mRNA therapeutics has been their formulation within lipid nanoparticles (LNPs), which protect the fragile mRNA molecules from degradation and facilitate cellular uptake [80].
LNPs are complex delivery systems typically composed of ionizable cationic lipids (ICLs), helper lipids, cholesterol, and polyethylene glycol (PEG) lipids [80]. These components self-assemble into core–shell structures that encapsulate mRNA through electrostatic interactions [80]. Despite their protective function, LNPs present unique analytical challenges for quality assessment, particularly regarding the integrity of their nucleic acid payload.
The structural integrity of the mRNA molecule and its poly(A) tail length are two critical quality attributes (CQAs) that directly impact therapeutic efficacy [73]. Full-length transcripts are essential for optimal protein expression, while the poly(A) tail plays a crucial role in transcript stability and translational efficiency [73]. Traditional chromatographic methods for assessing these attributes, including ion-pair reversed-phase liquid chromatography (IP-RPLC) and size exclusion chromatography (SEC), often offer lower throughput and resolution compared to capillary-based approaches [73] [81].
Capillary gel electrophoresis (CGE), with its high resolution and ability to analyze up to 96 samples simultaneously, presents an ideal platform for HT characterization of mRNA therapeutics [73]. This guide details the development of a standardized HT CGE workflow, building upon fundamental capillary electrophoresis principles to address the specific challenges of mRNA-LNP characterization.
Principles of Capillary Electrophoresis for Nucleic Acid Analysis
Capillary electrophoresis (CE) is an analytical technique that separates ions based on their electrophoretic mobility under the influence of an applied electric field [1] [82]. For nucleic acid analysis, CE operates through two primary mechanisms: electrophoretic mobility and electroosmotic flow (EOF).
Fundamental Separation Mechanisms
Electrophoretic Mobility (μₑₚ) describes the movement of charged particles in an electric field and is governed by the equation: vₑₚ = μₑₚ × E, where vₑₚ is the velocity of the ion and E is the field strength [82]. The electrophoretic mobility itself depends on the analyte's charge (q) and the frictional drag (f) it experiences: μₑₚ = q / f [82]. For DNA and RNA, which have a consistent charge-to-mass ratio, separation by size requires a sieving matrix within the capillary.
Electroosmotic Flow (EOF) is the bulk movement of buffer solution through the capillary caused by the charged capillary walls [1] [82]. Fused-silica capillaries contain silanol groups that deprotonate at pH above approximately 3, creating a negatively charged surface that attracts positive counter-ions from the buffer [82]. When voltage is applied, these cations migrate toward the cathode, dragging the entire buffer solution with them [82].
Instrumentation Configuration
A CE system consists of five core components [1] [82]:
- Capillary: Fused-silica tubing (20–100 μm internal diameter, 30–60 cm length)
- Buffer Reservoirs: Contain running buffer to complete the electrical circuit
- High-Voltage Power Supply: Provides 10–30 kV to drive separation
- Injection System: Introduces nanoliter volumes via pressure or electrokinetic methods
- Detector: Typically UV absorbance or laser-induced fluorescence (LIF)
For HT applications, parallel-capillary array systems (e.g., 48-capillary arrays) significantly enhance throughput [73].
mRNA Integrity Analysis Workflow
Instrumentation and Variability Assessment
The foundation of a robust HT workflow begins with understanding instrument variability. Studies using the Agilent 5300 Fragment Analyzer System with a 48-capillary array have investigated two key sources of variation [73]:
- Capillary-to-capillary variability: Differences among the 47 sample capillaries within a single parallel array
- Repeatability of individual capillaries: Consistency of measurements from the same capillary across multiple runs
This evaluation is crucial for establishing reproducibility thresholds and identifying outliers within capillary arrays.
Sample Preparation Optimization
A critical step in mRNA-LNP characterization involves optimizing sample preparation conditions for both naked mRNA and LNP-encapsulated mRNA.
Table 1: Optimized Sample Preparation Conditions for mRNA Integrity Analysis
| Sample Type | Denaturation Condition | Surfactant Treatment | Key Findings |
|---|---|---|---|
| Naked mRNA | 70°C for 5 minutes [73] [40] | Not required | Ensures complete denaturation for accurate size separation |
| LNP-encapsulated mRNA | 70°C for 5 minutes [73] [40] | 2% Triton-X100 [73] [40] | Effectively disrupts LNP structure without damaging mRNA |
For LNP-encapsulated mRNA, surfactant screening identified Triton-X100 as the most effective disrupting agent, outperforming alternatives like NP-40, sodium lauryl sulfate (SLS), sodium deoxycholate, cetrimonium bromide (CTAB), and benzalkonium chloride [73].
Data Analysis Considerations
The quantitative performance assessment revealed that percentage of peak area provides a more reliable metric for mRNA integrity analysis than absolute peak area quantification, as it demonstrates superior reproducibility and is less affected by injection volume variability [73].
Workflow for mRNA Integrity Analysis. This diagram outlines the parallel sample preparation paths for naked mRNA and LNP-encapsulated mRNA prior to HT-CGE analysis.
Poly(A) Tail Length Analysis Workflow
Specialized Sample Processing
Determining the average poly(A) tail length requires specific enzymatic and purification steps before CGE analysis:
- RNase T1 Digestion: The RNA is treated with RNase T1, which cleaves specifically at guanosine residues, generating fragments that terminate at the poly(A) tail junction [73].
- Magnetic Bead Purification: The digested fragments are purified using Dynabeads Oligo(dT)25 magnetic beads, which selectively bind to poly(A) sequences [73].
- Elution and Analysis: The purified poly(A) tails are eluted and analyzed by CGE.
Size Calibration
A custom-designed size calibration ladder is essential for accurate poly(A) tail length determination [73]. This enables precise sizing of the poly(A) fragments separated by CGE.
High-Throughput Data Processing Pipeline
To complement the wet-lab protocols, a streamlined informatics workflow is essential for HT environments. The developed approach includes [73] [40]:
- Flexible Peak Integration: Customizable parameters to accommodate various mRNA species and impurity profiles
- Scalable Batch Analysis: Simultaneous processing of multiple electrophoretograms from a single plate
- Open-Source Compatibility: Potential for implementation using accessible computational tools
This semi-automated data processing pipeline significantly improves workflow efficiency and consistency while reducing manual intervention [73].
The Scientist's Toolkit: Essential Research Reagents
Table 2: Key Research Reagent Solutions for mRNA-LNP Characterization via CGE
| Reagent/Kit | Function/Application | Specific Usage Notes |
|---|---|---|
| HS RNA Kit (15NT) [73] | High-sensitivity RNA analysis by CGE | Provides sieving matrix and buffers for optimal separation |
| Triton-X100 [73] [40] | Surfactant for LNP disruption | Effective at 2% concentration for mRNA extraction from LNPs |
| RNase T1 [73] | Poly(A) tail analysis | Specifically cleaves at guanosine residues to generate poly(A) fragments |
| Dynabeads Oligo(dT)25 [73] | Poly(A) tail purification | Magnetic beads for selective isolation of polyadenylated fragments |
| Custom Size Calibration Ladder [73] | Poly(A) tail length determination | Essential for accurate sizing of poly(A) fragments |
Comparative Analysis of Separation Techniques
Table 3: Comparison of Analytical Techniques for mRNA Characterization
| Parameter | Capillary Gel Electrophoresis | Ion-Pair RPLC | Size Exclusion Chromatography |
|---|---|---|---|
| Separation Principle | Size-based separation via sieving matrix [73] | Hydrophobicity based on ion-pairing agents [73] [81] | Hydrodynamic size [73] [81] |
| Throughput | High (up to 96 samples parallel) [73] | Moderate [73] | Moderate [73] [81] |
| Resolution for Long RNA | High [73] | Lower [73] | Lower [73] |
| Sample Consumption | Low (nanoliters) [1] [82] | Moderate (microliters) | Moderate (microliters) |
| LNP Compatibility | Yes (with surfactant disruption) [73] [40] | Yes (with detergent disruption) [81] | Yes (with online deformulation) [81] |
Analytical Technique Selection Guide. This decision tree guides researchers in selecting the appropriate characterization method based on their specific throughput, resolution, and sample type requirements.
The HT CGE workflow detailed in this guide represents a significant advancement in mRNA therapeutic characterization. By systematically addressing sample preparation, instrumentation variability, and data processing challenges, researchers can now reliably assess both mRNA integrity and poly(A) tail length—two CQAs critical to therapeutic efficacy. The optimized protocols for both naked mRNA and LNP-encapsulated mRNA, coupled with semi-automated data analysis, provide a standardized approach that enhances reproducibility and throughput. As mRNA therapeutics continue to expand into new disease areas, robust analytical methods like this HT CGE workflow will play an increasingly vital role in ensuring product quality and accelerating development timelines.
Validation and Comparative Analysis: CE vs. LC and Other Electrophoretic Techniques
Within the broader principles of capillary electrophoresis (CE) for DNA analysis research, method validation stands as a critical pillar for ensuring data reliability and reproducibility. CE has become a cornerstone technique for DNA analysis due to its capabilities for high-throughput separation, minimal sample volume requirements, and excellent resolution [6]. The technique is widely applied across diverse fields, including forensic science, cancer genomics, infectious disease monitoring, and pharmacogenetics [67] [83] [22]. The validation parameters of reproducibility, sensitivity, and sizing accuracy form the fundamental triad that establishes confidence in CE methodologies. Reproducibility ensures that results remain consistent across different runs, instruments, and operators; sensitivity determines the lowest detectable amount of DNA or the ability to identify minor variants in a mixture; and sizing accuracy guarantees that DNA fragments are measured with precision to enable correct biological interpretations. This technical guide provides an in-depth examination of the experimental protocols and assessment criteria for validating these essential parameters in CE-based DNA analysis.
Core Principles of CE Separation and Detection
DNA Separation Mechanisms in CE
The separation of DNA fragments in capillary electrophoresis is primarily governed by three distinct mechanisms, each dominant under different experimental conditions. Understanding these mechanisms is crucial for selecting appropriate separation conditions for specific applications.
Free-Zone Capillary Electrophoresis: This mode operates without a sieving matrix and separates analytes based on their charge-to-size ratio. However, its utility for DNA separation is limited because most DNA fragments possess similar charge-to-size ratios, resulting in poor resolution of different fragment lengths [6].
Ogston Sieving: This mechanism dominates the separation of smaller DNA fragments (typically up to 500 base pairs). The gel matrix acts as a molecular sieve with porous networks. DNA molecules, behaving as incompressible spheres, migrate through these pores. Smaller fragments navigate the pores more easily and thus migrate faster than larger fragments. This regime produces a linear relationship between fragment size and migration time, making it ideal for DNA sequencing and fragment sizing [6].
Reptation: For DNA fragments larger than the pore size of the gel matrix, the Ogston model no longer applies. Instead, separation occurs via a mechanism called reptation, where the DNA molecule must deform, unfold, and "snake" through the gel pores. In this regime, the relationship between migration time and DNA fragment size becomes non-linear, and peak resolution is generally poorer, complicating accurate sizing [6].
Key Sieving Matrices and Their Properties
The choice of sieving matrix is a critical experimental variable that directly impacts separation performance, resolution, and viscosity. The table below summarizes the characteristics of prevalent matrices used in CE for DNA analysis.
Table 1: Characteristics of Prevalent DNA Sieving Matrices in Capillary Electrophoresis
| Matrix Type | Separation Performance | Viscosity | Coating Capability | Relative Cost | Primary Applications |
|---|---|---|---|---|---|
| Linear Polyacrylamide (LPA) | Single-base resolution for fragments <70 bp [6] | Very High (e.g., 27,000 cP for 2% LPA) [6] | Cannot coat capillary surface; requires separate surface modification [6] | Low | Microfluidic lab-on-a-chip platforms, analysis of PCR products, bacterial and viral detection [6] |
| Polydimethylacrylamide (POP-4) | Single-base resolution up to 250 bases; two-base resolution up to 350 bases [6] | Moderate | Can coat capillary surface; no separate coating required [6] | High (≈US$60/mL) [6] | Forensic STR analysis, DNA sequencing, genotyping of bacteria [6] [84] |
| Polydimethylacrylamide (POP-6) | Increased resolution compared to POP-4, suitable for fragments >500 bp [84] | Moderate (higher than POP-4) | Can coat capillary surface; no separate coating required [6] | High | Long-read sequencing, rapid forensic STR analysis with shorter arrays [84] |
| Hydroxyethylcellulose | Lower resolution compared to polymer matrices [6] | Low | Does not effectively suppress electroosmotic flow [6] | Low | Research applications where cost is a primary concern |
Experimental Protocols for Assessing Reproducibility
Protocol for Inter- and Intra-Run Reproducibility
Objective: To quantify the variation in DNA fragment migration times and sizing data within a single CE run (intra-run) and between multiple independent runs (inter-run).
Materials:
- CE instrument with laser-induced fluorescence (LIF) detection.
- DNA size standard with known fragment lengths (e.g., 80-500 bp).
- Validated sieving polymer (e.g., POP-4 or POP-6).
- Capillaries of specified length and diameter.
Method:
- Sample Preparation: Prepare a solution of the DNA size standard at a defined concentration. For inter-run assessment, aliquot and store the solution at -20°C for the duration of the experiment.
- Intra-Run Assessment: Inject the DNA standard onto a single capillary and run the separation under defined conditions (voltage, temperature, polymer lot). Repeat this injection and analysis process 10 times within the same sequence run.
- Inter-Run Assessment: Using the same aliquot of DNA standard, perform a single injection and analysis once per day over 10 consecutive days. Use the same instrument but different lots of polymer and capillaries as would occur in normal laboratory practice.
- Data Analysis: For each detected fragment in the standard, record the migration time (in minutes) and the calculated size (in bases) as reported by the instrument's software against the internal size standard.
- Statistical Calculation: For both intra-run and inter-run datasets, calculate the following for each fragment:
- Mean migration time and size.
- Standard Deviation (SD).
- Coefficient of Variation (CV %) = (SD / Mean) × 100.
Interpretation: A well-validated method will demonstrate low CV values. For example, a validated STR typing method using a 47 cm capillary reported standard deviations of less than 0.12 bases for fragments up to 317 bases, indicating high precision [85]. CVs for migration times and sizing should be established as acceptance criteria for the laboratory's standard operating procedures.
Experimental Protocols for Determining Sensitivity
Protocol for Establishing Limit of Detection (LOD)
Objective: To determine the minimum amount of input DNA that can be reliably detected and distinguished from background noise.
Materials:
- Serially diluted DNA standard of known concentration.
- CE instrument with LIF detection.
- Appropriate sieving matrix.
Method:
- Dilution Series: Prepare a serial dilution of the DNA standard, covering a range from a concentration expected to produce a strong signal down to one where no peaks are expected (e.g., from 100 pg/μL down to 5 pg/μL).
- CE Analysis: Inject and analyze each dilution in triplicate under standard separation conditions.
- Data Analysis: For each dilution, measure the peak height (in Relative Fluorescence Units, RFU) of a specific target fragment and the baseline noise in a region with no peaks.
- Analytical Threshold (AT) Calculation: Following the analysis of negative controls (no DNA), calculate the average noise and its standard deviation. The Analytical Threshold is often set at Average Noise + 3 × Standard Deviation [86]. Any peak with a height above this threshold is considered a true signal.
- LOD Determination: The LOD is the lowest concentration of DNA where all replicate injections produce detectable peaks for the target fragment, with peak heights significantly above the established AT and with a CV of less than 35% for the peak heights.
Advanced Sensitivity: Detecting Low-Frequency Mutations
Recent advancements have pushed the sensitivity boundaries of CE for detecting rare mutant alleles in a background of wild-type DNA. The HiDy-CE (High Dynamic Range Capillary Electrophoresis) method modifies the fluorescence acquisition system of a conventional CE sequencer to dramatically expand its dynamic range, preventing saturation of high-abundance wild-type peaks and enabling the detection of low-abundance mutant peaks [22].
Key Experimental Steps:
- Sample Preparation: Use a method like the multi-base primer extension (e.g., Shifted Termination Assay, STA) to generate labeled products from both mutant and wild-type alleles.
- CE Analysis with HiDy: Analyze the products on the HiDy-CE system, which uses a modified CCD sensor operation to raise the fluorescence saturation threshold.
- Variant Allele Frequency (VAF) Calculation: Precisely calculate the VAF from the ratio of mutant to wild-type peak signal intensities. The HiDy-CE system has demonstrated the capability to detect KRAS hotspot mutations (e.g., G12D, G12R) at VAFs as low as 0.5% using control DNA, and down to 1% in patient-derived specimens, a significant improvement over conventional CE [22].
Table 2: Sensitivity and Resolution Performance of CE Methods
| Method / Parameter | Sensitivity (LOD) | Resolution | Key Applications |
|---|---|---|---|
| Standard CE-LIF | Not explicitly stated in results, but can detect minor components in mixtures at ≥5% [85] | Single-base resolution up to 250 bases [6]; SD <0.12 bases for fragments up to 317 bases [85] | Forensic STR typing, pathogen genotyping [83] [85] |
| HiDy-CE | Detects mutant alleles at VAF of 0.5% [22] | Sufficient for identifying single-base changes in oncogenes | Detection of low-frequency cancer driver mutations (e.g., in KRAS) [22] |
| CE with Fluorescent Labeling | More sensitive than 32P-PAGE, avoids radioactivity [67] | Single-base resolution for DNA fragment sizing | Mapping DNA damage and reactive metabolite binding sites [67] |
Experimental Protocols for Evaluating Sizing Accuracy
Protocol for Absolute Sizing Accuracy Using Primary Standards
Objective: To achieve absolute sizing accuracy for DNA fragments, correcting for mobility shifts caused by differences in sequence composition and fluorescent labels.
Background: Using commercial size standards that differ in sequence and label from the sample fragments can lead to sizing errors of up to six bases [67]. The following protocol overcomes this limitation.
Materials:
- Commercial fluorescent size standard (e.g., WellRedD1-labeled).
- Sample fragments of interest (e.g., cleavage products from a DNA damage assay), labeled with fluorophore A (e.g., WellRedD4).
- "Primary standards": Synthesized DNA fragments with identical sequences and the same fluorophore (Fluorophore A) as the sample fragments.
Method:
- Separate Runs with Commercial Standard: In a CE array instrument, run the sample fragments mixed with the commercial standard (Fluorophore B) in one capillary. In a separate capillary, run the primary standards mixed with the commercial standard.
- Data Collection: For both runs, record the migration times for all fragments (samples, primary standards, and commercial standards).
- Standard Curve Construction: Using the data from the primary standards run, plot the known sizes of the primary standards against their migration times to create a standard curve. Since the primary standards and sample fragments have identical labels and sequences, this curve accurately reflects the mobility of the sample fragments.
- Size Correction: Use this standard curve to assign accurate sizes to the sample fragments based on their migration times, correcting for the mobility bias present when using only the commercial standard.
This method has been successfully applied to identify precise reaction sites of metabolites like styrene oxide on oligonucleotides, providing a safer and faster alternative to radioactive methods with high accuracy [67] [87].
Key Parameters Influencing Sizing Precision
Several instrumental and experimental parameters must be controlled to ensure high sizing precision:
- Internal Size Standard: An internal fluorescent size standard is run with each sample to normalize for minor mobility differences between injections [85].
- Capillary Length: Shorter arrays (e.g., 22 cm) can be used for faster analysis, but this may compromise resolution. This can be offset by using a more viscous polymer (e.g., POP-6) [84].
- Voltage and Temperature: Consistent run voltage and temperature are critical for reproducible migration times. Decreasing voltage can improve sizing quality at the cost of longer run times [84].
The Scientist's Toolkit: Essential Research Reagents and Materials
Table 3: Key Research Reagent Solutions for CE-based DNA Analysis
| Reagent / Material | Function | Example Products / Components |
|---|---|---|
| Sieving Polymers | Acts as a molecular sieve to separate DNA fragments by size during electrophoresis. | Linear Polyacrylamide (LPA), POP-4, POP-6, POP-7, Hydroxyethylcellulose [6] [84] |
| Fluorescent Dyes | Tags primers or nucleotides for sensitive laser-induced fluorescence (LIF) detection. | WellRed D1-D4, 6-FAM, VIC, NED, PET [67] [83] |
| DNA Size Standards | Calibrates the CE system for accurate fragment sizing. Includes internal standards (run with each sample) and allelic ladders (for STR typing). | DNA Standard Kit size 80, Internal Lane Standard 600 (ILS600), allelic ladders for STR loci [67] [85] [86] |
| Capillaries | The medium through which separation occurs. Surface coatings are often applied to suppress electroosmotic flow. | Fused silica capillaries with covalently bound coatings (e.g., polyimide) [6] |
| Primary Standards | Custom-synthesized fragments with identical sequence and label as samples; used for absolute sizing accuracy. | Synthesized oligonucleotides representing specific target fragments [67] [87] |
| Enzymes for Sample Prep | Used in multi-step assays to generate fragments for CE analysis (e.g., cleavage at damage sites). | Piperidine (for cleavage at abasic sites), restriction enzymes, polymerases [67] |
Workflow and Data Interpretation
The following diagram summarizes the core workflow for validating a CE method, integrating the assessment of reproducibility, sensitivity, and sizing accuracy.
Diagram 1: A comprehensive workflow for the validation of capillary electrophoresis methods for DNA analysis, covering core performance parameters.
Critical Considerations for Data Interpretation
- Stutter Artifact Filtering: In STR analysis, stutter peaks (smaller peaks adjacent to true alleles) are common. Use allele-specific stutter filters rather than traditional marker-wide filters for more accurate identification, which reduces analyst intervention and improves discrimination in mixtures [86].
- Contamination Database: Maintain a comprehensive DNA database of all laboratory personnel and regular visitors. Integrate this with analysis software for automated checking to quickly identify potential contamination events [86].
- Control Concordance: Include positive controls (e.g., extraction and amplification positives with known profiles) and negative controls (no DNA, reagent blanks) in every run. Negative controls are crucial for identifying contamination, while positive controls verify process functionality [86].
- Audit Trails: Ensure all analytical software maintains a comprehensive audit trail that records original data, all applied parameters, every edit made, the user responsible, and the rationale for manual interventions. This is crucial for data integrity and reconstructing analyses [86].
The rigorous validation of reproducibility, sensitivity, and sizing accuracy is fundamental to generating reliable and meaningful data from capillary electrophoresis DNA analysis. The experimental protocols and considerations outlined in this guide provide a framework for researchers and drug development professionals to establish robust, fit-for-purpose CE methods. As demonstrated by advancements like HiDy-CE, the evolution of CE technology continues to push the boundaries of sensitivity, enabling applications such as the detection of low-frequency cancer mutations that were previously challenging. By adhering to systematic validation principles—employing appropriate sieving matrices, utilizing primary standards for absolute sizing, implementing stringent sensitivity thresholds, and incorporating comprehensive quality controls—scientists can ensure their CE methodologies yield precise, accurate, and reproducible results that uphold the highest standards of scientific research.
Electrophoresis is a foundational technique in molecular biology, biochemistry, and clinical diagnostics that separates charged molecules like DNA, RNA, and proteins under the influence of an electric field. The separation relies on differential migration through a conductive medium, allowing researchers to analyze molecules based on size, charge, and shape. For decades, slab gel electrophoresis served as the standard method across research laboratories worldwide. However, the evolution of analytical science has introduced capillary electrophoresis (CE), a technically advanced platform that addresses multiple limitations inherent to traditional gel-based systems. This whitepaper provides a detailed technical comparison of these two methodologies, specifically framed within the context of modern DNA analysis research. We demonstrate how capillary electrophoresis delivers superior performance in three critical dimensions: operational speed, process automation, and analytical resolution, thereby enabling enhanced experimental outcomes for researchers, scientists, and drug development professionals.
The transition from slab gel to capillary systems represents a significant paradigm shift in analytical chemistry. While slab gel electrophoresis separates molecules in a porous gel matrix cast as a horizontal or vertical slab, capillary electrophoresis performs separations within a narrow-bore, fused-silica capillary filled with an electrolyte or polymer matrix. This fundamental difference in separation environment creates a cascade of technical advantages. The miniaturization of the separation path, combined with efficient heat dissipation, allows CE to employ very high electric field strengths, which directly translates to faster analysis times and higher resolution. Furthermore, the format of CE is inherently more compatible with full automation, from sample injection to data detection, reducing manual labor and increasing reproducibility. For research adhering to the rigorous principles of capillary electrophoresis, these advantages are not merely convenient—they are transformative, enabling higher throughput, more precise quantitative data, and access to applications like single-nucleotide discrimination that are challenging for slab gel systems.
Fundamental Principles and Comparative Mechanics
Operational Principles of Slab Gel Electrophoresis
Slab gel electrophoresis (SGE) is a separation technique that utilizes a porous gel matrix, typically composed of agarose or polyacrylamide, as a molecular sieve. The process begins with the casting of a gel slab with wells at one end. Samples are loaded manually into these wells, and an electric field (typically 4–10 V cm⁻¹) is applied across the gel. Negatively charged molecules, such as DNA, migrate toward the positive anode. The gel matrix impedes the progress of larger molecules more than smaller ones, resulting in separation primarily by molecular size. Post-separation, the DNA fragments are made visible through staining with fluorescent intercalators like SYBR Safe or ethidium bromide, and the resulting band patterns are photographed for analysis. This method is robust and cost-effective for basic qualitative analysis, such as verifying PCR amplicons or assessing DNA integrity. However, its reliance on manual steps, including gel casting, sample loading, staining, and destaining, introduces significant variability and limits throughput [88] [19].
Operational Principles of Capillary Electrophoresis
Capillary electrophoresis (CE) represents a technological evolution by miniaturizing the separation path into a narrow-bore fused-silica capillary, typically 25-75 µm in inner diameter and up to about 100 cm in length. The capillary is filled with an electrolyte or a replaceable polymer sieving matrix. A high-voltage power supply applies a powerful electric field (300-600 V cm⁻¹) across the capillary. The sample is introduced in nanoliter volumes via electrokinetic or hydrodynamic injection. Separation is driven by a combination of the molecules' electrophoretic mobility and the electroosmotic flow (EOF) of the buffer solution. A critical advantage of the capillary format is its high surface-to-volume ratio, which allows for efficient dissipation of Joule heat generated during the run. This enables the use of high field strengths without causing the matrix to overheat or degrade. Detection occurs in real-time through an on-line detector (e.g., UV absorbance or laser-induced fluorescence) positioned near the capillary outlet, which generates a digital electropherogram [88] [68].
Comparative Workflow Visualization
The following diagram illustrates the fundamental operational differences between the two techniques, highlighting the streamlined nature of the CE workflow.
Direct Performance Comparison: Speed, Automation, and Resolution
The fundamental differences in the design and operating principles of slab gel and capillary electrophoresis translate into direct and measurable performance advantages for CE in key operational categories. The following tables provide a detailed, data-driven comparison.
Table 1: Comprehensive Technical Comparison of Gel vs. Capillary Electrophoresis
| Feature | Slab Gel Electrophoresis (SGE) | Capillary Electrophoresis (CE) |
|---|---|---|
| Separation Medium | Hydrated agarose or polyacrylamide slab [88] | Fused-silica capillary with buffer/replaceable polymer [88] |
| Typical Field Strength | 4–10 V cm⁻¹ [88] | 300-600 V cm⁻¹ [88] |
| Typical Run Time | Tens of minutes to hours [19] | Minutes (e.g., <5 min for fragment sizing; 20-40 min for sequencing) [88] [19] |
| Sample Volume | Microliters (µL) [19] | Nanoliters (nL) [19] [68] |
| Detection Method | End-point, post-staining; visual/UV imaging [88] [19] | Real-time, on-line UV or Laser-Induced Fluorescence (LIF) [88] [19] |
| Data Output | Banding patterns on a gel image (semi-quantitative) [19] | Digital electropherogram with quantitative peaks [19] [68] |
| Theoretical Plates (Efficiency) | Lower resolution; band broadening [19] | High efficiency; up to 10⁶ theoretical plates [88] |
| Resolution Capability | Good for routine sizing; single-base resolution is challenging [68] | High resolution; single-nucleotide differences resolvable [88] [68] |
| Automation Level | Largely manual; labor-intensive [19] [68] | Fully automated from injection to detection [19] [68] |
Table 2: Advantages and Disadvantages Analysis
| Aspect | Slab Gel Electrophoresis | Capillary Electrophoresis |
|---|---|---|
| Key Advantages | • Low equipment and consumable cost [19]• Dozens of samples run in parallel on one slab [19] [68]• Bands can be excised for downstream cloning or MS analysis [88] [19] | • High speed due to high field strength [88] [68]• Exceptional resolution and quantitative data [19] [68]• Minimal sample and reagent consumption [19] [68]• Full automation reduces hands-on time and variability [19] [68] |
| Key Disadvantages | • Long run times and manual steps add labor and variability [19]• Semi-quantitative data [19]• Limited resolution for small size differences [19] [68] | • High capital instrument cost [19] [68]• Capillaries can clog and require maintenance [68]• Primarily analytical; preparative use is uncommon [88] |
Analysis of Speed and Throughput
The operational speed of capillary electrophoresis is vastly superior to that of slab gel systems. The core driver of this speed advantage is the high electric field strength (300-600 V cm⁻¹) that CE instruments can employ. In contrast, the thicker cross-section of a slab gel limits heat dissipation, restricting field strength to a much lower 4–10 V cm⁻¹ to prevent overheating and gel distortion [88]. This order-of-magnitude difference in field strength directly reduces analysis times from hours to minutes. For instance, routine DNA fragment sizing can be completed in under five minutes via CE, while single-base sequencing separations typically require 20-40 minutes [88] [19]. Furthermore, the automated nature of CE eliminates time-consuming manual steps such as gel casting, staining, and destaining, which are integral to the SGE workflow. When factoring in all preparatory and analytical steps, CE can improve overall laboratory throughput by a factor of ten or more.
Analysis of Automation and Quantitative Data Integrity
Capillary electrophoresis systems are designed for full automation, a critical feature for high-throughput research and diagnostic environments. Modern CE instruments incorporate autosamplers that manage capillary rinsing, buffer replacement, and sequential sample injections according to programmed sequences. This automation drastically reduces hands-on time and, more importantly, minimizes human error and operational variability, leading to superior reproducibility and data integrity [19] [68]. The data output itself is a fundamental differentiator: CE generates a digital electropherogram, which is a plot of signal intensity versus time. This format provides direct, quantitative data on peak height, area, and migration time, enabling precise quantification of sample components. In contrast, SGE produces band intensities on a gel image that must be interpreted visually or with densitometry software, a process that is at best semi-quantitative and subject to staining efficiency and imaging artifacts [19].
Analysis of Resolution and Separation Efficiency
The resolution of an electrophoretic system—its ability to distinguish between molecules of similar size—is quantifiably higher in capillary electrophoresis. The efficiency of a separation is often described in terms of theoretical plates, with CE routinely achieving efficiencies exceeding 10⁶ theoretical plates [88]. This high efficiency, a result of minimal band broadening within the narrow capillary, enables CE to resolve DNA fragments that differ by only a single nucleotide [88] [68]. This single-base resolution is the cornerstone of applications like Sanger sequencing and SNP genotyping. While slab gel electrophoresis, particularly polyacrylamide gel electrophoresis (PAGE), can provide good resolution for many applications, it cannot reliably achieve this level of discrimination. The higher resolution of CE also extends to protein analysis, where it can distinguish subtle isoforms that co-migrate in SDS-PAGE [68].
Experimental Protocols and Research Reagent Solutions
Detailed Protocol: DNA Fragment Analysis by Capillary Gel Electrophoresis
This protocol outlines the standard methodology for sizing and quantifying DNA fragments using a capillary electrophoresis system with a replaceable linear polymer matrix, as commonly applied in genetic analysis [6] [3].
- Capillary Preparation and Equilibration: Install a fused-silica capillary of the desired length (e.g., 50 cm) into the instrument cartridge. For DNA separation, the inner capillary wall is often coated to suppress electroosmotic flow (e.g., using a covalent coating or a dynamic coating with the polymer matrix itself) [6]. Flush the capillary thoroughly with the separation polymer matrix (e.g., linear polyacrylamide or performance-optimized polymer (POP-4)) to ensure a stable and bubble-free separation environment [6].
- Sample Preparation: Dilute the DNA sample (e.g., PCR product, restriction digest) in a compatible buffer, typically deionized water or a low-salt buffer. Incorporate an internal size standard labeled with a distinct fluorescent dye into each sample. The DNA fragments of interest must be labeled with a fluorophore, either via primer labeling during PCR or through post-amplification staining.
- Instrument Setup and Sample Injection: Program the instrument method. Key parameters include:
- Injection Parameters: Electrokinetic injection at 1-10 kV for 5-30 seconds. This draws a nanoliter-volume plug of the sample into the capillary.
- Separation Parameters: Apply a separation voltage of 5-15 kV (depending on capillary length) with reversed polarity (negative electrode at the injection side). The run temperature is typically set between 45°C and 60°C to maintain denaturing conditions.
- Separation and On-line Detection: Under the applied electric field, DNA fragments are separated by size via a mechanism of transient entanglement with the linear polymer matrix (Ogston sieving for smaller fragments, reptation for larger fragments) [6]. As separated fragments pass a window near the capillary outlet, a laser excites the fluorescent dyes. A charge-coupled device (CCD) camera detects the emitted light, converting it into an electrical signal.
- Data Analysis: The software generates an electropherogram plotting fluorescence intensity versus migration time. The internal size standard is used to create a calibration curve, converting migration times of unknown samples into precise base-pair sizes. Peak areas are used for quantitative analysis.
Detailed Protocol: DNA Fragment Analysis by Agarose Gel Electrophoresis
This protocol describes the conventional method for analyzing DNA fragments using a horizontal agarose gel system, typically used for qualitative assessment [88].
- Gel Casting: Prepare an agarose solution by dissolving electrophoresis-grade agarose powder in an appropriate buffer (e.g., 1x TBE or TAE) by heating. The percentage of agarose (e.g., 1-3% w/v) is selected based on the expected size of the DNA fragments to be resolved. Once the solution has cooled slightly, add a fluorescent intercalating dye such as SYBR Safe or ethidium bromide. Pour the solution into a casting tray with a well comb and allow it to polymerize completely.
- Gel Setup and Sample Loading: Place the solidified gel into an electrophoresis tank and submerge it in the same running buffer used to cast the gel. Gently remove the comb to create wells. Mix DNA samples with a loading dye (containing a dense compound like glycerol and tracking dyes). Carefully load the sample mixtures into the wells. Include a DNA molecular weight ladder in one well.
- Electrophoretic Run: Connect the tank to a power supply and apply a constant voltage (e.g., 5-10 V/cm of gel length). Run the gel until the tracking dyes have migrated a sufficient distance (typically 30 minutes to several hours, depending on the gel size and voltage).
- Post-Run Staining (if dye was not added previously): If the intercalating dye was not added during casting, the gel must be stained after the run by gently agitating it in a dye solution, followed by a destaining step in water to reduce background fluorescence.
- Visualization and Analysis: Place the gel on a UV transilluminator or a blue light illuminator. The UV/blue light excites the fluorescent dye bound to the DNA, causing it to emit light, which is captured by a camera. The size of unknown DNA fragments is estimated by comparing their migration distance to that of the bands in the molecular weight ladder.
The Scientist's Toolkit: Essential Reagent Solutions
Table 3: Key Reagents for Capillary Electrophoresis of DNA
| Reagent / Material | Function and Critical Role in the Experiment |
|---|---|
| Fused-Silica Capillary | The core separation channel. Its narrow diameter enables high field strength and efficient heat dissipation. Wall coatings are often applied to suppress electroosmotic flow and analyte adsorption [6] [88]. |
| Sieving Polymer Matrix (e.g., Linear Polyacrylamide, POP-4) | A replaceable polymer solution that acts as a dynamic sieving matrix for size-based separation of DNA fragments. Its viscosity and polymer chain length are critical for resolution and run pressure [6] [3]. |
| Electrophoresis Buffer (e.g., TBE with EDTA) | Provides the conductive medium for the electric field. Its pH and ionic strength are crucial for maintaining stable current and separation performance. EDTA chelates divalent cations that can degrade DNA [88]. |
| Fluorescently-Labeled Size Standard | A mixture of DNA fragments of known sizes, labeled with a specific fluorophore. It is co-injected with every sample to create a calibration curve for precise sizing of unknown fragments [3]. |
| Formamide (for denaturing CE) | Used to prepare samples for denaturing CE (e.g., sequencing). It keeps DNA strands denatured, preventing secondary structure that can interfere with separation based purely on length [3]. |
Applications and Implications for Research and Drug Development
The technical superiority of capillary electrophoresis has made it the gold standard for a wide range of high-precision applications in research and drug development. In the field of genomics and genetics, CE is the enabling technology behind automated Sanger sequencing, providing the high single-base resolution required for de novo sequencing, mutation detection, and confirmation of next-generation sequencing (NGS) results [3]. It is also the definitive method for short tandem repeat (STR) analysis, which is critical for human cell line authentication, forensic identification, and quality control of stored human tissues [3] [88]. Furthermore, CE is indispensable for microsatellite instability (MSI) analysis, a key biomarker in oncology, and for single-nucleotide polymorphism (SNP) genotyping, which is fundamental to genetic association studies [3].
In the pharmaceutical and biopharmaceutical industry, the quantitative and high-resolution nature of CE is leveraged for rigorous quality control. It is extensively used for the analysis of therapeutic proteins, including monitoring charge heterogeneity (capillary zone electrophoresis) and determining size variants (CE-SDS) with a precision that surpasses traditional SDS-PAGE [68]. The technique is also applied in the development and quality control of advanced therapeutics, such as viral vectors for gene therapy, where it helps ensure the integrity and identity of the genetic payload [3]. The move towards more agile manufacturing and real-time release testing in pharma places a premium on rapid, automated, and reliable analytical techniques like CE [88].
While slab gel electrophoresis retains its utility for low-cost, qualitative, and preparative applications—such as initial PCR product checks, educational demonstrations, and techniques requiring physical band excision—its role is increasingly focused on upstream, non-GxR activities. For core research and development, clinical diagnostics, and any application where data integrity, precision, and throughput are paramount, capillary electrophoresis has become the indispensable platform.
The comparative analysis presented in this whitepaper unequivocally demonstrates that capillary electrophoresis outperforms traditional slab gel electrophoresis across the critical dimensions of speed, automation, and resolution. The fundamental design of CE, which utilizes a miniaturized capillary format, allows for the application of high electric fields, leading to separations that are completed in minutes rather than hours. The inherent compatibility of this format with full automation streamlines workflows, drastically reduces manual labor, and enhances the reproducibility and reliability of analytical results. Most importantly, the superior separation efficiency and resolution of CE, capable of distinguishing single-nucleotide differences, have unlocked advanced applications in genetics, genomics, and biopharmaceutical quality control that are challenging or impossible to perform robustly with slab gel systems.
For the modern research scientist or drug development professional, the choice of electrophoresis platform has significant implications for project throughput, data quality, and regulatory compliance. While slab gel electrophoresis remains a valuable tool for specific, low-throughput qualitative tasks, capillary electrophoresis represents the technologically advanced solution for high-value, quantitative analysis. As the life sciences continue to evolve towards greater precision and higher throughput, the principles and capabilities of capillary electrophoresis will undoubtedly continue to be a cornerstone of analytical methodology for DNA analysis and beyond.
For researchers engaged in DNA analysis, selecting the appropriate separation technique is paramount to the success and accuracy of their work. The two dominant analytical tools—capillary electrophoresis (CE) and liquid chromatography (LC)—operate on fundamentally different principles, leading to distinct strengths and optimal application areas. CE separates molecules based on their charge-to-size ratio under the influence of an electric field, making it exceptionally powerful for charged species like DNA fragments [89] [6]. In contrast, LC separates compounds based on their differential partitioning between a mobile liquid phase and a stationary solid phase, making it a versatile workhorse for a wide range of molecules [90].
This technical guide provides an in-depth comparison of these two techniques, with a specific focus on their application within DNA analysis research. It aims to equip scientists and drug development professionals with the knowledge to make an informed selection based on their specific analytical requirements, sample limitations, and desired outcomes.
Fundamental Separation Mechanisms
How Capillary Electrophoresis Works
Capillary electrophoresis separates ions within a narrow-bore fused-silica capillary filled with a conductive electrolyte buffer. When a high-voltage electric field (typically 300-600 V/cm) is applied, charged molecules migrate towards the electrode of opposite charge at a velocity proportional to their electrophoretic mobility, which is a function of their charge and size [91] [89]. The electroosmotic flow (EOF) generated by the electric field moving the bulk solution provides a nearly uniform "plug-like" flow profile, which is a key factor in CE's high separation efficiency [89].
For DNA analysis, which typically uses size-based separation, a sieving matrix is added to the capillary. DNA fragments have a uniform negative charge; their separation relies on this matrix to retard larger fragments while allowing smaller ones to migrate faster. The primary mechanisms for this sieving are:
- Ogston Sieving: The DNA molecule behaves as an incompressible sphere that migrates through the pores of the gel matrix. Smaller fragments migrate faster, and the relationship between size and migration time is linear. This regime is typical for smaller DNA fragments [92] [6].
- Reptation: For DNA molecules too large to pass through the pores, they must deform and migrate head-first through the gel in a snake-like motion. Here, the size-migration relationship becomes non-linear, and resolution is generally lower [92] [6].
How Liquid Chromatography Works
Liquid chromatography separates compounds by pumping a liquid mobile phase at high pressure through a column packed with a solid stationary phase. Analytes are separated based on their differing interactions with the stationary phase. Those with stronger interactions are retained longer in the column than those with weaker interactions [90].
In the context of nucleic acid analysis, Reversed-Phase LC (RPLC) is commonly used, often with the aid of ion-pairing reagents. These reagents, such as triethylammonium acetate, coat the DNA, imparting a hydrophobic surface that can interact with the hydrophobic stationary phase (e.g., C18). Separation occurs based on the hydrophobicity, which correlates with the length and sequence of the oligonucleotide [93]. The mobile flow in LC is pressure-driven and parabolic, which is a key contributor to band broadening and lower theoretical plate counts compared to CE [89].
The diagram below illustrates the core operational principles and flow profiles of each technique.
Technical Comparison: CE vs. LC
The fundamental differences in mechanism lead to distinct performance characteristics, advantages, and limitations for each technique. The following table provides a direct quantitative and qualitative comparison.
Table 1: Technical Comparison of Capillary Electrophoresis and Liquid Chromatography
| Feature | Capillary Electrophoresis (CE) | Liquid Chromatography (LC) |
|---|---|---|
| Separation Mechanism | Electrophoretic mobility & electroosmotic flow [89] | Differential partitioning between mobile & stationary phases [90] |
| Driving Force | Electric field (High voltage) [89] | Pressure (High-pressure pump) [89] |
| Typical Theoretical Plates (N) | 100,000 to >1,000,000 [89] | 10,000 to 50,000 (for standard HPLC) [89] |
| Flow Profile | Uniform, "plug-like" [89] | Parabolic (laminar) [89] |
| Primary Application in DNA | Sizing, sequencing, STR analysis, aptamer characterization [4] [6] | Oligonucleotide purity, impurity profiling, analysis with mass spectrometry [93] |
| Sample Volume | Nanoliter or picoliter injections [91] [89] | Microliter injections [89] |
| Key Strength | Very high resolution for charged/sized-based separations; low sample/reagent consumption [89] [6] | Robustness, high loadability, excellent for hyphenation with MS, wide application scope [90] [89] |
| Key Limitation | Lower loadability (sample amount), sensitivity challenges for trace analysis [89] | Lower theoretical efficiency; high solvent consumption and cost [90] [89] |
Essential Research Reagent Solutions
The successful application of CE and LC in DNA research relies on a suite of specialized reagents and materials. The following table details key components and their functions.
Table 2: Essential Research Reagents and Materials for DNA Analysis
| Item | Function in DNA Analysis | Common Examples / Specifications |
|---|---|---|
| CE Capillary | Fused-silica tube providing the separation pathway; often coated to suppress electroosmotic flow. [91] [6] | Fused-silica, 25-75 μm inner diameter; coatings like polyimide for UV transparency. [91] |
| Sieving Matrix (CE) | Gel or polymer solution that acts as a molecular sieve for size-based separation of DNA fragments. [6] | Linear polyacrylamide (LPA), polydimethylacrylamide (POP-4), hydroxyethylcellulose. [6] |
| IP-RP HPLC Column | The stationary phase for separating oligonucleotides based on hydrophobicity, enabled by ion-pairing reagents. [93] | C18 or specialized phases (e.g., Evosphere C18/AR) with 100Å pore size; 1.7-5 μm particle size. [93] |
| Ion-Pairing Reagent (LC) | Imparts a hydrophobic coat to charged oligonucleotides, enabling retention on reversed-phase columns. [93] | Triethylammonium acetate (TEAA) or hexafluoro-2-propanol (HFIP). |
| Run Buffer / Mobile Phase | The conductive medium for CE or the eluting solvent for LC. | CE: Aqueous buffer (e.g., Tris-Borate-EDTA). LC: Gradient of water and organic solvent (e.g., acetonitrile) with ion-pairing agents. [93] [6] |
| Fluorescent Dyes (CE with LIF) | Tags DNA fragments for highly sensitive laser-induced fluorescence (LIF) detection. [91] | Intercalating dyes (SYBR Safe) or dye-labeled primers. |
Experimental Protocols for DNA Analysis
Protocol: DNA Fragment Sizing via Capillary Gel Electrophoresis
This protocol is foundational for applications like genotyping, mutation detection, and quality control of DNA samples [6].
- Capillary Preparation: Install a fused-silica capillary of desired length (e.g., 30-50 cm). For gel-facilitated sieving, coat the capillary wall or use a dynamic coating polymer to suppress electroosmotic flow. Fill the capillary with the chosen sieving matrix (e.g., linear polyacrylamide or a commercial polymer like POP-4) [6].
- Instrument Setup: Place inlet and outlet vials containing the electrolyte buffer. Configure the instrument for electrokinetic or hydrodynamic injection. Set the separation voltage (e.g., 15-30 kV) and temperature control (e.g., 25°C). The detector (typically UV or laser-induced fluorescence) is set at the appropriate wavelength [91] [6].
- Sample Preparation: Dilute DNA samples (e.g., PCR products) in a suitable buffer, often the same as the run buffer. For quantitative analysis with LIF, ensure samples are tagged with a fluorescent dye [91].
- Injection and Separation: Inject the sample plug (nanoliter volume) into the capillary. Apply the high voltage. Smaller DNA fragments will migrate faster through the polymer matrix, separating based on size in the Ogston sieving regime [92] [6].
- Data Analysis: The detector records peaks as fragments pass by. Compare migration times of unknown samples to a DNA ladder (size standard) run under identical conditions to determine fragment sizes [4].
Protocol: Oligonucleotide Purity Analysis via Ion-Pair Reversed-Phase LC
This protocol is critical in pharmaceutical development for assessing the quality of synthetic oligonucleotides, identifying failure sequences, and quantifying impurities [93].
- Column Equilibration: Install a suitable reversed-phase column (e.g., C18 with 100Å pores). Equilibrate the column with the starting mobile phase (e.g., 95% Mobile Phase A: 0.1 M TEAA in water, 5% Mobile Phase B: 0.1 M TEAA in acetonitrile) at the prescribed flow rate until a stable baseline is achieved [93].
- LC System Configuration: Use a UHPLC or HPLC system capable of delivering a binary gradient. Set the column oven temperature (e.g., 50-80°C for oligonucleotides). Configure the UV detector, typically at 260 nm [93].
- Sample Preparation: Dissolve the oligonucleotide sample in an appropriate solvent, typically water or a mild buffer.
- Gradient Elution and Separation: Inject the sample. Run a gradient method (e.g., from 5% B to 20% B over 15 minutes). The ion-pairing reagent (TEAA) masks the phosphate charge, allowing separation based on hydrophobicity, which correlates with oligonucleotide length and sequence. Shorter failure sequences elute first, followed by the full-length product, and then longer impurities [93].
- Data Analysis: Integrate the peaks in the chromatogram. The main peak is typically the full-length product, while earlier and later eluting peaks are truncated or elongated impurities, respectively. Report the percentage purity of the target oligonucleotide.
Application Scenarios and Selection Guide
The choice between CE and LC is not a matter of which is universally better, but which is more appropriate for the specific analytical question. The decision workflow below visualizes the key questions to guide this selection.
Capillary Electrophoresis is the preferred tool when:
- The application requires high-resolution sizing of DNA fragments, such as in STR analysis for forensics [4], sequencing [6], or checking PCR product size.
- The analytical question revolves around charge-based separation, such as analyzing protein charge variants or chiral separations using charged selectors [89].
- Sample volume is extremely limited, as in single-cell analysis or with precious clinical samples, due to its nanoliter injection volumes [89].
- The goal is to minimize solvent consumption and waste, as CE primarily uses aqueous buffers [89].
Liquid Chromatography is the preferred tool when:
- The analysis focuses on oligonucleotide purity and impurity profiling, where separation is based on hydrophobicity rather than size alone [93].
- Hyphenation with mass spectrometry (LC-MS) is required for definitive identification or characterization, as LC interfaces more robustly with MS systems [90] [89].
- Preparative-scale separation is needed to isolate and collect compounds for downstream use, due to its higher loadability [89].
- The laboratory's workflow involves a broad range of small-molecule analyses (e.g., pharmaceutical impurities, environmental pollutants) beyond nucleic acids, where LC's robustness and versatility are advantageous [90] [89].
In the field of DNA analysis, both capillary electrophoresis and liquid chromatography offer powerful but distinct capabilities. CE provides unparalleled resolution for size- and charge-based separations with minimal sample consumption, making it the gold standard for DNA sequencing, fragment analysis, and forensic applications. LC, particularly ion-pair reversed-phase modes, offers robust solutions for oligonucleotide quality control and is the superior platform for coupling with mass spectrometry.
The most effective research laboratories do not view these techniques as rivals but as complementary tools in an analytical arsenal. The choice should be strategically driven by the specific analytical requirements. By understanding the principles, performance characteristics, and optimal applications outlined in this guide, scientists and drug development professionals can confidently select the right tool to advance their research.
The Role of CE in Quality Control and Regulatory Support for mRNA Therapeutics
The rapid advancement of messenger RNA (mRNA) therapeutics, underscored by the successful deployment of COVID-19 vaccines, has necessitated equally advanced analytical techniques for quality control (QC) and regulatory support. Capillary Electrophoresis (CE) has emerged as a cornerstone technology in this landscape, providing the high-resolution separation power essential for characterizing complex mRNA-based products. CE's principle of separating analytes based on their charge-to-mass ratio using narrow-bore capillaries and high voltage achieves ultra-high separation efficiencies that often exceed those of traditional chromatographic methods [82]. This technical capability, framed within the established principles of electrophoretic DNA analysis, positions CE as an indispensable tool for ensuring the safety, efficacy, and consistency of mRNA therapeutics throughout their development and manufacturing lifecycle.
The global mRNA quality monitoring market, a key indicator of analytical technology adoption, is projected to grow from US$1.37 billion in 2025 to US$2.5 billion by 2034, reflecting the critical need for robust characterization methods [94]. Within this market, electrophoresis technologies constitute the largest technology segment, holding approximately 38% share as of 2024, which underscores CE's dominant role in mRNA analysis [94]. This widespread adoption is driven by CE's ability to address unique challenges in mRNA therapeutic development, from ensuring sequence integrity to detecting critical impurities that can impact product safety and performance.
Fundamental Principles of Capillary Electrophoresis and Technical Evolution
Capillary Electrophoresis operates through the interplay of two primary mechanisms: electrophoretic mobility and electroosmotic flow (EOF). Understanding these forces is fundamental to optimizing CE for mRNA analysis.
Electrophoretic Mobility (μₑₚ) describes the movement of charged particles in an electric field. The velocity of an ion (vₑₚ) is proportional to the field strength (E) and the ion's electrophoretic mobility (μₑₚ), expressed as vₑₚ = μₑₚ × E [82]. This mobility is determined by the analyte's charge (q) and the frictional drag (f) it experiences in the buffer (μₑₚ = q / f). For mRNA, which is highly negatively charged, this relationship allows for excellent separation based on size.
Electroosmotic Flow (EOF) is the bulk movement of buffer solution through the capillary. In standard fused-silica capillaries, the inner wall contains silanol groups that deprotonate at pH values above approximately 3, creating negatively charged surfaces that attract positive counter-ions from the buffer, forming an electrical double layer [82]. When voltage is applied, these cations migrate toward the cathode, dragging the entire buffer solution with them. The net velocity of an mRNA molecule (vₙₑₜ) is thus the vector sum of its electrophoretic velocity and the electroosmotic flow velocity: vₙₑₜ = vₑₚ + vₑₒf [82].
The evolution from conventional gel electrophoresis to CE represents a significant analytical advancement. While native agarose gel electrophoresis is tedious, time-consuming, less accurate, and requires more starting sample volume, CE offers a fully automated, high-throughput alternative with nano-level separation capability [1]. This is particularly crucial for mRNA therapeutics, where conventional electrophoresis cannot resolve critical quality attributes such as single-base differences or small sequence variations that CE can precisely identify [1].
Table 1: Key Advantages of Capillary Electrophoresis for mRNA Analysis
| Advantage | Technical Specification | Impact on mRNA Therapeutic Development |
|---|---|---|
| High Resolution | Can separate even a single base pair precisely [1] | Enables detection of minor sequence variants and degradation products |
| Minimal Sample Consumption | Sample requirement as low as 1 nanoliter (nL) [1] | Critical for scarce samples during early development and high-value products |
| High Throughput | Availability of 96-capillary setups for parallel processing [1] | Supports quality control in commercial-scale manufacturing |
| Speed and Automation | Fully automated system from sample loading to data analysis [1] | Reduces human error and increases laboratory efficiency |
| Quantitative Precision | Fluorescence-based detection provides highly quantitative data [1] | Enables accurate determination of critical quality attributes (CQAs) |
Critical mRNA Quality Attributes Analyzed by CE
The characterization of mRNA therapeutics requires monitoring of several Critical Quality Attributes (CQAs) that directly impact product safety, efficacy, and stability. CE provides analytical capabilities for assessing multiple CQAs simultaneously or through dedicated method configurations.
mRNA Integrity and Purity
mRNA integrity, referring to the proportion of full-length mRNA, is perhaps the most fundamental quality attribute. Degraded mRNA fragments can translate into truncated, non-functional, or immunogenic proteins. Capillary Gel Electrophoresis (CGE), a variant of CE, is widely employed to assess RNA lengths and size distribution with high resolution [95]. The technique can distinguish full-length mRNA from truncated species and other impurities, providing a purity assessment that is crucial for ensuring therapeutic efficacy. Leaked documents from the European Medicines Agency highlighted concerns over unexpectedly low quantities (>55%) of intact mRNA in commercial vaccine batches, underscoring the critical importance of rigorous integrity testing [95].
Detection of Double-Stranded RNA (dsRNA) Impurities
Double-stranded RNA (dsRNA) is a critical process-related impurity generated during in vitro transcription (IVT). dsRNA can act as a potent activator of the innate immune system, leading to unintended inflammatory responses and potentially inhibiting the translation of the therapeutic mRNA [95]. CE methods can separate and identify dsRNA impurities based on their differential migration compared to single-stranded mRNA, providing essential information for process optimization and quality control.
Poly(A) Tail Length Distribution
The poly(A) tail at the 3' end of mRNA plays a crucial role in stability and translation efficiency. Poly(A) tail length heterogeneity is a common phenomenon in IVT mRNA, and its distribution affects the therapeutic protein expression level. CE provides a high-resolution method for analyzing poly(A) tail length distribution, enabling manufacturers to ensure batch-to-batch consistency [95]. This analysis is particularly important given that longer poly(A) tails generally correlate with increased mRNA stability and translation potential [95].
Table 2: mRNA Critical Quality Attributes (CQAs) Accessible by CE Analysis
| Critical Quality Attribute | Impact on Therapeutic Performance | CE Analysis Method |
|---|---|---|
| mRNA Integrity/Purity | Ensures production of full-length functional proteins; degraded products reduce efficacy [95] | Capillary Gel Electrophoresis (CGE) |
| Double-Stranded RNA (dsRNA) | Trig innate immune responses; reduces translation efficiency [95] | CE with specific buffer conditions |
| Poly(A) Tail Length | Affects mRNA stability and translation efficiency [95] | High-resolution CE separation |
| Sequence Variants | May produce incorrect proteins with reduced activity or immunogenicity | CE-based sequencing |
| Lipid Nanoparticle Interactions | Impacts mRNA stability, encapsulation efficiency, and potency [96] | CE with specialized detection |
CE Instrumentation and Methodologies for mRNA Characterization
A comprehensive understanding of CE instrumentation and methodology is essential for implementing robust mRNA analytical strategies.
Core Instrumentation Components
A CE system consists of several core components optimized for nucleic acid analysis:
- Capillary: Fused-silica tubing (20–100 μm internal diameter, 30-60 cm long) ensures rapid heat dissipation, minimizing band broadening [1] [82]. The polyimide outer coating provides mechanical stability, while specific inner coatings can modify electroosmotic flow and reduce analyte adsorption.
- Buffer Reservoirs: Contain the running buffer that completes the electrical circuit. Buffer composition and pH critically influence separation efficiency by affecting both analyte charge and EOF [1].
- High-Voltage Power Supply: Provides 10–30 kV, driving both electrophoresis and EOF. Higher voltages accelerate separations but require careful thermal management to avoid Joule heating effects [82].
- Injection System: Introduces nanoliter volumes of sample either hydrodynamically (pressure) or electrokinetically (voltage) [82].
- Detection System: UV absorbance and fluorescence are common detection methods. Fluorescence detection, often using fluorochrome dyes, offers superior sensitivity for low-abundance mRNA species and impurities [1].
Capillary Gel Electrophoresis (CGE) for mRNA Integrity
CGE employs capillaries filled with a sieving matrix (such as linear polyacrylamide or other polymers) to separate mRNA molecules based on size. The technique offers significant advantages over traditional agarose gel electrophoresis, including automated operation, quantitative results, and elimination of gel preparation steps [95]. For mRNA integrity assessment, CGE provides a profile of the full-length product along with any truncated fragments, enabling calculation of the percentage of intact mRNA—a critical release specification for therapeutic products.
CE in mRNA-Lipid Nanoparticle Characterization
Lipid Nanoparticles (LNPs) are the primary delivery system for mRNA therapeutics. Recent research has revealed that mRNA encapsulated within LNPs is susceptible to chemical modifications by reactive lipid species, particularly peroxidated lipids that convert to reactive aldehydes [96]. These modifications can compromise mRNA activity without necessarily affecting integrity as measured by conventional methods. CE, particularly when coupled with mass spectrometry, plays a valuable role in detecting such modifications, highlighting its importance in comprehensive product characterization [96].
Diagram 1: CE Instrument Setup for mRNA Analysis
Experimental Protocols and Methodologies
Protocol for mRNA Integrity Analysis by Capillary Gel Electrophoresis
This protocol describes the standard procedure for assessing mRNA integrity using CGE, a critical quality control test for mRNA therapeutics.
Materials and Reagents:
- CE instrument with UV or fluorescence detection capability
- Fused-silica capillaries (50-75 μm internal diameter) with appropriate coating
- Gel sieving matrix (commercial formulations optimized for RNA analysis)
- Running buffer (typically Tris-borate-EDTA or similar)
- mRNA samples (purified or extracted from formulations)
- Fluorescent dye (if using fluorescence detection)
- Size standards for system qualification
Procedure:
- Capillary Conditioning: For new capillaries, flush with 1M NaOH for 10-20 minutes, followed by deionized water for 10 minutes, and finally with running buffer for 10 minutes [1].
- Matrix Loading: Fill the capillary with the gel sieving matrix according to manufacturer specifications, ensuring no bubbles are introduced.
- Sample Preparation: Dilute mRNA samples to an appropriate concentration (typically 10-100 ng/μL) in nuclease-free water or specified sample buffer. For fluorescence detection, add intercalating dye at the recommended concentration and incubate for 5-10 minutes in the dark.
- Instrument Parameters: Set the separation voltage according to capillary length (typically 5-15 kV), temperature (25-60°C), and injection parameters (pressure or electrokinetic injection for 5-30 seconds) [1] [82].
- Sample Injection and Separation: Inject the prepared samples and initiate separation. Monitor current stability throughout the run.
- Data Analysis: Integrate peaks corresponding to full-length mRNA and any impurity peaks (truncated forms, dsRNA). Calculate the percentage of full-length mRNA relative to total RNA species.
Troubleshooting Notes:
- Poor resolution may indicate degraded sieving matrix or incorrect capillary temperature.
- Fluctuating current suggests buffer depletion or capillary blockage.
- If using fluorescence detection, ensure dye is compatible with the capillary material and excitation source.
Advanced Protocol: Monitoring mRNA-Lipid Adducts by CE
This protocol addresses the emerging challenge of mRNA-lipid adducts in LNP formulations, which can cause unexpected potency loss independent of mRNA integrity [96].
Materials and Reagents:
- CE system with UV detection
- Ion-pairing reverse phase (IP-RP) capillaries or conditions
- Extraction reagents for mRNA recovery from LNPs (e.g., Triton X-100, formamide)
- Appropriate mobile phases for IP-RP separation
- Reference standards of unmodified mRNA
Procedure:
- mRNA Extraction from LNPs: Treat LNP formulations with appropriate extraction reagents (e.g., Triton X-100 or formamide) to release encapsulated mRNA while minimizing degradation [94].
- Sample Cleanup: Purify extracted mRNA using standard precipitation or column-based methods to remove lipid components.
- CE Analysis with IP-RP Conditions: Perform CE separation using ion-pairing conditions that enhance resolution of hydrophobic adducts. The method should be optimized to separate the main mRNA peak from later-eluting adduct peaks [96].
- Quantification: Calculate the relative percentage of late-eluting peaks, which correspond to lipid-adducted mRNA species. Correlate this percentage with in vitro potency measurements.
- Method Validation: Establish system suitability criteria including resolution between main peak and adduct peak, retention time reproducibility, and peak area precision.
Interpretation: An increase in late-eluting peaks indicates higher levels of mRNA-lipid adduction, which correlates with reduced translational efficiency and potency [96]. This method is particularly valuable for stability studies and for screening ionizable lipid lots with lower reactive impurity content.
Comparative Analytical Techniques and Regulatory Landscape
CE in the Context of Complementary Analytical Techniques
While CE provides exceptional capabilities for mRNA analysis, it functions within an ecosystem of complementary analytical techniques that together provide comprehensive product characterization.
Next-Generation Sequencing (NGS) offers unparalleled depth for sequence verification and can detect low-frequency sequence variants that might escape CE detection. NGS is increasingly used for assessing multiple CQAs simultaneously, including mRNA integrity, capping efficiency, and poly(A)-tail length heterogeneity [94]. However, CE maintains advantages in simplicity, speed, and cost for routine QC applications.
Liquid Chromatography-Mass Spectrometry (LC-MS) provides superior characterization of chemical modifications, including 5'-capping efficiency and nucleoside modifications. The integration of isotope-dilution mass spectrometry enables precise quantification, while specialized enzymatic digestion protocols allow analysis of larger mRNA fragments [94]. LC-MS requires more extensive sample preparation and sophisticated instrumentation compared to CE.
Lateral Flow Strip Assays (LFSAs) represent an emerging technology for rapid, on-site mRNA quality control, particularly in decentralized manufacturing scenarios. LFSAs can evaluate key attributes like 5' capping efficiency, integrity, and LNP encapsulation efficiency within 15 minutes, significantly faster than CE or LC-MS [97]. However, they typically offer less quantitative precision and are best suited for screening applications rather than definitive quality control.
Table 3: Comparative Analysis of mRNA QC Techniques
| Technique | Key Applications | Throughput | Sensitivity | Regulatory Standing |
|---|---|---|---|---|
| Capillary Electrophoresis | Integrity, size variants, dsRNA, poly(A) tail | High | Moderate-High | Well-established |
| Next-Generation Sequencing | Sequence fidelity, minor variants, multiple CQAs | Moderate | Very High | Emerging |
| LC-MS | Capping efficiency, modifications, impurities | Moderate | High | Increasing adoption |
| Lateral Flow Strip Assays | Rapid screening of capping, integrity | Very High | Moderate | Emerging |
Regulatory Considerations and Compliance
The regulatory landscape for mRNA therapeutics is rapidly evolving, with CE playing a central role in demonstrating product quality, consistency, and compliance. In the United States, recent updates include the third edition of draft guidelines on Analytical Procedures for Quality of mRNA Vaccines and Therapeutics, which provides comprehensive guidance across the product lifecycle [94].
Regulatory submissions for mRNA products typically require extensive characterization data, much of which can be generated using CE methods. This includes:
- Demonstration of product consistency across multiple manufacturing lots
- Stability data supporting proposed storage conditions and shelf life
- Validation of impurity clearance (dsRNA, truncated mRNA species)
- Comparability studies following manufacturing process changes
The platform nature of mRNA technology, where similar mRNA backbones and LNP technologies are utilized across different products, facilitates a regulatory approach where analytical methods including CE can be standardized and leveraged across multiple applications [98]. This platform approach can streamline regulatory review by establishing well-understood and reproducible technologies.
The Scientist's Toolkit: Essential Reagents and Materials
Successful implementation of CE methods for mRNA analysis requires specific reagents and materials optimized for nucleic acid characterization.
Table 4: Essential Research Reagent Solutions for mRNA CE Analysis
| Reagent/Material | Function | Technical Considerations |
|---|---|---|
| Fused-Silica Capillaries | Separation channel for mRNA molecules | 50-75 μm ID; various coatings available to modify EOF and reduce adsorption [1] |
| Gel Sieving Matrix | Size-based separation of mRNA fragments | Polymer solutions (e.g., linear polyacrylamide); commercial formulations ensure reproducibility [95] |
| Fluorescent Dyes | Detection of mRNA species | Intercalating dyes (e.g., ethidium homodimers); must be compatible with excitation source [1] |
| Ion-Pairing Reagents | Enabling separation of hydrophobic adducts | Agents like ion-pairing reverse phase reagents for detecting mRNA-lipid adducts [96] |
| Running Buffers | Maintaining pH and conductivity during separation | Typically Tris-borate-EDTA or similar; pH and ionic strength critically impact separation [82] |
| Capillary Regeneration Solutions | Maintaining capillary performance | NaOH for cleaning; water for rinsing; storage solutions for capillary preservation [1] |
Diagram 2: mRNA Quality Assessment Workflow Using CE
Capillary Electrophoresis has established itself as an indispensable analytical technique in the quality control and regulatory support of mRNA therapeutics. Its exceptional efficiency, minimal sample requirements, and high-resolution capabilities make it particularly well-suited for characterizing complex mRNA products throughout their development and manufacturing lifecycle. As the mRNA therapeutic field expands beyond vaccines to include oncology treatments, rare disease therapies, and gene editing applications, the role of CE will continue to evolve.
Future developments in CE technology will likely focus on increased automation, enhanced sensitivity through improved detection systems, and greater integration with complementary techniques like mass spectrometry. The trend toward miniaturization, exemplified by microchip electrophoresis systems, promises even faster analysis times and reduced reagent consumption [82]. Additionally, as regulatory expectations for mRNA therapeutics mature, standardized CE methodologies will play an increasingly important role in demonstrating product quality and consistency across this rapidly expanding class of medicines.
The continued innovation in both mRNA therapeutics and analytical technologies ensures that CE will remain at the forefront of quality control strategies, enabling the development of safe, effective, and reproducible mRNA-based medicines that address unmet medical needs across diverse therapeutic areas.
Capillary Electrophoresis (CE) has solidified its role as a powerful analytical separation technique in modern laboratories. Its principle, which separates ions based on their electrophoretic mobility under an electric field within a narrow capillary, provides exceptional resolution for complex biological samples [99]. As we move toward an era demanding higher sensitivity and specificity in molecular analysis, particularly in DNA research and clinical diagnostics, the integration of CE with Mass Spectrometry (MS) represents a critical technological evolution. This combination, denoted as CE-MS, creates a powerful synergistic platform that merges the high-separation efficiency of CE with the exquisite detection and identification capabilities of MS [100]. This whitepaper examines the current state and future trajectories of CE-MS integration, with a specific focus on its burgeoning applications in novel clinical diagnostics, framed within the broader context of DNA analysis research.
Technological Integration: CE-MS Synergy
Core Principles and Technical Advantages
The coupling of CE and MS is a natural progression that addresses limitations inherent in each standalone technique. CE offers rapid analysis times, minimal sample volume requirements, and high separation efficiency based on analyte charge and size [99]. MS contributes precise molecular mass determination, structural elucidation, and high sensitivity. When combined, CE-MS enables the analysis of complex mixtures—such as those found in genomic digests, biomarker panels, and proteomic profiles—with unprecedented accuracy.
A key advantage of CE-MS in biomolecular analysis is its compatibility with electrospray ionization (ESI). ESI generates multiply charged ions, making it particularly suitable for the aqueous buffer systems used in CE and allowing for the analysis of large biomolecules like DNA fragments and proteins [100]. Furthermore, the technique is less susceptible to signal suppression compared to other ionization methods like MALDI, ensuring more reliable quantification across diverse analyte populations [100].
Quantitative Performance Metrics of CE-MS
The performance of integrated CE-MS systems can be quantified against traditional methods. The following table summarizes key comparative metrics.
Table 1: Performance Comparison of CE-MS with Other Analytical Techniques
| Performance Metric | CE-MS | Traditional CE | HPLC-MS |
|---|---|---|---|
| Analysis Time | Minutes to tens of minutes [99] | Similar to CE-MS | Typically longer than CE-MS |
| Sample Volume | Minimal (nanoliters) [99] | Similar to CE-MS | Microliters to milliliters |
| Separation Efficiency | Very High (100,000 - 500,000 theoretical plates) [99] | Similar to CE-MS | High (10,000 - 20,000 theoretical plates) |
| Mass Accuracy | High (< 30 ppm minimum requirement) [100] | Not Applicable | Similar to CE-MS |
| Ion Source Compatibility | Electrospray Ionization (ESI) [100] | Not Applicable | ESI, APCI, others |
Standardized Experimental Protocol for DNA Biomarker Analysis via CE-MS
To ensure reproducibility in research, the following protocol outlines a standard workflow for analyzing DNA methylation biomarkers, a key application in liquid biopsies.
Table 2: Detailed Protocol for CE-MS Analysis of DNA Methylation Biomarkers
| Step | Procedure | Technical Notes |
|---|---|---|
| 1. Sample Preparation | Extract cell-free DNA (cfDNA) from plasma or other liquid biopsy sources using a commercial kit. | Use plasma over serum, as it is enriched for circulating tumor DNA (ctDNA) and has less contamination from genomic DNA of lysed cells [101]. |
| 2. Bisulfite Conversion | Treat purified cfDNA with sodium bisulfite. | This step converts unmethylated cytosines to uracils, while methylated cytosines remain unchanged, enabling methylation status differentiation [101]. |
| 3. PCR Amplification | Amplify target regions of interest using PCR primers specific for bisulfite-converted DNA. | Design primers to avoid CpG sites to ensure unbiased amplification of both methylated and unmethylated sequences. |
| 4. CE Separation | Inject PCR products into a CE system. Use a fused-silica capillary and an appropriate alkaline buffer. | Capillary inner diameter: 20-100 µm. Applied voltage: up to 30 kV. The separation is based on the size and charge differences of the amplified fragments [99]. |
| 5. MS Detection & Data Analysis | Couple the CE effluent online to an ESI-MS. Monitor specific mass signals corresponding to methylated and unmethylated sequences. | A mass deviation of < 30 ppm and a resolution > 5000 are considered minimum requirements for confident biomarker identification [100]. |
Novel Clinical Diagnostic Applications
The integration of CE-MS is finding particularly strong utility in the field of minimally invasive diagnostics, especially through the analysis of liquid biopsies.
Liquid Biopsy and Cancer Diagnostics
Liquid biopsies—the analysis of tumor-derived material in body fluids like blood, urine, and saliva—represent a paradigm shift in cancer management [101]. CE-MS is exceptionally well-suited for the discovery and validation of biomarkers in these complex matrices.
DNA Methylation Biomarkers: Cancer-specific alterations in DNA methylation are stable, occur early in tumorigenesis, and are highly amenable to detection by CE-MS [101]. Promoter hypermethylation of tumor suppressor genes can be detected with high specificity in circulating tumor DNA (ctDNA). For cancers in direct contact with bodily fluids, such as bladder cancer in urine, the sensitivity of mutation detection can be as high as 87% in urine versus only 7% in plasma, demonstrating the power of using proximal fluids [101]. CE-MS facilitates the precise measurement of the ratio of methylated to unmethylated DNA fragments, providing a robust quantitative biomarker.
Overcoming Blood-Based Limitations: While blood is a common liquid biopsy source, the high dilution of tumor-derived signals presents a challenge. Local fluids like urine (for urological cancers), bile (for biliary tract cancers), and cerebrospinal fluid (for central nervous system cancers) often contain a higher concentration of relevant biomarkers and lower background noise, making them ideal sources for CE-MS analysis [101].
Proteomic and Peptidomic Pattern Recognition for Disease
Beyond DNA analysis, CE-MS has proven highly successful in profiling the low-molecular-weight proteome and peptidome of body fluids for diagnostic purposes.
- Renal Disease Diagnosis: Studies have established that CE-MS can rapidly evaluate hundreds to thousands of polypeptides in urine samples [102]. This technology has successfully identified distinct polypeptide patterns that allow for the differentiation of primary renal diseases, such as minimal change disease (MCD), membranous glomerulonephritis (MGN), and focal segmental glomerulosclerosis (FSGS), even when patients are in clinical remission [102]. This approach moves beyond single biomarkers to utilize a panel of markers for superior diagnostic specificity.
Forensic Genomics and Human Identification
The application of CE-MS is also expanding in forensic science, which relies heavily on DNA analysis.
- Transition to SNP Analysis: While traditional forensic science uses CE with fluorescence detection for Short Tandem Repeat (STR) profiling, the field is increasingly moving toward Single Nucleotide Polymorphism (SNP) testing via Mass Spectrometry for degraded samples or extended kinship analysis [103]. MS provides the accurate mass determination needed to distinguish between SNP alleles.
- Forensic Genetic Genealogy (FGG): Dense SNP testing, powered by advanced sequencing and MS detection, enables FGG. This approach can solve cold cases by identifying unknown individuals or suspects through distant familial relationships, a feat impossible with standard STR profiling [103]. CE and MS play a role in the validation and confirmation stages of these powerful genomic analyses.
The Scientist's Toolkit: Essential Reagents and Materials
Successful implementation of CE-MS in a research setting requires a suite of specialized reagents and materials.
Table 3: Key Research Reagent Solutions for CE-MS Workflows
| Item | Function | Application Example |
|---|---|---|
| Fused-Silica Capillaries | The core separation column where electrophoresis occurs. Inner diameter and coating affect resolution and electroosmotic flow. | Standard for most CE and CE-MS separations of DNA and proteins [99]. |
| Electrolyte Buffers | Create the pH and ionic environment necessary for controlled electrophoretic separation and stable electrospray. | A critical component for both CE separation and subsequent ESI-MS ionization [100]. |
| Bisulfite Conversion Kit | Chemically modifies DNA to differentiate methylated from unmethylated cytosines for epigenetic studies. | Essential for preparing DNA samples for methylation biomarker analysis in liquid biopsies [101]. |
| Solid-Phase Extraction Cartridges | Desalt and concentrate samples prior to CE-MS analysis to improve sensitivity and prevent ion source contamination. | Used in urine peptidomics to purify peptides and remove interfering salts [102]. |
| Internal Standard Mixtures | Synthetic, isotope-labeled analogs of target analytes used for precise quantification in MS. | Added to samples to correct for variability in sample preparation and ionization efficiency [100]. |
| Capillary Coating Reagents | Modify the inner capillary wall to suppress analyte adsorption and manage electroosmotic flow. | Crucial for analyzing basic proteins or peptides that might stick to the bare silica surface [99]. |
Workflow and Pathway Visualizations
CE-MS Workflow for Liquid Biopsy Analysis
The following diagram illustrates the integrated workflow for analyzing DNA methylation biomarkers from a liquid biopsy sample using CE-MS.
Clinical Translation Pathway for Biomarkers
The journey from biomarker discovery to clinical application is a multi-stage process, as shown in the pathway below.
The integration of Capillary Electrophoresis with Mass Spectrometry has matured into a formidable analytical platform that is uniquely positioned to address some of the most pressing challenges in modern clinical diagnostics and DNA research. Its ability to provide high-resolution separation coupled with sensitive and specific detection makes it ideal for navigating the complexity of liquid biopsies, from discovering DNA methylation biomarkers to defining disease-specific peptidomic patterns. Future directions will be shaped by continued miniaturization, leading to portable systems for point-of-care testing, increased automation for high-throughput screening in drug development, and the refinement of CE-MS methodologies to further improve sensitivity for early-stage disease detection [99]. As the fields of genomics and proteomics continue to converge, CE-MS stands as a pivotal technology that will enable researchers and clinicians to translate molecular signatures into actionable diagnostic information, ultimately paving the way for more personalized and effective medical interventions.
Conclusion
Capillary electrophoresis has firmly established itself as a cornerstone technology for DNA and RNA analysis, offering unparalleled resolution, automation, and efficiency. Its principles of electroosmotic flow and gel-facilitated sieving enable precise separations critical for applications ranging from forensic science to the development of next-generation mRNA therapeutics. As the field advances, the optimization of high-throughput workflows and the integration with other analytical techniques like mass spectrometry will further expand its utility. For researchers and drug development professionals, mastering CE is not just about using a tool—it is about leveraging a versatile and powerful platform that continues to drive innovation in biomedical research and clinical diagnostics, promising new frontiers in personalized medicine and complex biomarker discovery.
References
- 1. Capillary electrophoresis of DNA- Explained [https://geneticeducation.co.in/capillary-electrophoresis-of-dna-explained/]
- 2. Applications of Capillary Electrophoresis in Forensic Science [https://www.labx.com/resources/applications-of-capillary-electrophoresis-in-forensic-science/5644]
- 3. What are the applications of capillary electrophoresis? [https://www.thermofisher.com/us/en/home/life-science/sequencing/sequencing-learning-center/capillary-electrophoresis-information/capillary-electrophoresis-applications.html]
- 4. Capillary Electrophoresis and the DNA Forensics ... [https://www.labmanager.com/capillary-electrophoresis-and-the-dna-forensics-renaissance-23975]
- 5. An Introduction to Capillary Electrophoresis: Theory, ... [https://www.technologynetworks.com/analysis/articles/an-introduction-to-capillary-electrophoresis-theory-practice-and-applications-378737]
- 6. Capillary electrophoresis applied to DNA: determining and ... [https://pmc.ncbi.nlm.nih.gov/articles/PMC4551542/]
- 7. Capillary Electrophoresis [https://chem.libretexts.org/Bookshelves/Analytical_Chemistry/Supplemental_Modules_(Analytical_Chemistry)/Instrumentation_and_Analysis/Capillary_Electrophoresis]
- 8. Capillary electrophoresis [https://en.wikipedia.org/wiki/Capillary_electrophoresis]
- 9. Capillary Electrophoresis in Focus: A Solution for ... [https://www.aurorabiomed.com/capillary-electrophoresis-in-focus-a-solution-for-characterization-and-quality-control/?srsltid=AfmBOopGA8dSTkccj9iflg6vJxlStFJUvK_6jUA9W-VWBel_piUgVEf9]
- 10. Lab 6: Capillary Electrophoresis [https://chem.libretexts.org/Courses/University_of_California_Davis/CHE_115%3A_Instrumental_Analysis_-_Lab_Manual/Lab_6%3A_Capillary_Electrophoresis]
- 11. Measurement of electroosmotic flow in capillary and ... [https://www.sciencedirect.com/science/article/abs/pii/S0021967307014938]
- 12. Optimizing mRNA Analysis Using Capillary Electrophoresis [https://www.chromatographyonline.com/view/optimizing-mrna-analysis-using-capillary-electrophoresis]
- 13. Effect of the matrix on DNA electrophoretic mobility - PMC [https://pmc.ncbi.nlm.nih.gov/articles/PMC2643323/]
- 14. Novel elution strategy for monitoring DNA counter ... [https://pubmed.ncbi.nlm.nih.gov/15230535/]
- 15. The effect of electrophoretic parameters on separation ... [https://www.sciencedirect.com/science/article/abs/pii/S0003269718303932]
- 16. Capillary Electrophoresis Can Detect the Simultaneous ... [https://pmc.ncbi.nlm.nih.gov/articles/PMC12366245/]
- 17. Capillary Electrophoresis: Overview & Applications [https://www.excedr.com/resources/capillary-electrophoresis-overview]
- 18. Protein Separation by Capillary Gel Electrophoresis [https://pmc.ncbi.nlm.nih.gov/articles/PMC3227876/]
- 19. Capillary Electrophoresis vs. Gel Electrophoresis [https://www.labx.com/resources/capillary-electrophoresis-vs-gel-electrophoresis-a-comprehensive-guide/5548]
- 20. Capillary Sieving Electrophoresis - an overview [https://www.sciencedirect.com/topics/chemistry/capillary-sieving-electrophoresis]
- 21. Factors affecting the separation performance of proteins in ... [https://www.sciencedirect.com/science/article/abs/pii/S157002321732041X]
- 22. High dynamic range capillary electrophoresis method for ... [https://www.nature.com/articles/s41598-025-01884-5]
- 23. Characterizing ssRNA and dsRNA electrophoretic behavior [https://pubs.rsc.org/en/content/articlehtml/2025/an/d5an00381d]
- 24. A model for the mobility of single-stranded DNA in capillary ... [https://pubmed.ncbi.nlm.nih.gov/8354234/]
- 25. Ultrafast and Wide Range Analysis of DNA Molecules ... [https://www.nature.com/articles/srep05252]
- 26. Size analysis of large DNA molecules by relaxation time ... [https://pubs.rsc.org/en/content/articlehtml/2025/lc/d4lc00998c]
- 27. POP-4™ Polymer, for 3500/SeqStudio™ Flex 384 Samples [https://www.thermofisher.com/order/catalog/product/4393715]
- 28. Impact of polymer hydrophobicity on the properties and ... [https://pubmed.ncbi.nlm.nih.gov/11296929/]
- 29. Versatile low-viscosity sieving for nondenaturing DNA... matrices [https://pubmed.ncbi.nlm.nih.gov/9059830/]
- 30. Capillary Electrophoresis (CE) or Next-Generation ... [https://www.thermofisher.com/blog/behindthebench/capillary-electrophoresis-or-next-generation-sequencing-for-str-analysis/]
- 31. Capillary Electrophoresis (CE) for Forensic DNA Analysis [https://www.promega.com/products/forensic-dna-analysis-ce/]
- 32. Forensic DNA Profiling: Autosomal Short Tandem Repeat ... [https://pmc.ncbi.nlm.nih.gov/articles/PMC7444828/]
- 33. Advances in Capillary Electrophoresis and the Implications ... [https://pmc.ncbi.nlm.nih.gov/articles/PMC5521262/]
- 34. Improving STR typing for low template DNA by abasic-site- ... [https://www.nature.com/articles/s41598-025-19847-1]
- 35. Paternity testing and forensic DNA typing by multiplex STR ... [https://www.sciencedirect.com/science/article/pii/S1687157X12000194]
- 36. Developmental Validation of DNA Quantitation System ... [https://pmc.ncbi.nlm.nih.gov/articles/PMC12028859/]
- 37. Effective use of the degradation index from human DNA ... [https://www.sciencedirect.com/science/article/pii/S187249732500122X]
- 38. STR Data Analysis and Interpretation for Forensic Analysts [https://nij.ojp.gov/nij-hosted-online-training-courses/str-data-analysis-and-interpretation-forensic-analysts/data-troubleshooting/controls]
- 39. Role of Capillary Electrophoresis in Drug Development [https://www.thermofisher.com/blog/behindthebench/the-role-of-capillary-electrophoresis-ce-in-drug-development/]
- 40. Developing a high-throughput capillary gel electrophoresis ... [https://pubmed.ncbi.nlm.nih.gov/41014908/]
- 41. Capillary Electrophoresis Market Size, Share | Industry [2032] [https://www.fortunebusinessinsights.com/capillary-electrophoresis-market-114443]
- 42. Capillary Electrophoresis Market Size & Forecast 2025–2033 [https://www.datamintelligence.com/research-report/capillary-electrophoresis-market]
- 43. Capillary Electrophoresis with Three-Color Fluorescence ... [https://pmc.ncbi.nlm.nih.gov/articles/PMC3509344/]
- 44. Current and emerging trends in techniques for plant ... [https://pmc.ncbi.nlm.nih.gov/articles/PMC10200959/]
- 45. Methods for Microbial Detection and Identification [https://www.cd-genomics.com/microbioseq/methods-for-microbial-detection-and-identification.html]
- 46. Pathogen Discovery, Detection, and Diagnostics - NCBI - NIH [https://www.ncbi.nlm.nih.gov/books/NBK221492/]
- 47. Microbial Identification and Strain Typing Using Molecular ... [https://www.rapidmicrobiology.com/test-method/molecular-techniques-for-microbial-identification-and-typing]
- 48. Microbe-ID: an open source toolbox for microbial ... [https://pmc.ncbi.nlm.nih.gov/articles/PMC4994078/]
- 49. Molecular Methods for Pathogenic Bacteria Detection and ... [https://www.mdpi.com/2073-4441/13/24/3551]
- 50. Potential Use of Microbial Community Genomes in Various ... [https://www.frontiersin.org/journals/microbiology/articles/10.3389/fmicb.2022.708335/full]
- 51. Sanger Sequencing and Fragment Analysis by CE [https://www.thermofisher.com/us/en/home/life-science/sequencing/sanger-sequencing.html]
- 52. Guide to Sanger Sequencing by Capillary Electrophoresis [https://www.thermofisher.com/blog/behindthebench/complete-guide-to-sanger-sequencing-by-capillary-electrophoresis-from-education-to-application/]
- 53. The Future of Sanger Sequencing: Technical Development ... [https://www.cd-genomics.com/blog/sanger-sequencing-technology-innovation/]
- 54. DNA Sequencing by Capillary Electrophoresis - PMC [https://pmc.ncbi.nlm.nih.gov/articles/PMC2782523/]
- 55. Next-Generation Sequencers vs. Sanger ... [https://www.labx.com/resources/next-generation-sequencers-vs-sanger-sequencers-key-differences/5597]
- 56. Electrophoresis with Sanger Sequencing [https://www.thermofisher.com/us/en/home/life-science/sequencing/sanger-sequencing/sanger-dna-sequencing/electrophoresis-sanger-sequencing.html]
- 57. Analyzing Sanger Sequencing Data [https://blog.genewiz.com/analyzing-sanger-sequencing-data]
- 58. Sanger Sequencing | GENEWIZ from Azenta [https://www.genewiz.com/public/services/sanger-sequencing]
- 59. Optimization of gene knockout approaches and sgRNA ... [https://www.nature.com/articles/s41598-025-24184-4]
- 60. Opportunities and Challenges Associated with Clinical ... [https://pmc.ncbi.nlm.nih.gov/articles/PMC6504171/]
- 61. Highly sensitive analysis of nucleic acids using capillary ... [https://www.sciencedirect.com/science/article/abs/pii/S1570023214007181]
- 62. Capillary Electrophoresis (CE) Instruments [https://www.promega.com/products/capillary-electrophoresis-ce-instruments/]
- 63. High-Precision Genotyping by Denaturing Capillary ... [https://pmc.ncbi.nlm.nih.gov/articles/PMC310688/]
- 64. The Effect of Column Length, Applied Voltage, Gel Type, ... [https://pubmed.ncbi.nlm.nih.gov/9237572/]
- 65. Effect of temperature on the separation of DNA fragments ... [https://www.sciencedirect.com/science/article/abs/pii/S0378434799005447]
- 66. High-Resolution capillary electrophoresis separation of ... [https://www.sciencedirect.com/science/article/pii/S0021967320300406]
- 67. Accurate DNA Fragment Sizing by Capillary ... [https://pmc.ncbi.nlm.nih.gov/articles/PMC3483637/]
- 68. Tech Compare: Capillary vs. Gel Electrophoresis [https://www.labcompare.com/10-Featured-Articles/585409-Tech-Compare-Capillary-vs-Gel-Electrophoresis/]
- 69. Capillary vs. Gel Electrophoresis: Differences, Advantages, ... [https://www.bostonind.com/blog/capillary-vs-gel-electrophoresis-differences-advantages-and-applications?srsltid=AfmBOoqZF-0Thu689-FtjQ4N5vvb8XMaQGqminkcuAM4JzM4JvYJCqfN]
- 70. Method Development for Capillary Electrophoresis [https://www.labx.com/resources/method-development-for-capillary-electrophoresis-optimization-strategies/5638]
- 71. Optimization of Capillary Electrophoresis by Central ... [https://www.mdpi.com/2076-3298/12/1/22]
- 72. Capillary Electrophoresis Artifact Due to Eosin [https://pmc.ncbi.nlm.nih.gov/articles/PMC1867509/]
- 73. Developing a High-Throughput Capillary Gel ... [https://www.sciencedirect.com/science/article/abs/pii/S0021967325007319]
- 74. A Comprehensive Evaluation of Analytical Method ... [https://pmc.ncbi.nlm.nih.gov/articles/PMC12039171/]
- 75. Structural analysis of a long single-stranded RNA molecule ... [https://sciex.com/tech-notes/biopharma/structural-analysis-of-a-long-single-stranded-rna-molecule-by-ch]
- 76. Analytical factors for optimization of chain-length ... [https://www.sciencedirect.com/science/article/pii/S002196732500367X]
- 77. Challenges and Solutions in the Analysis of Degraded ... [https://www.forensicmag.com/Forensic-Tips/608727-Challenges-and-Solutions-in-the-Analysis-of-Degraded-DNA-Samples/]
- 78. Analysis of Human Degraded DNA in Forensic Genetics [https://www.mdpi.com/2073-4425/16/11/1375]
- 79. Enhancing trace DNA profile recovery in forensic casework ... [https://www.nature.com/articles/s41598-025-88164-4]
- 80. Development of mRNA Lipid Nanoparticles: Targeting and ... [https://pmc.ncbi.nlm.nih.gov/articles/PMC11432440/]
- 81. High-Throughput Quantification and Characterization of ... [https://pubmed.ncbi.nlm.nih.gov/39883007/]
- 82. Capillary Electrophoresis: Principles and Applications [https://www.labx.com/resources/capillary-electrophoresis-principles-and-applications/5637]
- 83. Optimization and validation of multi-coloured capillary ... [https://pmc.ncbi.nlm.nih.gov/articles/PMC2680902/]
- 84. Validation of alternative capillary electrophoresis detection ... [https://www.sciencedirect.com/science/article/abs/pii/S1872497316300266]
- 85. Validation of STR typing by capillary electrophoresis [https://pubmed.ncbi.nlm.nih.gov/11373005/]
- 86. How to Optimize Forensic Genotyping Settings for Accurate ... [https://go.softgenetics.com/guides/establishing-forensic-genotyping-settings]
- 87. Accurate DNA Fragment Sizing by Capillary Electrophoresis ... [https://pubmed.ncbi.nlm.nih.gov/18266391/]
- 88. Capillary vs. Gel Electrophoresis: Differences, Advantages, ... [https://www.bostonind.com/blog/capillary-vs-gel-electrophoresis-differences-advantages-and-applications?srsltid=AfmBOoqYMvA_PLwlUYgY2vep4FdJjIHp4RD6PYtPf8I9TU22ImgUbPLj]
- 89. Comparing Capillary Electrophoresis with HPLC: Efficiency ... [https://www.labx.com/resources/comparing-capillary-electrophoresis-with-hplc-efficiency-and-resolution/5643]
- 90. The Essence of Modern HPLC: Advantages, Limitations ... [https://www.chromatographyonline.com/view/essence-modern-hplc-advantages-limitations-fundamentals-and-opportunities]
- 91. Capillary vs. Gel Electrophoresis: Differences, Advantages, ... [https://www.bostonind.com/blog/capillary-vs-gel-electrophoresis-differences-advantages-and-applications?srsltid=AfmBOorM-1XYx96eC9brNqKrUeRIV2Wwd0u-6Gi78KcRa5F2Wss6kUpO]
- 92. The theory of DNA separation by capillary electrophoresis [https://www.sciencedirect.com/science/article/abs/pii/S0958166902000125]
- 93. Innovations in Liquid Chromatography: 2025 HPLC ... [https://www.chromatographyonline.com/view/innovations-in-liquid-chromatography-2025-hplc-column-and-accessories-review]
- 94. mRNA Quality Monitoring Market to Grow at 6.97% CAGR ... [https://www.towardshealthcare.com/insights/mrna-quality-monitoring-market-sizing]
- 95. Current Analytical Strategies for mRNA-Based Therapeutics [https://pmc.ncbi.nlm.nih.gov/articles/PMC11990077/]
- 96. Spotlighting the criticality of lipid quality control through a ... [https://www.nature.com/articles/s42004-025-01699-5]
- 97. A Comprehensive Lateral Flow Strip Assay for On-Site ... [https://pubmed.ncbi.nlm.nih.gov/40899607/]
- 98. Considerations for mRNA Product Development, ... [https://www.mdpi.com/2076-393X/13/5/473]
- 99. : Capillary , Techniques & Applications Electrophoresis Principles [https://eureka.patsnap.com/blog/capillary-electrophoresis-principles-and-applications/]
- 100. Capillary electrophoresis–mass spectrometry as a powerful ... [https://pmc.ncbi.nlm.nih.gov/articles/PMC2720435/]
- 101. a roadmap for DNA methylation biomarkers in liquid biopsies [https://www.nature.com/articles/s41388-025-03624-5]
- 102. Proteomic patterns established with capillary ... [https://www.sciencedirect.com/science/article/pii/S0085253815499880]
- 103. Genomics will forever reshape forensic science and ... [https://pmc.ncbi.nlm.nih.gov/articles/PMC12455754/]